
Industry Review Q2 2022
Macro-Economic Background
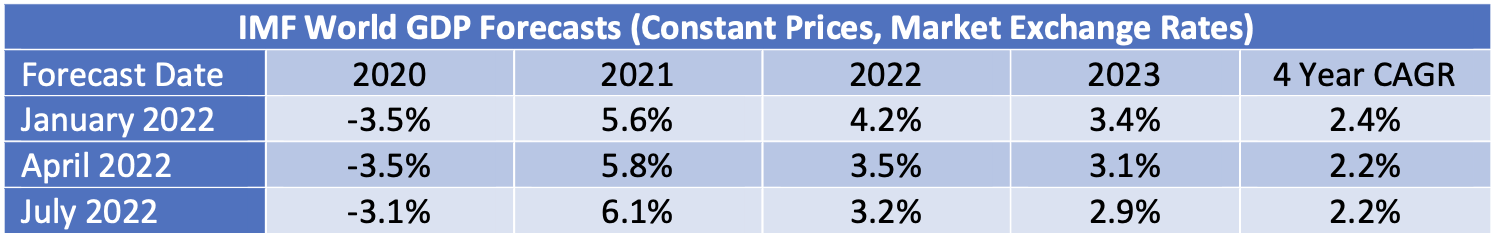
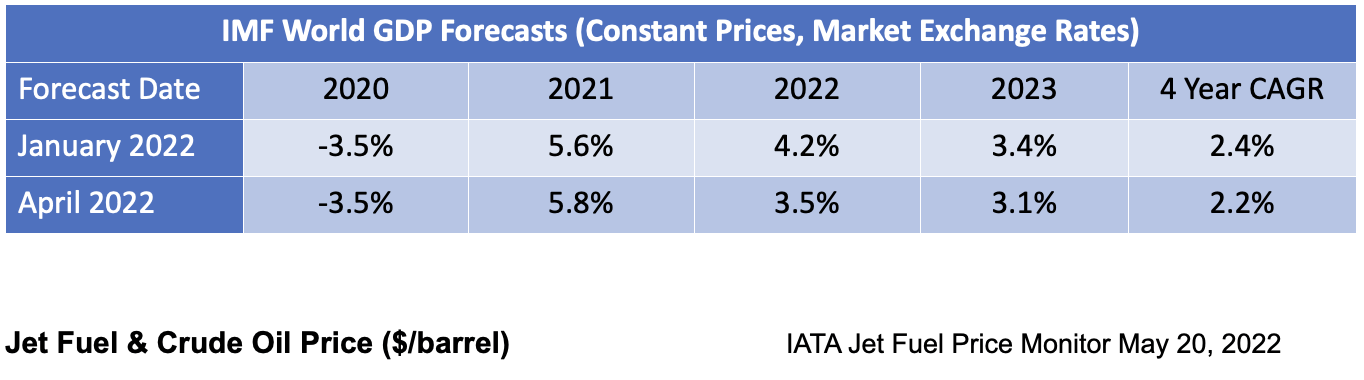
The IMF’s latest World Economic Outlook (July 2022) shows modest decreases for forecast growth in 2022 and 2023, although looking over the entire period since the onset of the pandemic these reductions are entirely offset by upward revisions to 2020 and 2021.
Global economic growth is vital to the long-term growth of air travel. However, in the next few years the key drivers of growth will likely be very specific to the airline industry, especially the recovery from the industry downturn caused by the Covid 19 pandemic.
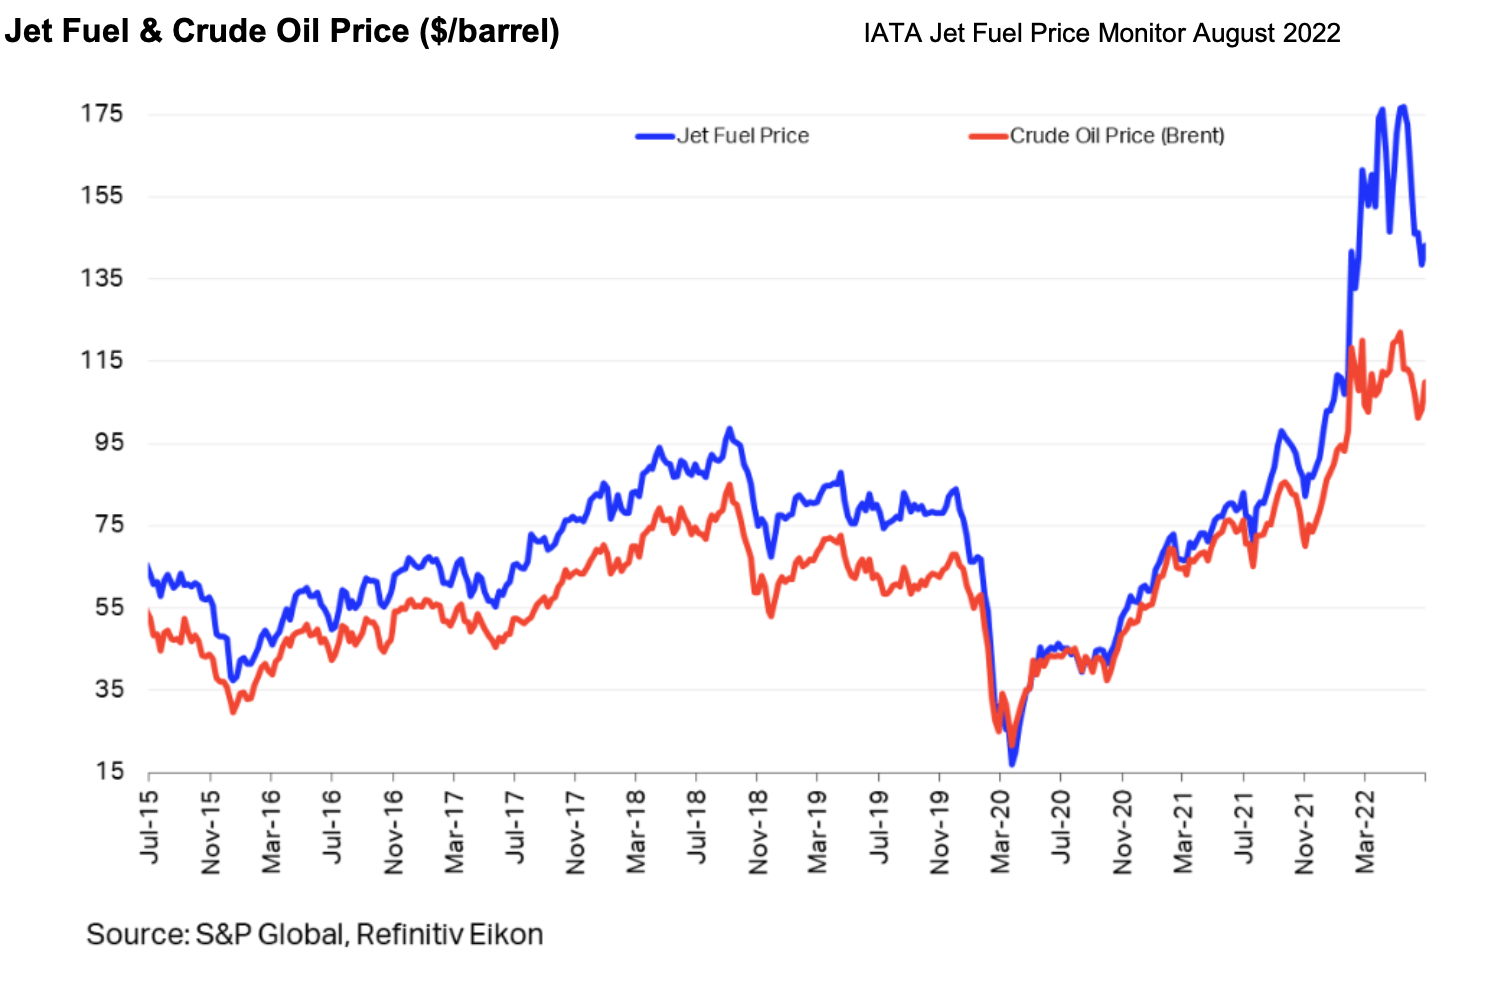
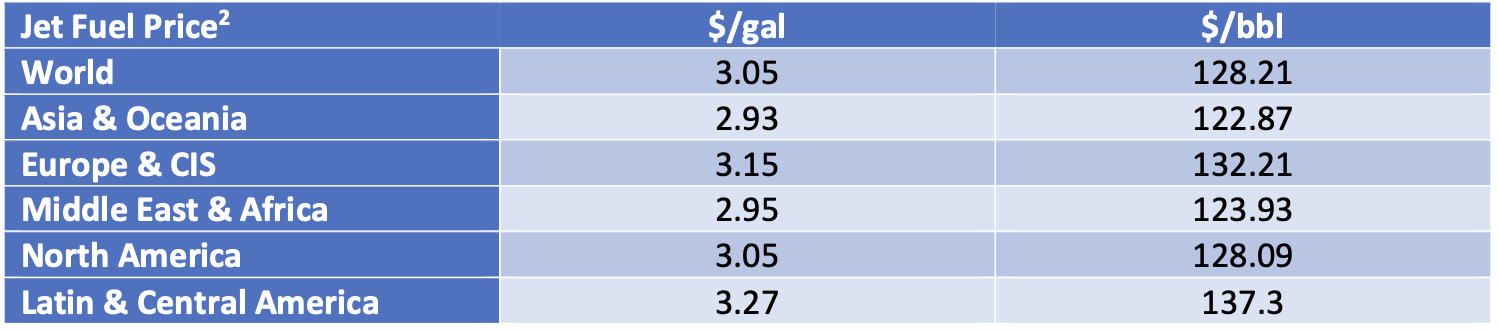
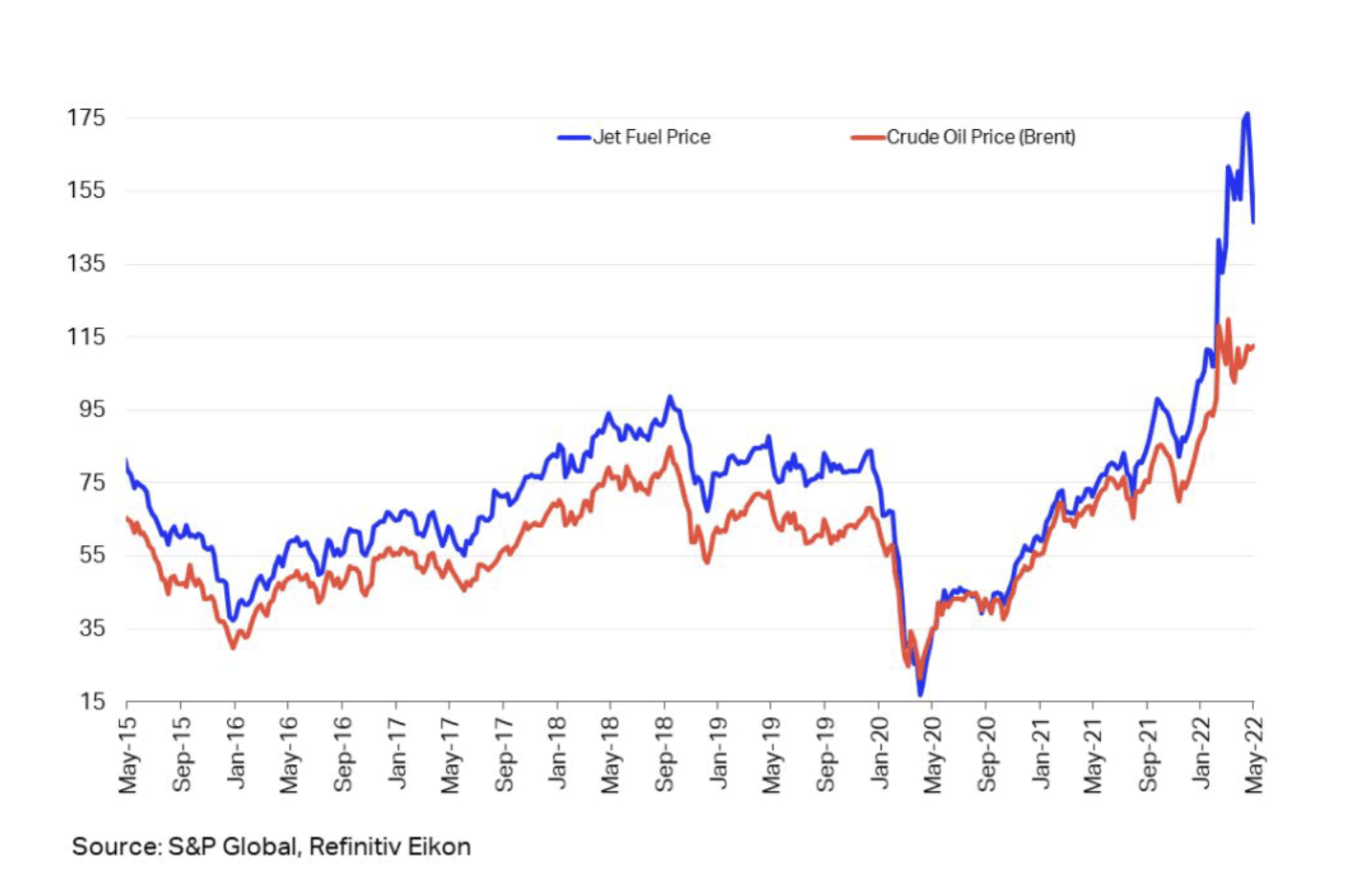
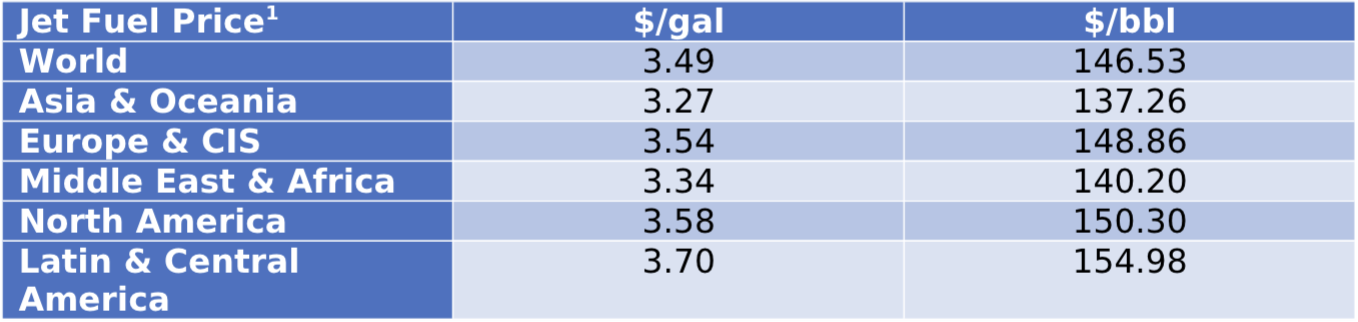
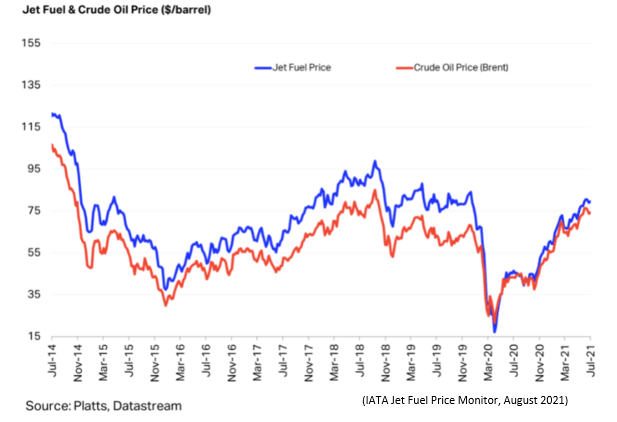
Fuel prices have dropped by nearly 50 cents per gallon since May, and the maximum spread between different regions has dropped from 13% to 11%. Although the reduction in variability between regions suggests that supply chain disruption is abating the “crack spread”[1] remains very high by historic standards.
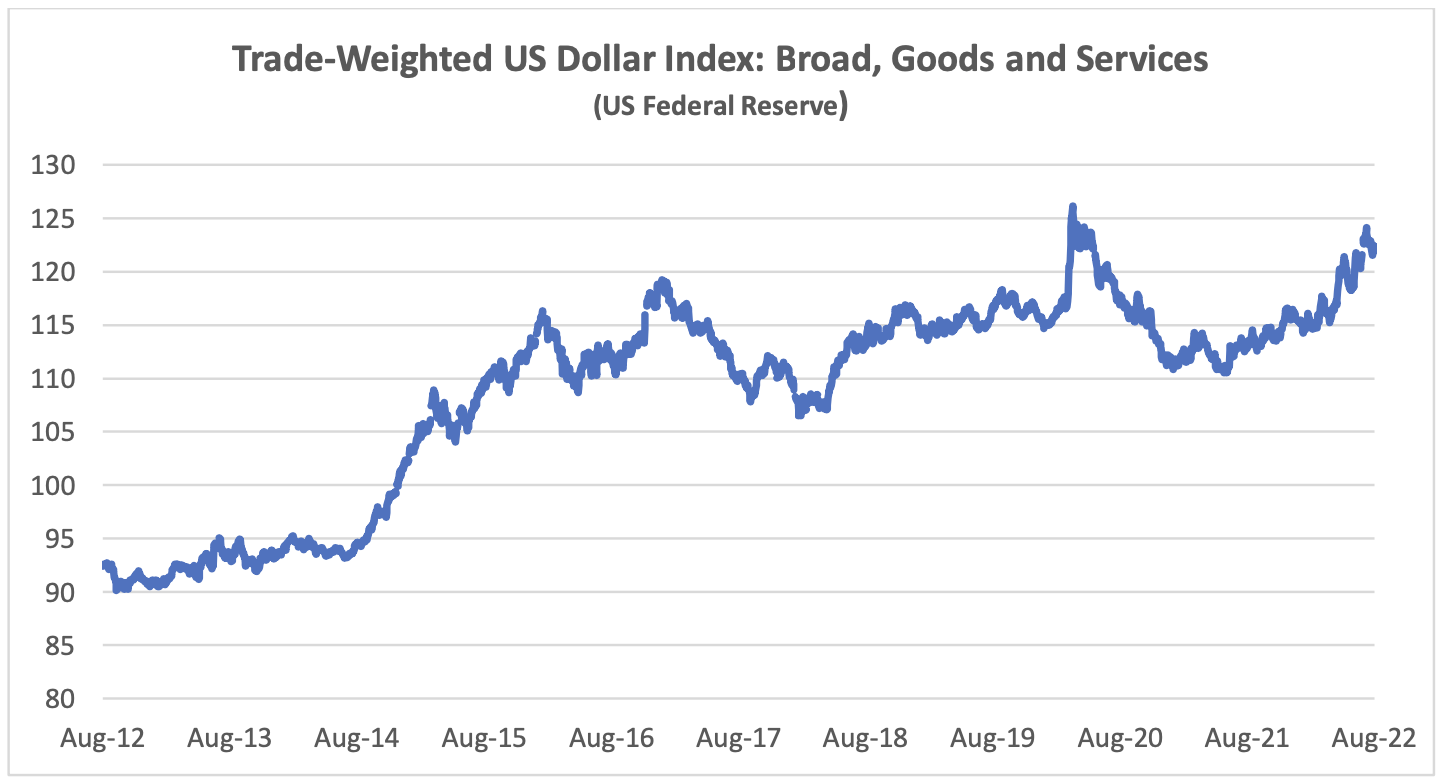
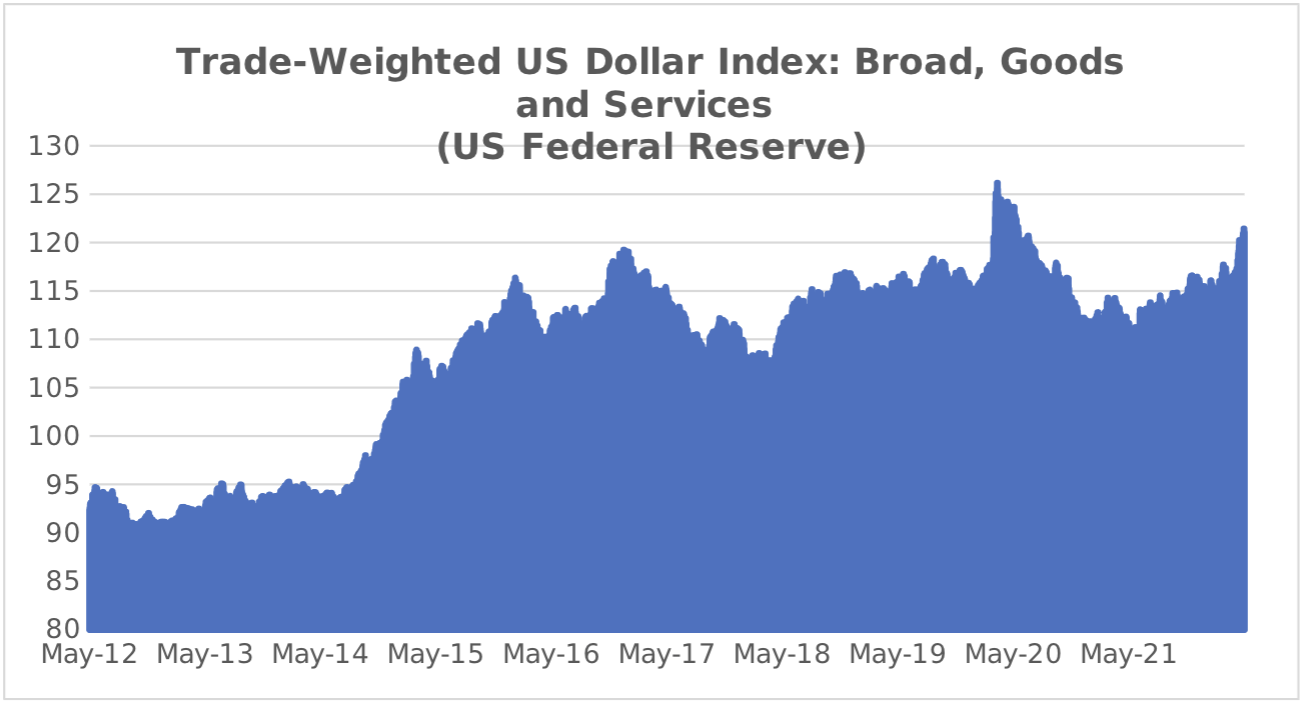
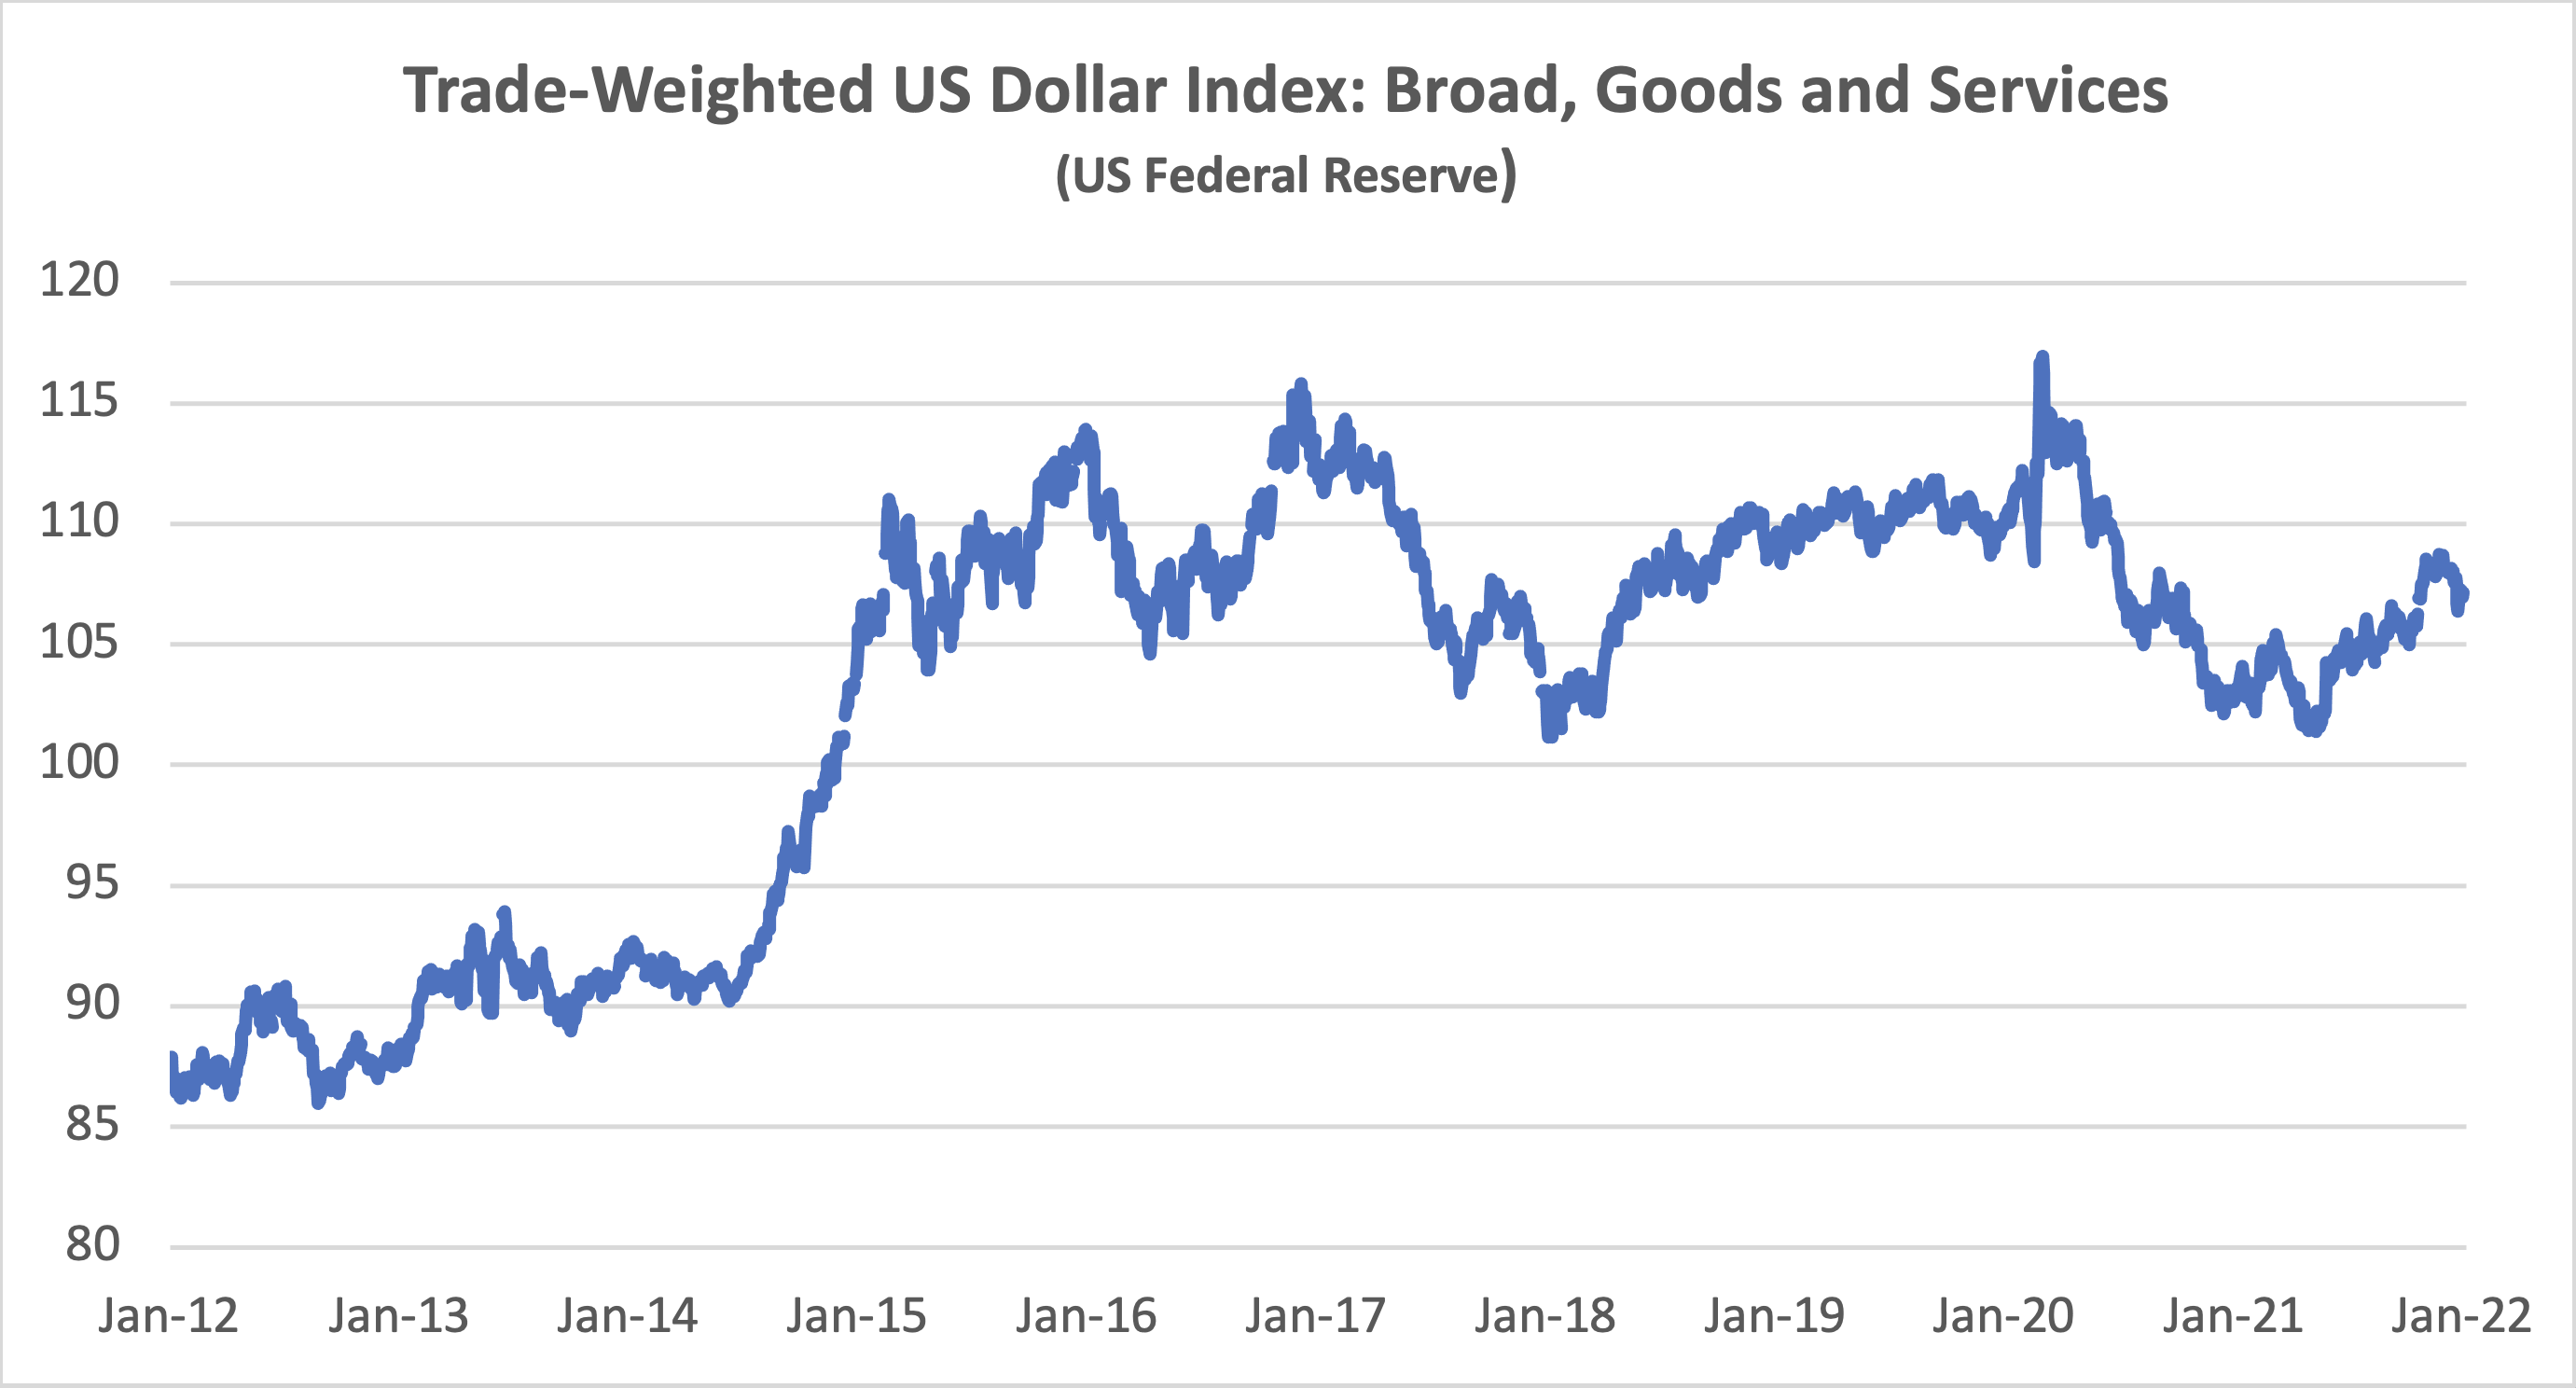
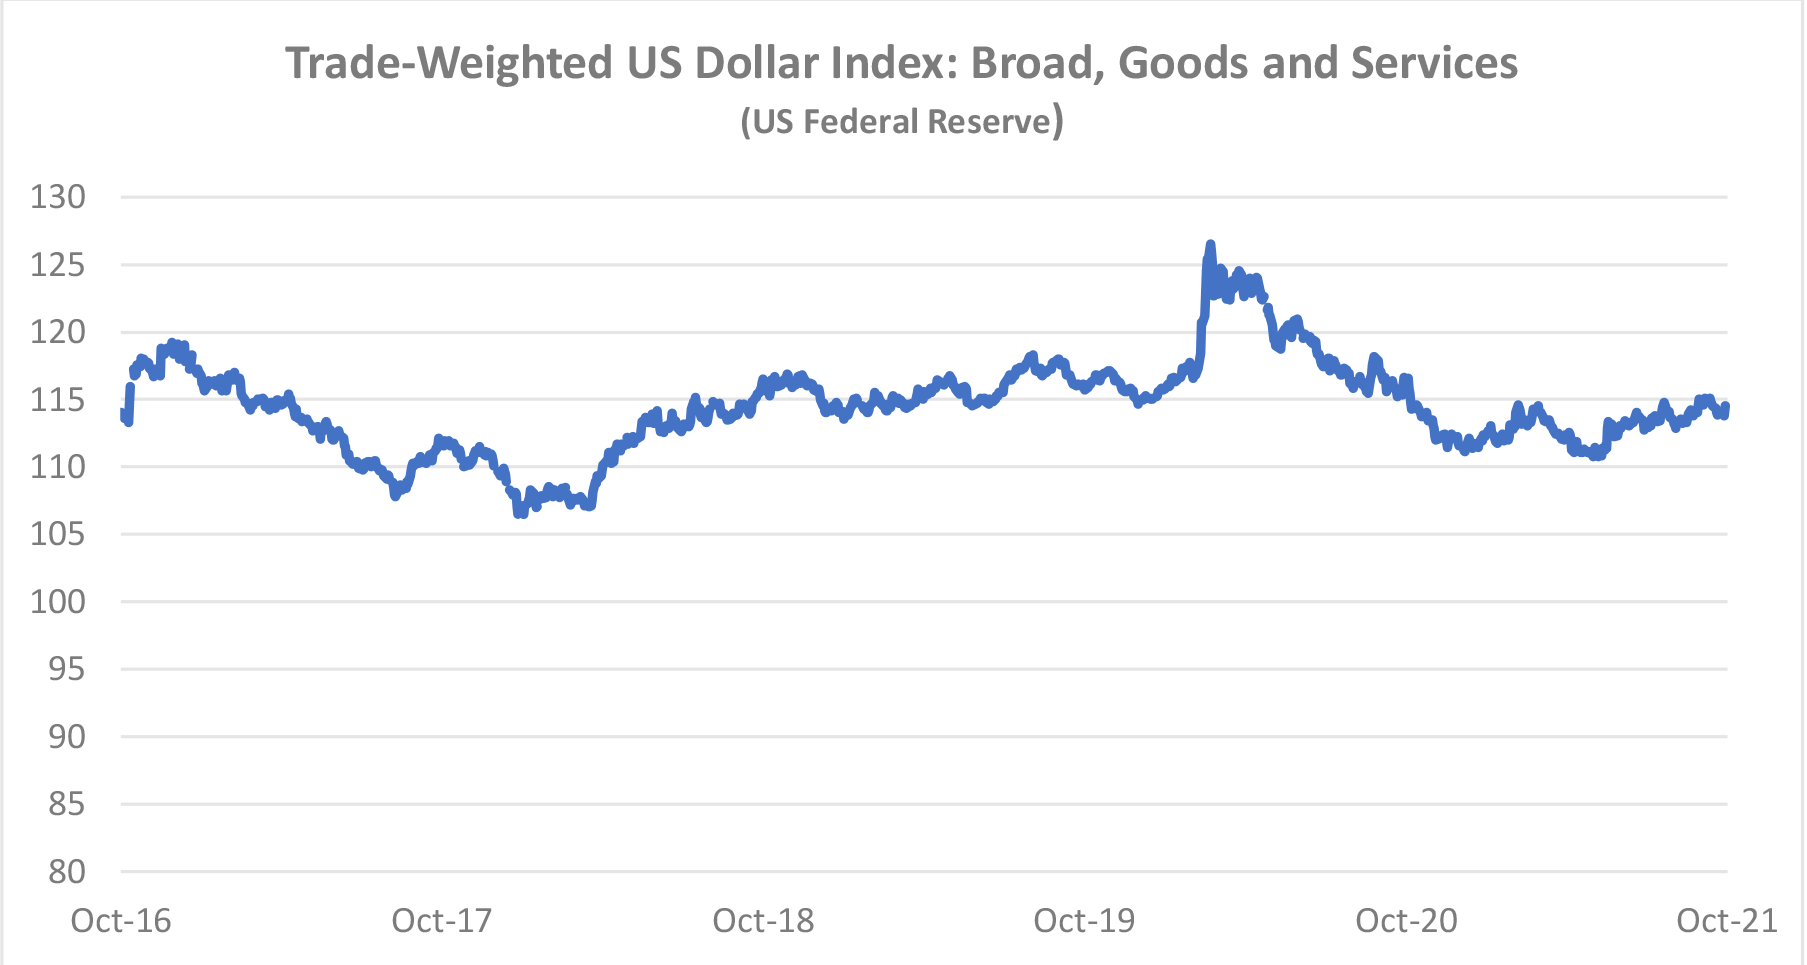
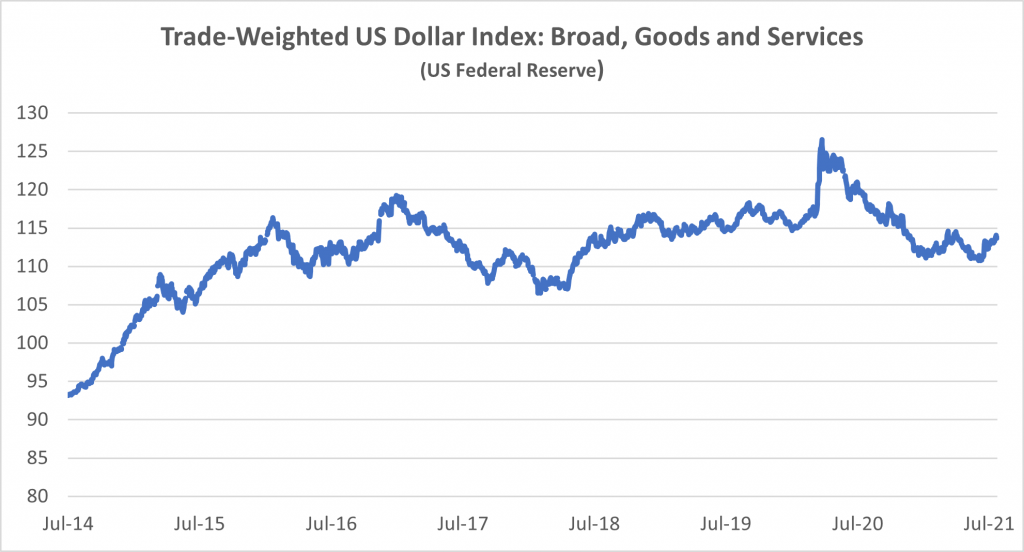
For airlines outside of the US the impact of the high cost of fuel has been compounded by a strengthening US Dollar. This is a very important factor in airline financial performance because so many airline costs are typically US Dollar-denominated – not just fuel but also aircraft rents, debt service, aircraft, and spare parts.
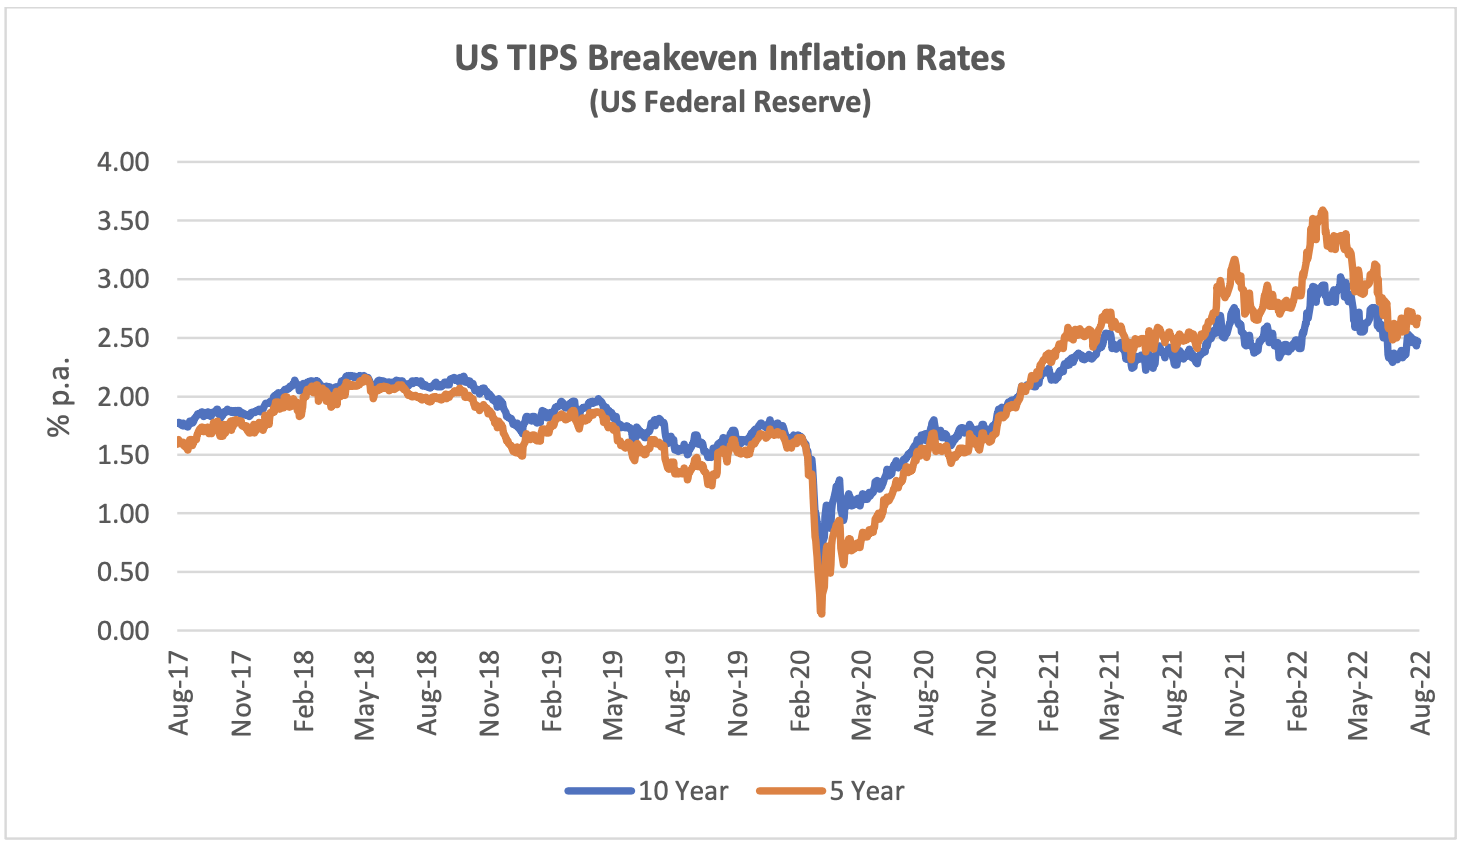
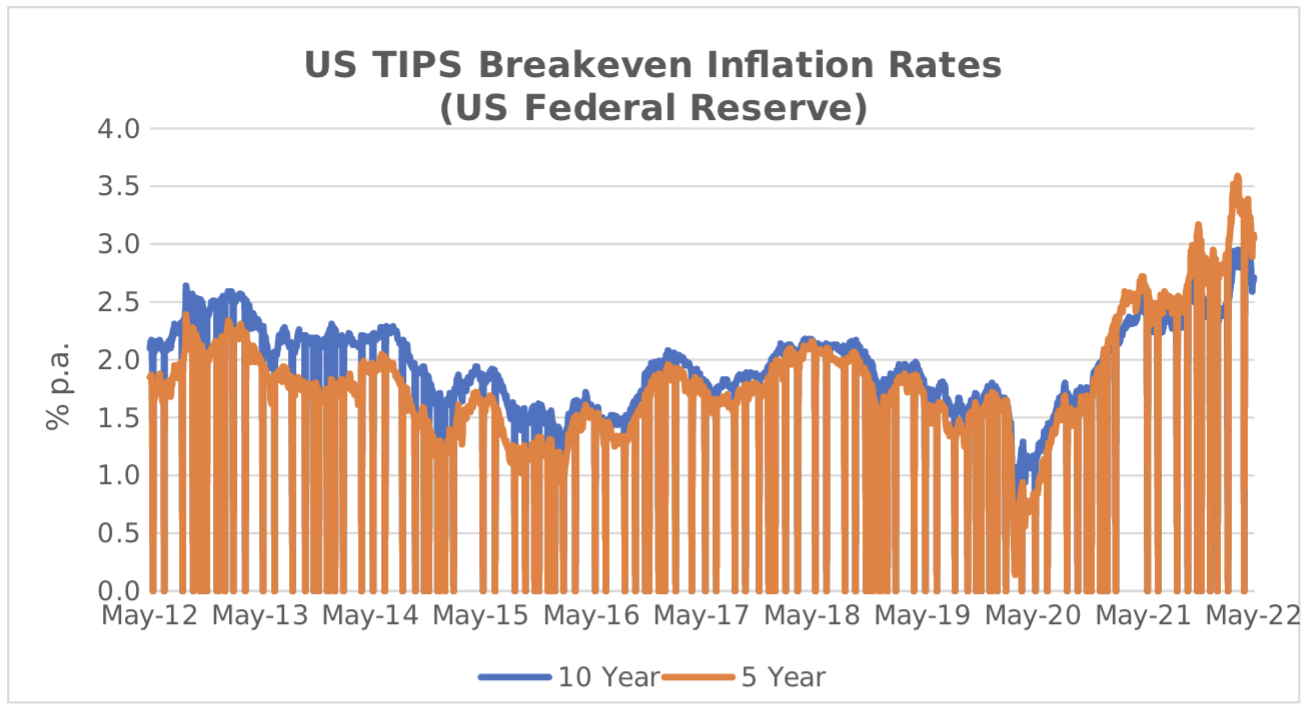
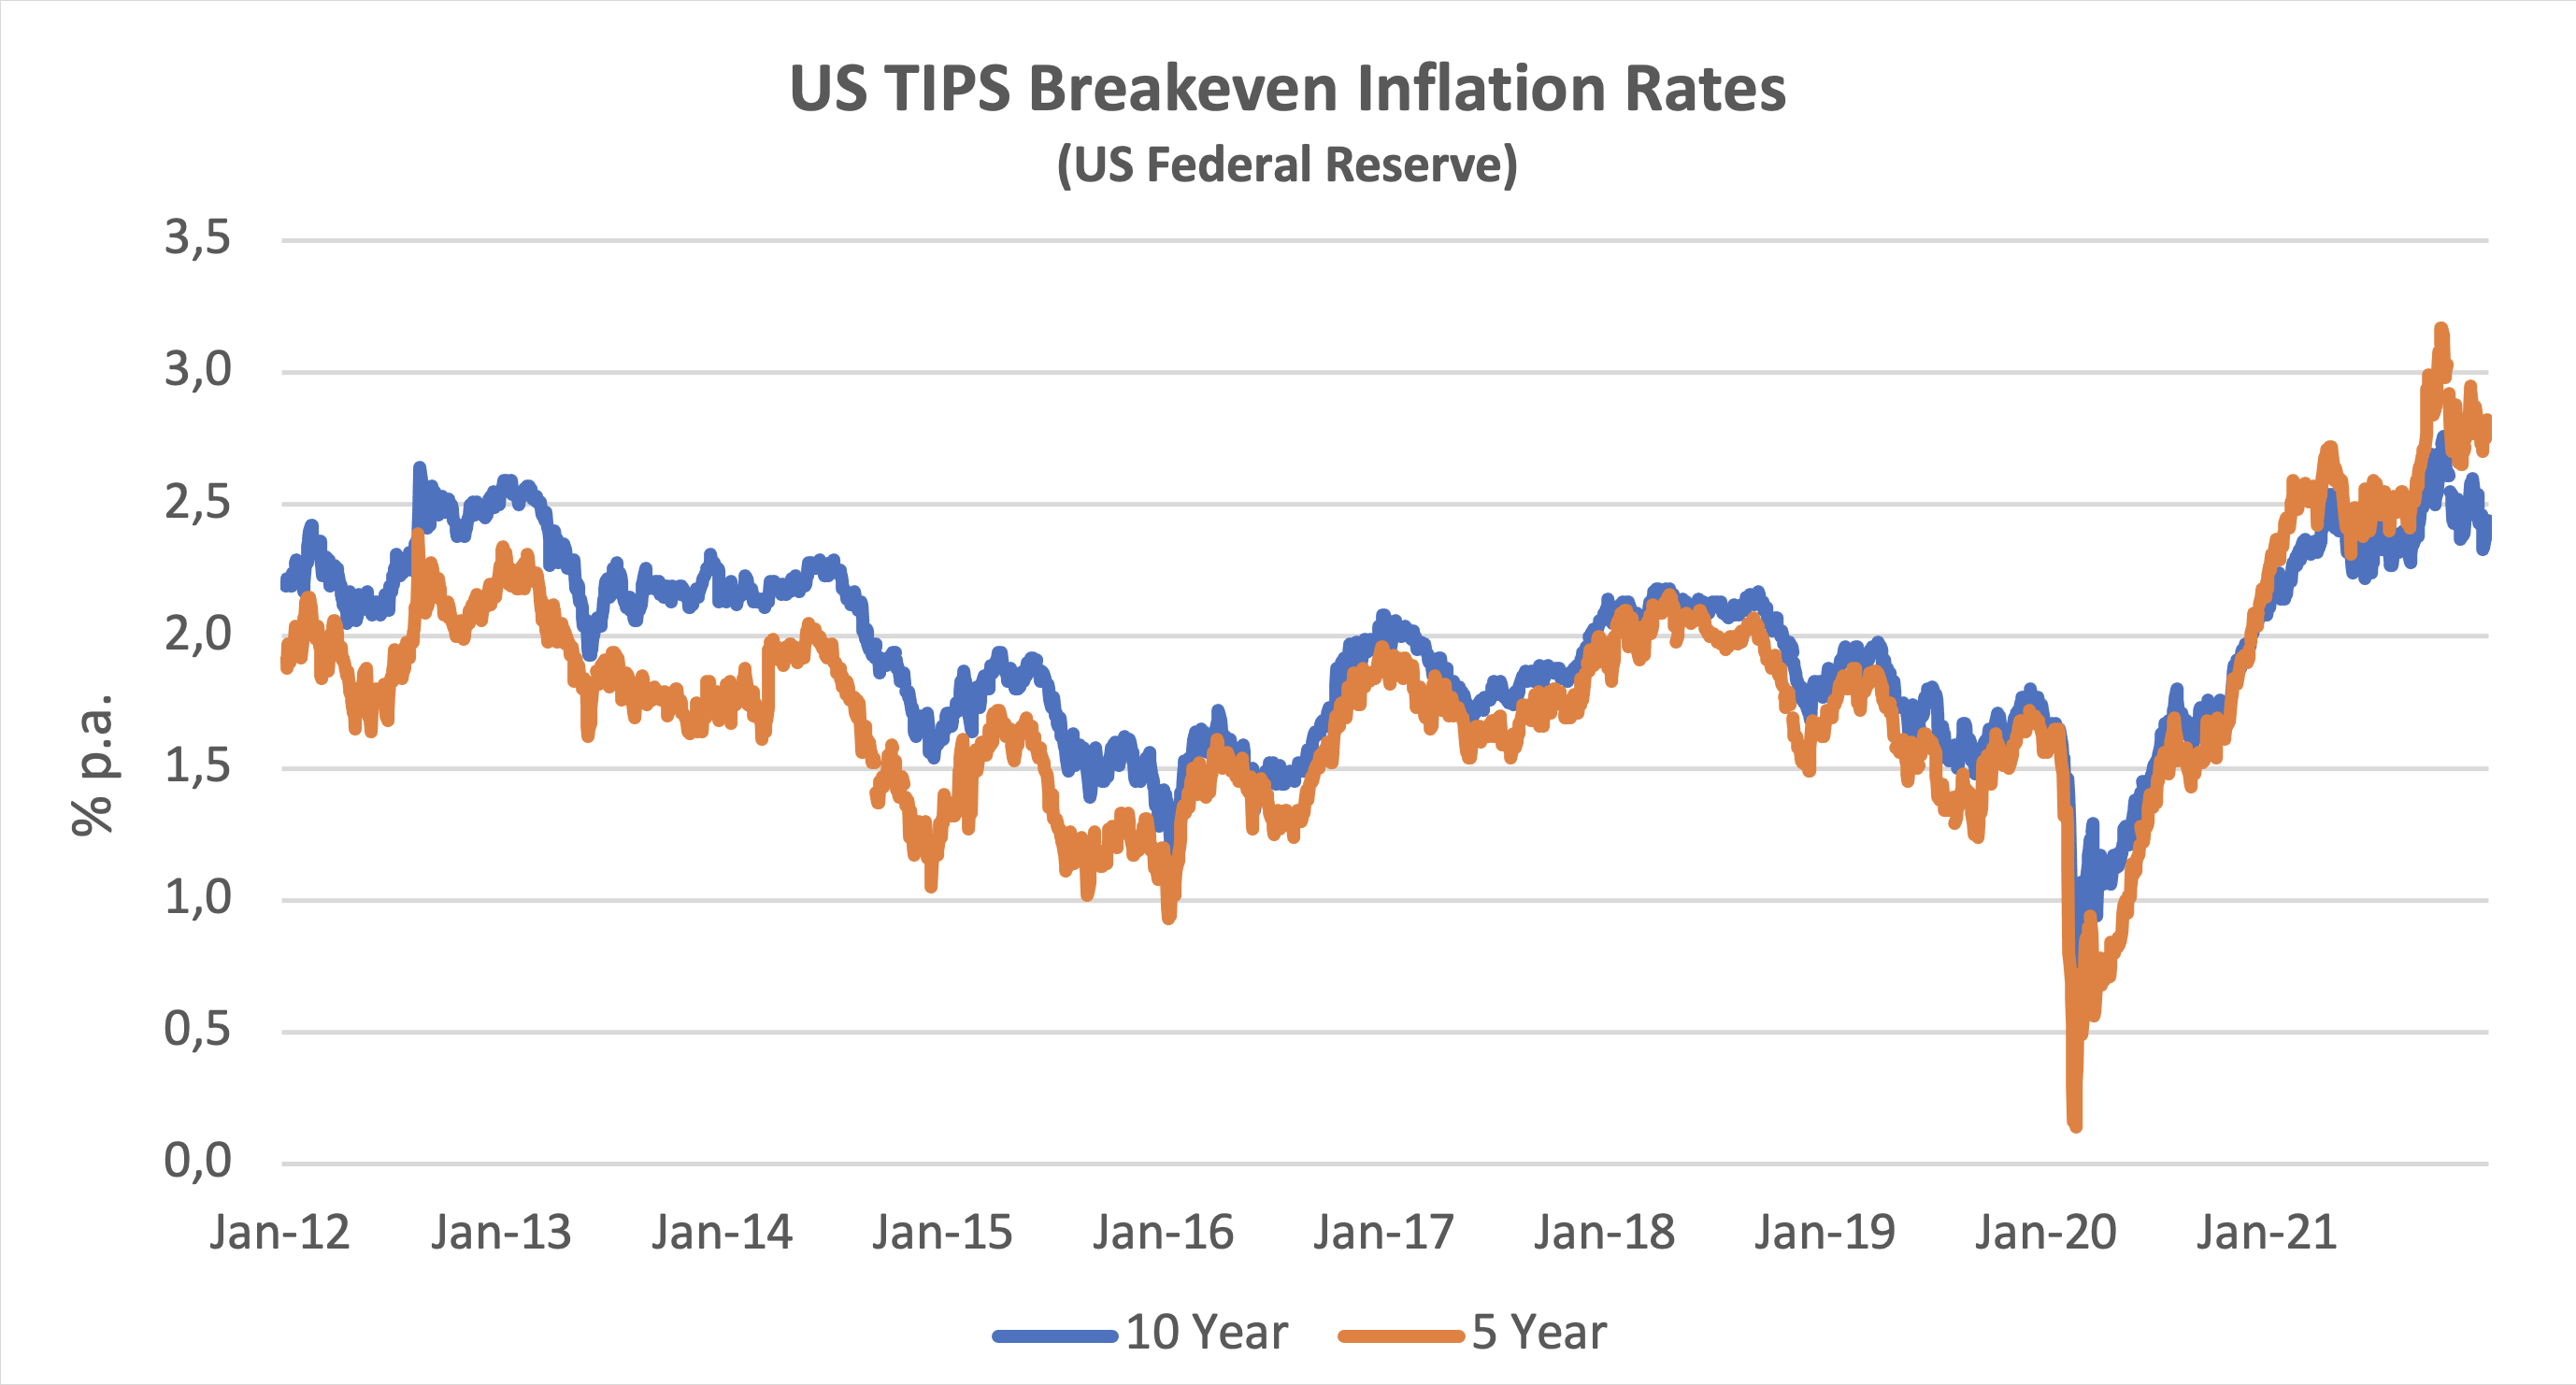
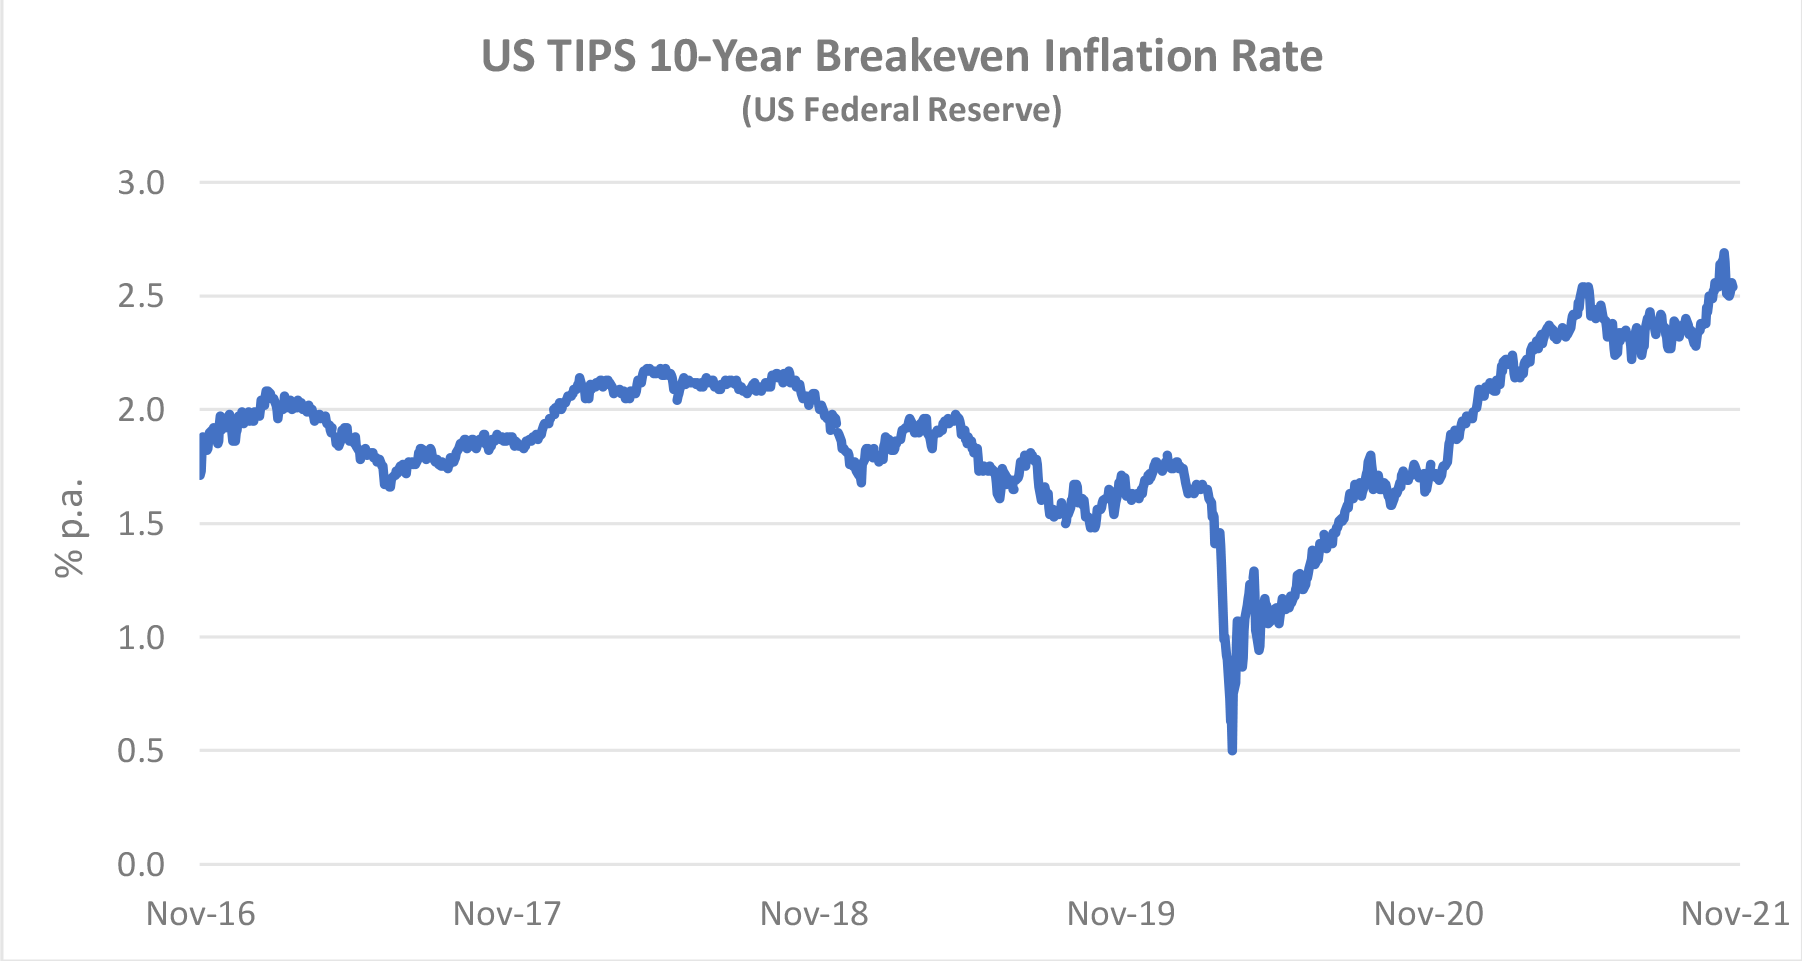
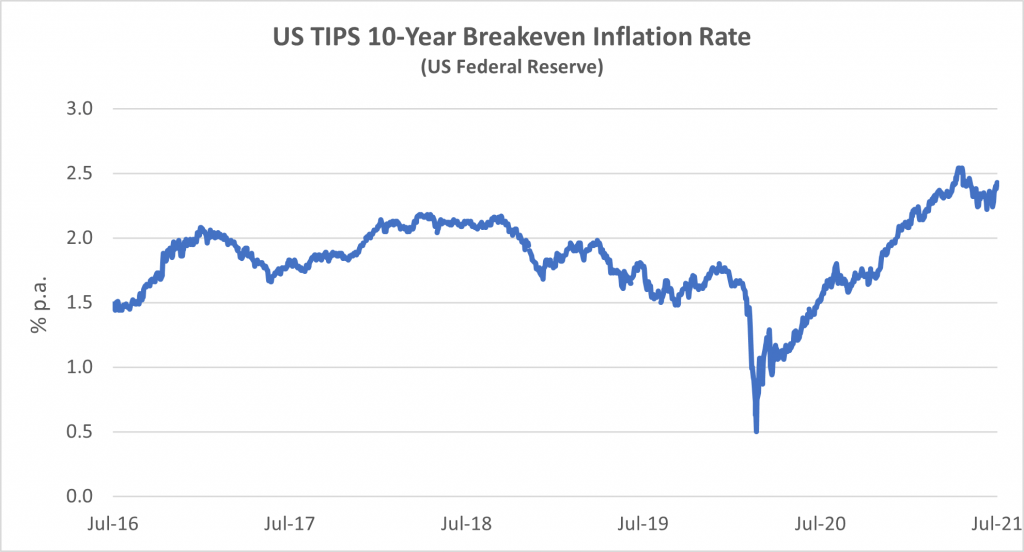
The chart below compares the breakeven rate for 10-year and 5-year TIPS to highlight the differences in expectations for the different time horizons. The shorter maturity has been more volatile, especially since the onset of the pandemic, but there is a strong overall correlation that suggests changed inflation expectations are not for a transitory “blip”.
Traffic and Aircraft Demand
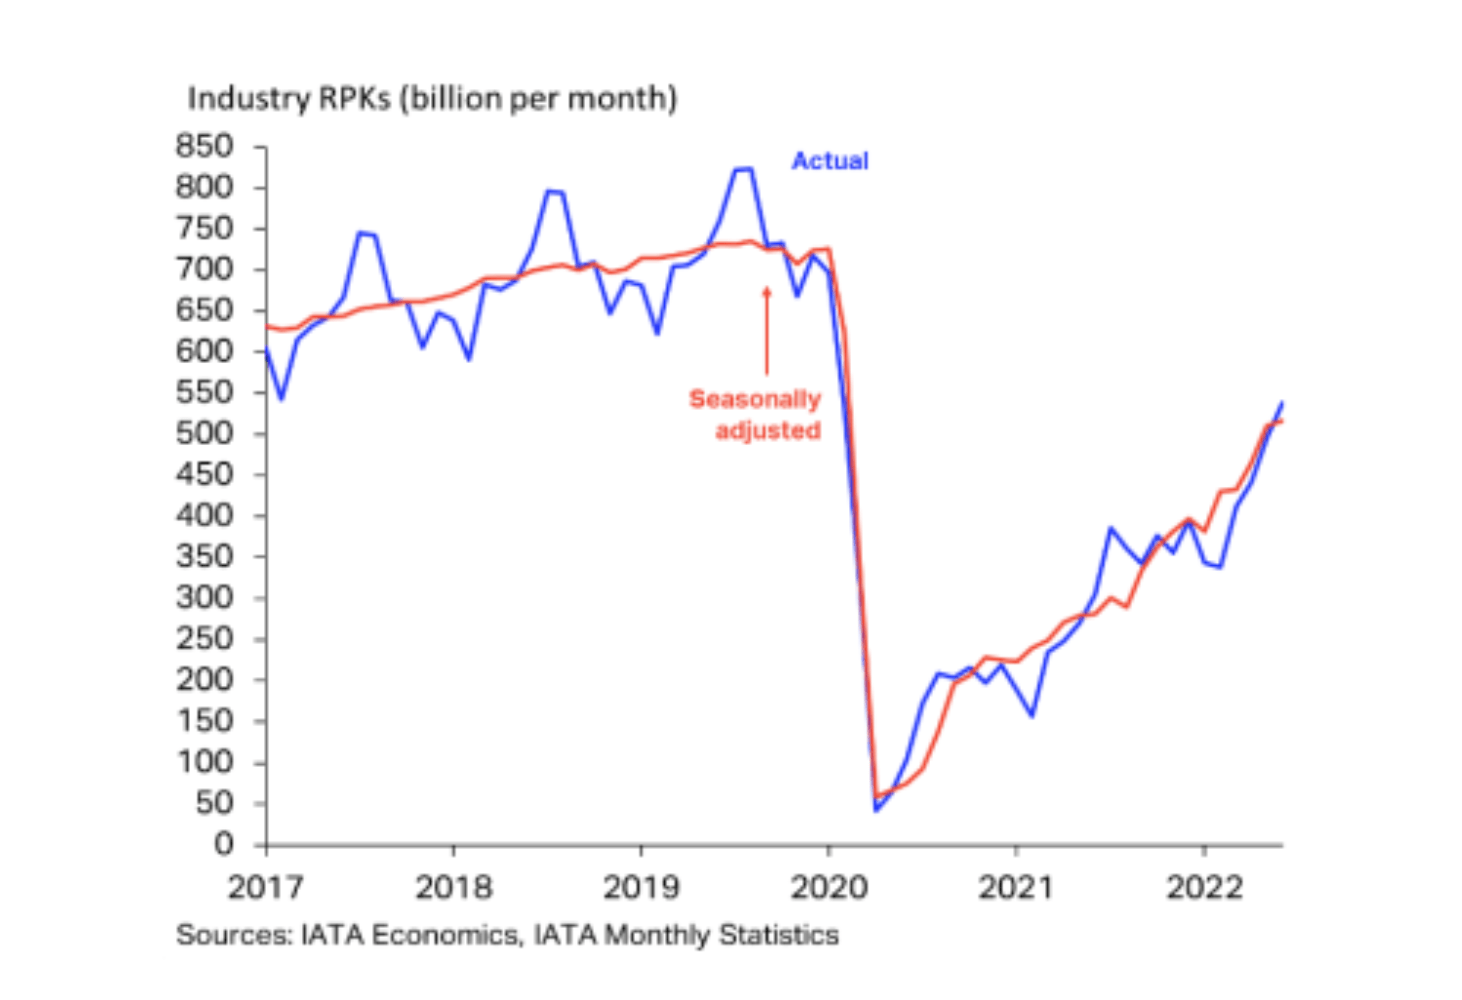
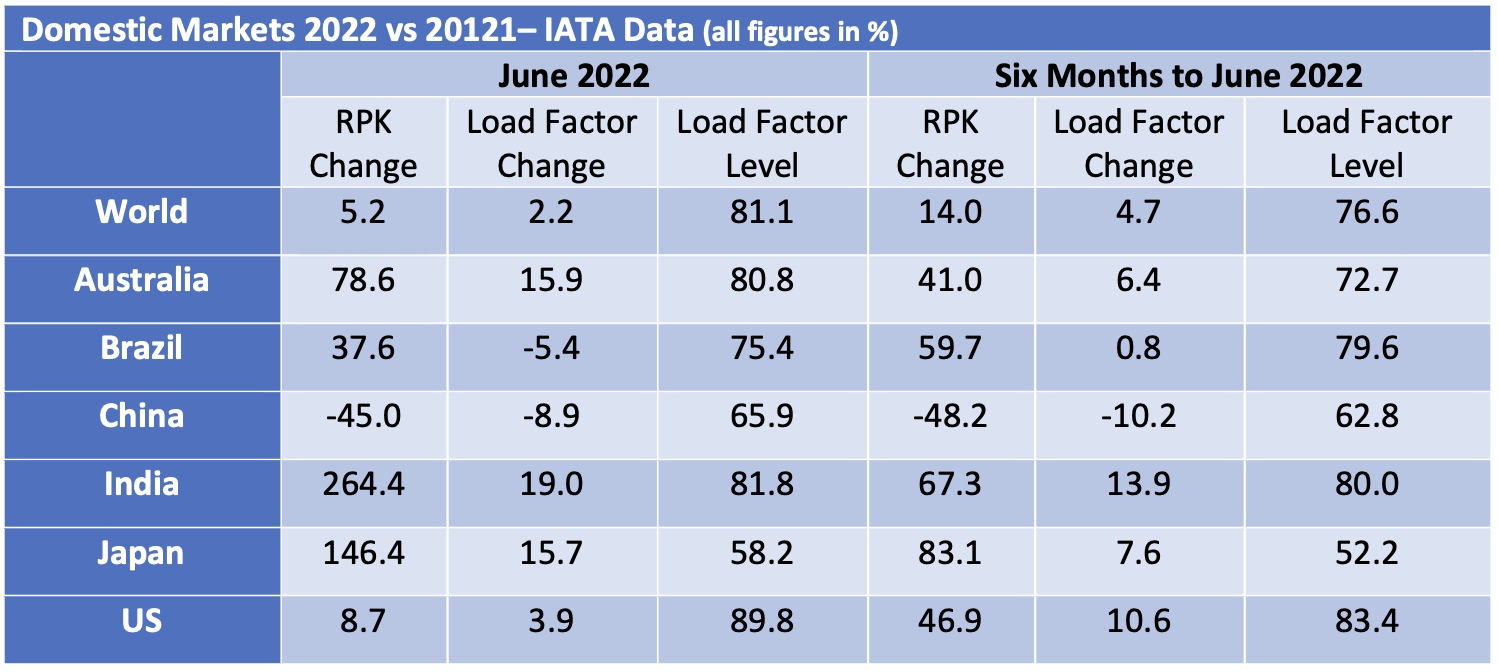
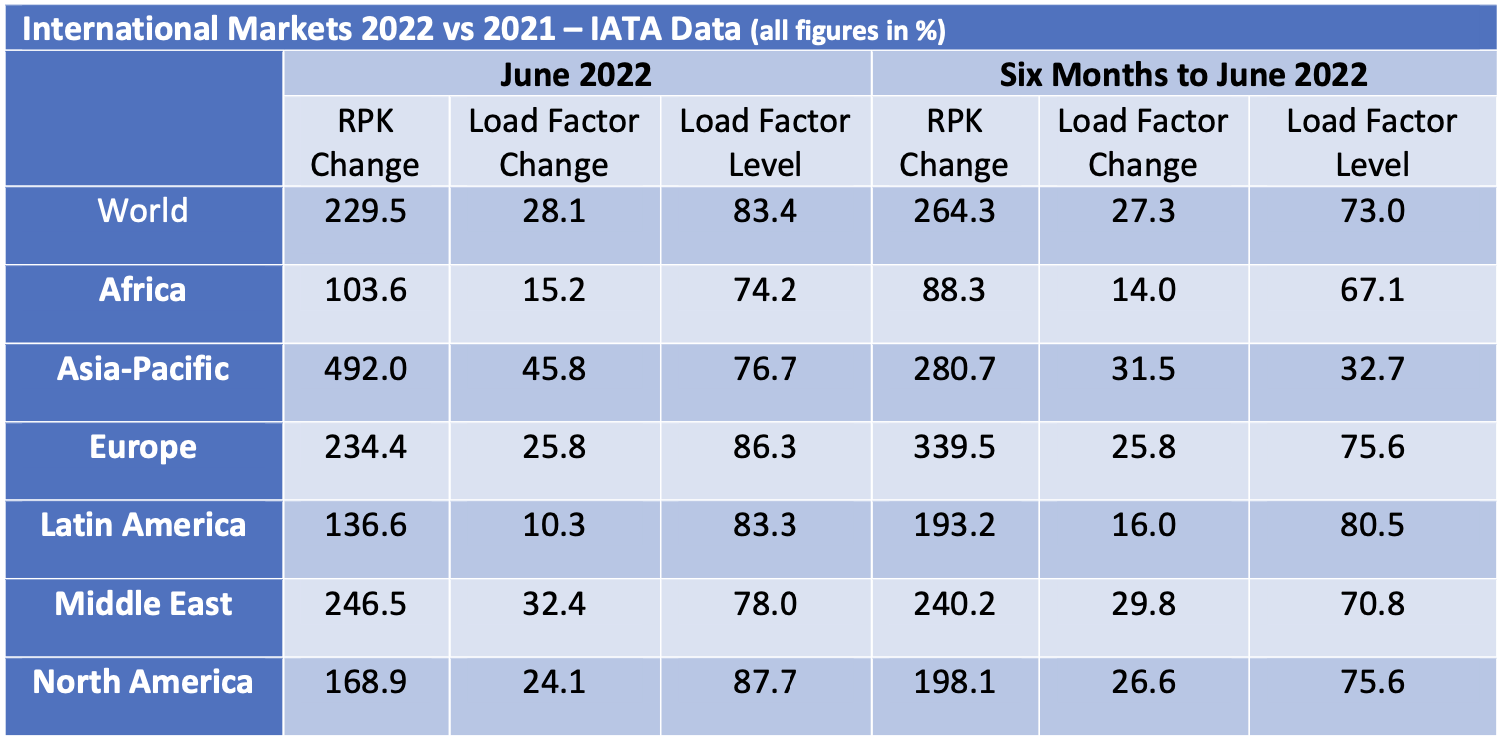
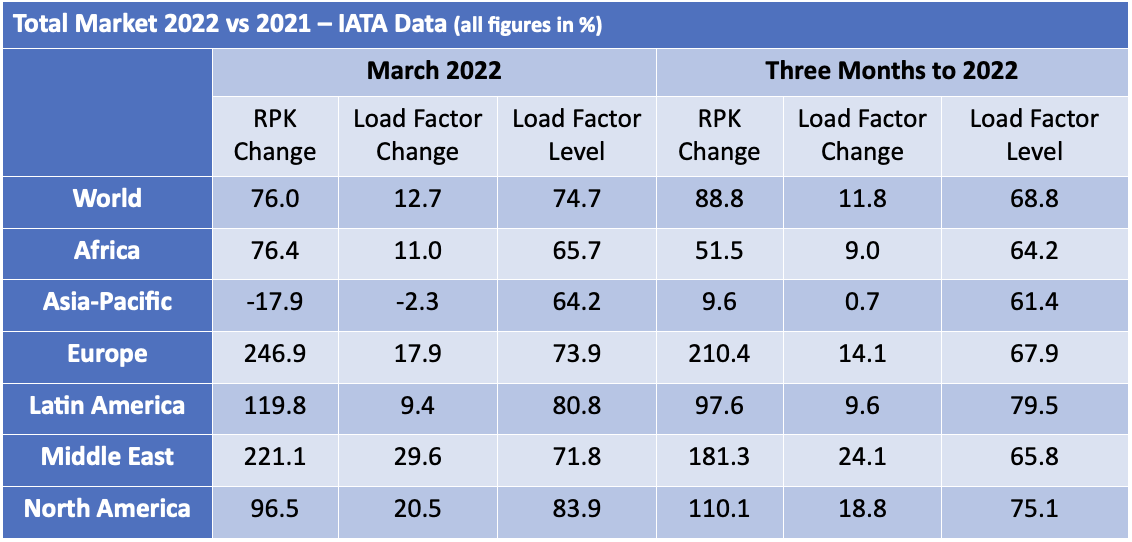
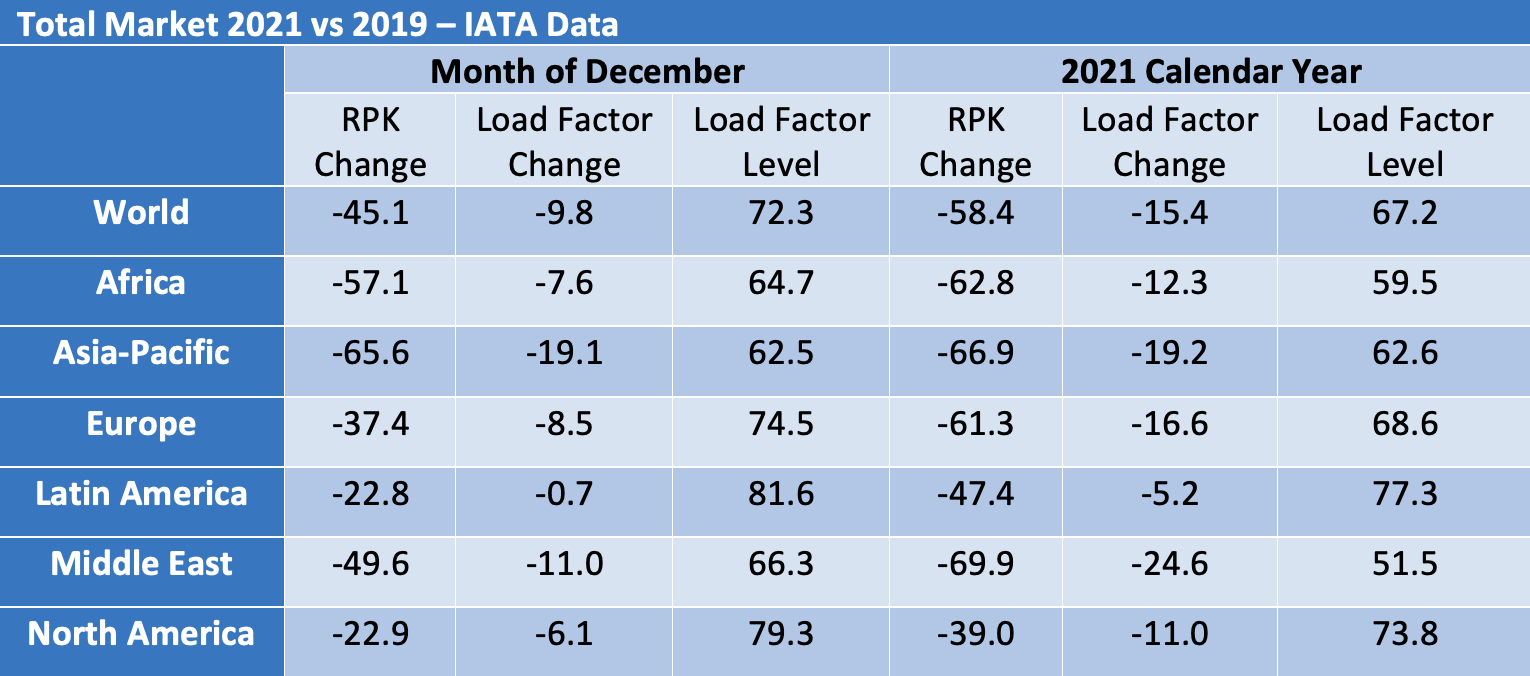
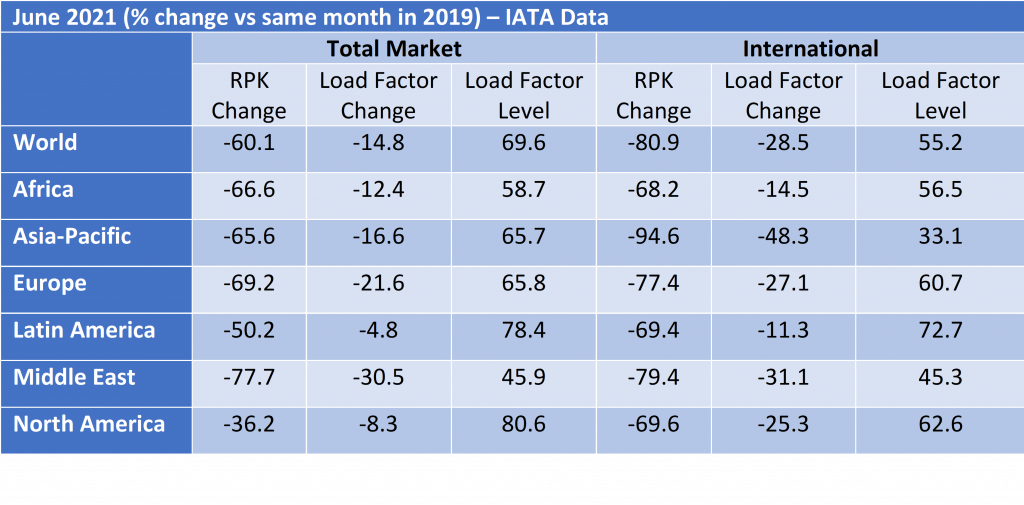
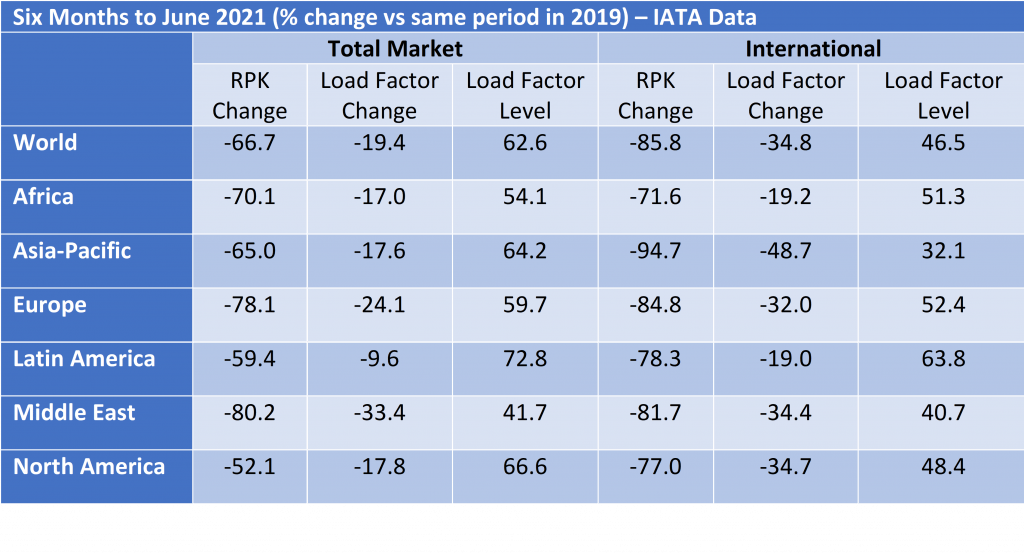
The strong recovery in air travel at the start of 2022 has continued through June although overall RPKs for the month of June remained 29.2% below the comparable figures for 2019. Europe and the Middle East are the strongest performing regions because their recovery has mainly occurred this year, whereas the Americas already achieved a significant recovery in 2021. Traffic growth in Asia Pacific remains weak mainly due to the disruptive effect of lockdowns on domestic Chinese RPKs.
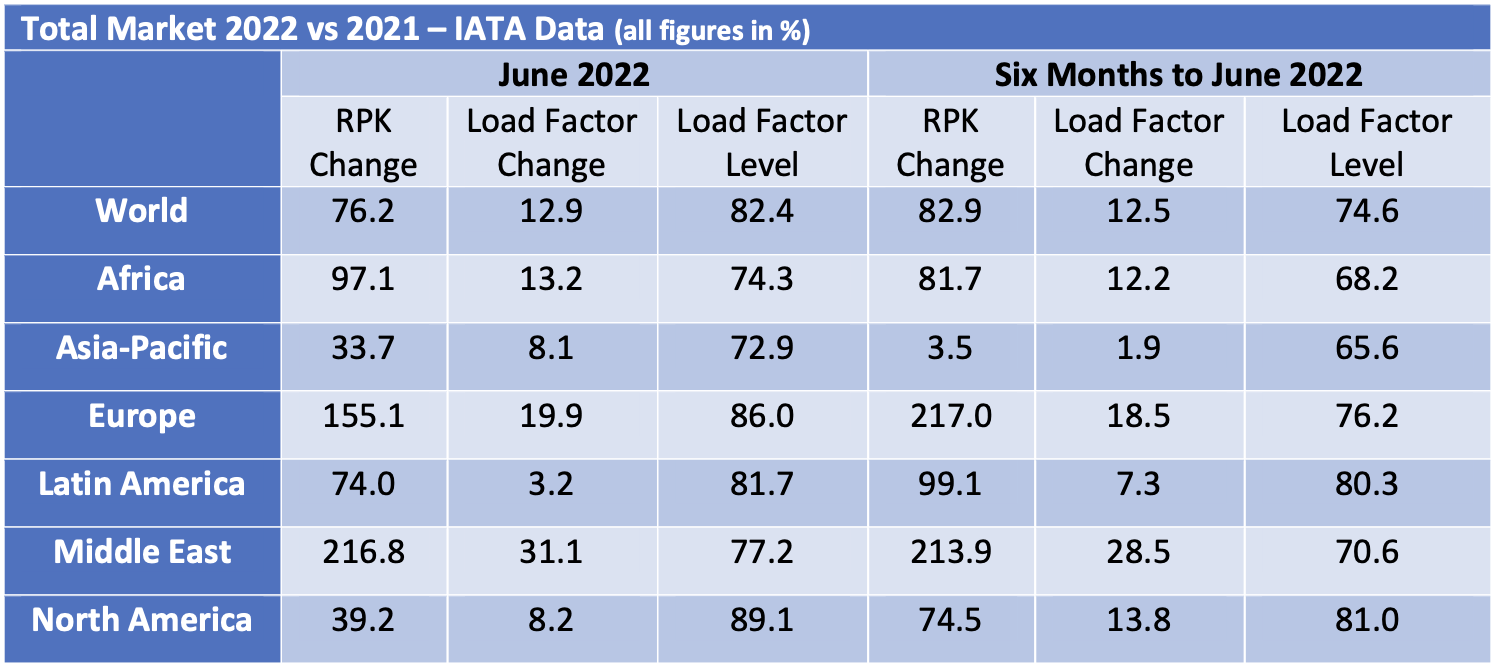
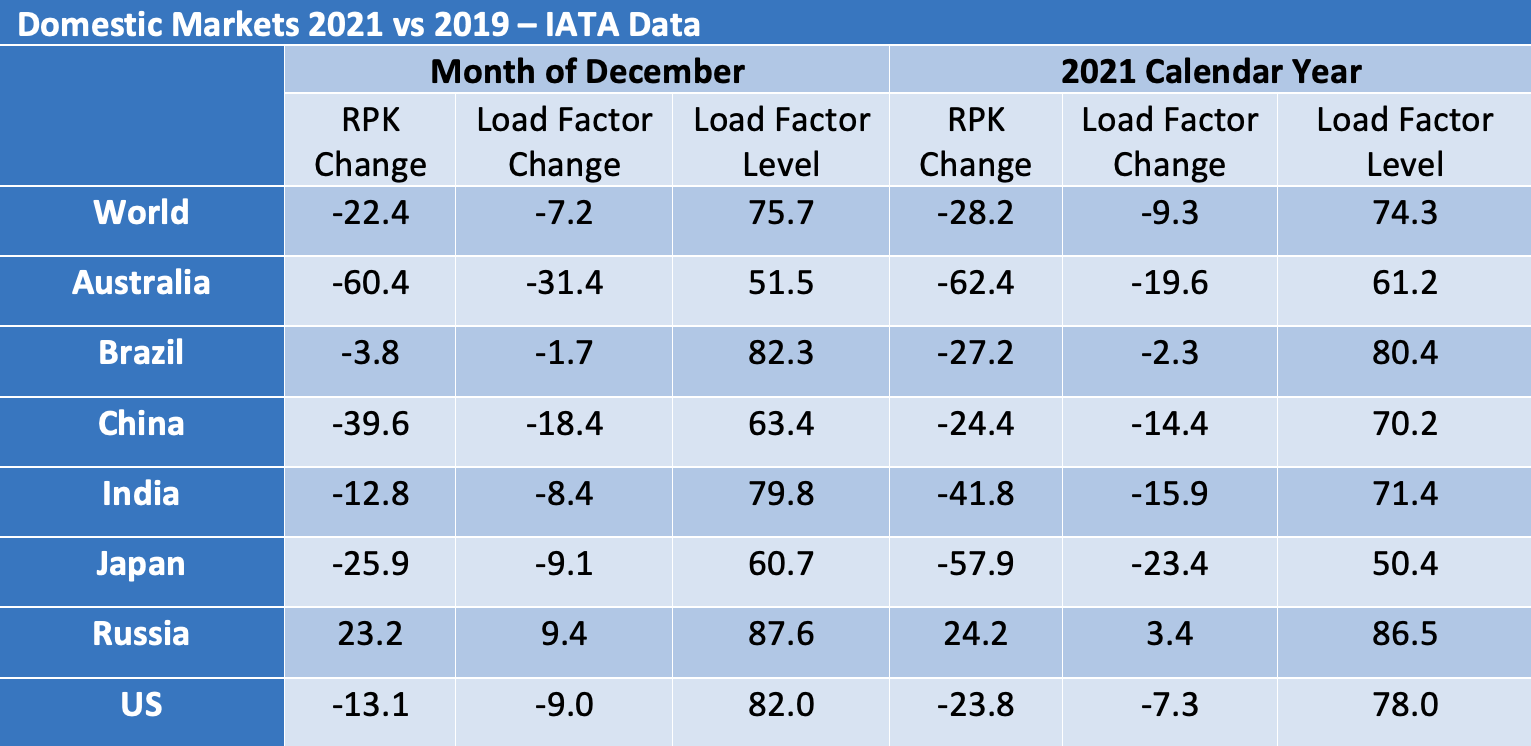
There was a much bigger increase in international traffic vs domestic traffic, mainly because the former was coming off a much lower base. The strongest international recovery was in Europe and barring further unexpected geopolitical events there is a very strong summer in prospect. It should be borne in mind that European international air travel includes much more short-haul traffic than other regions because geography limits the demand for domestic air travel outside of Russia.
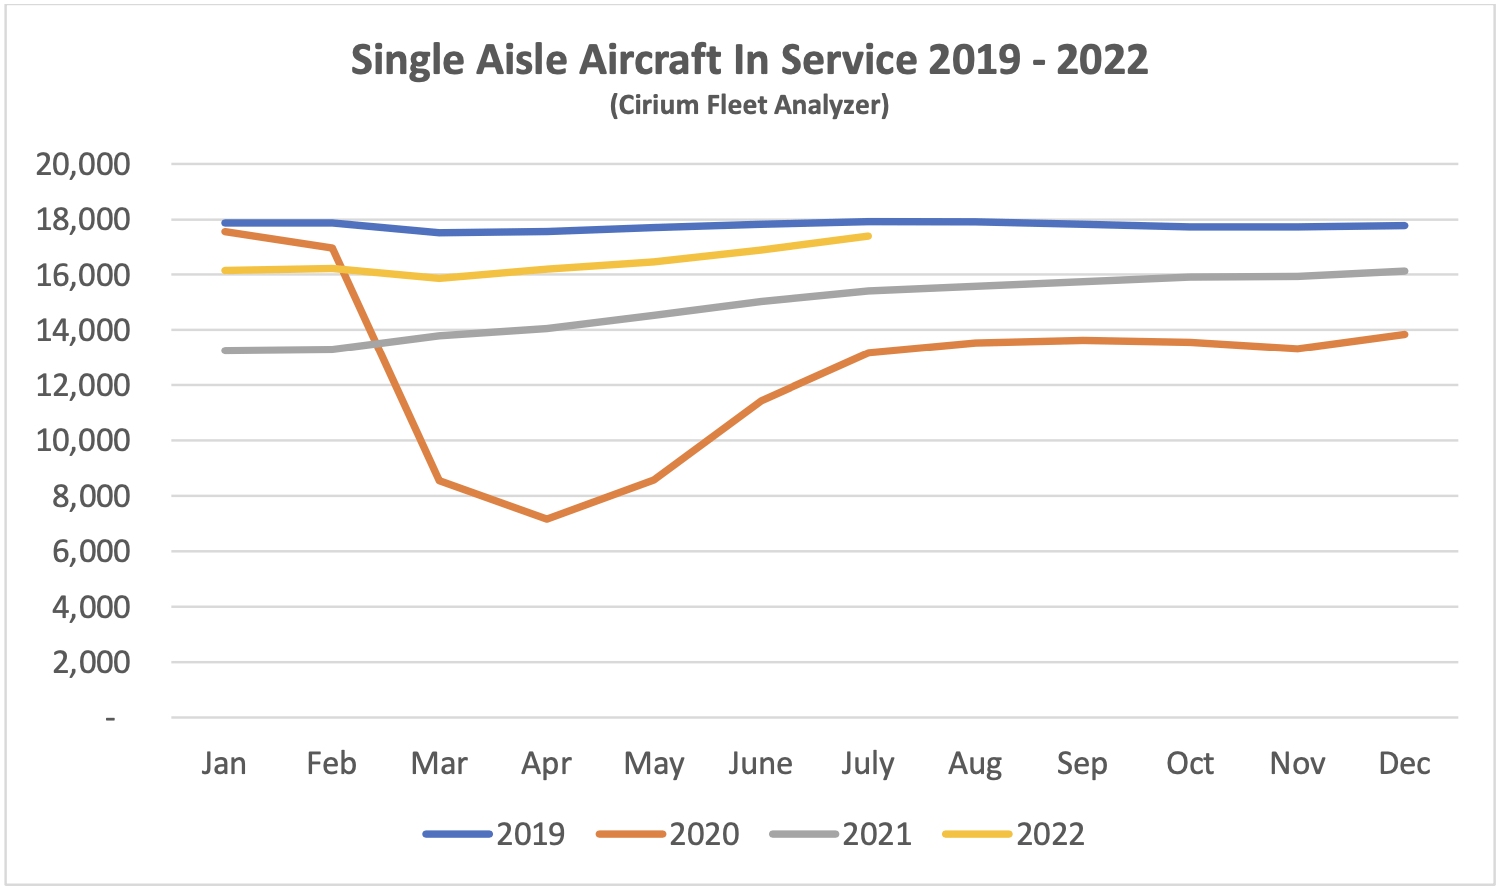
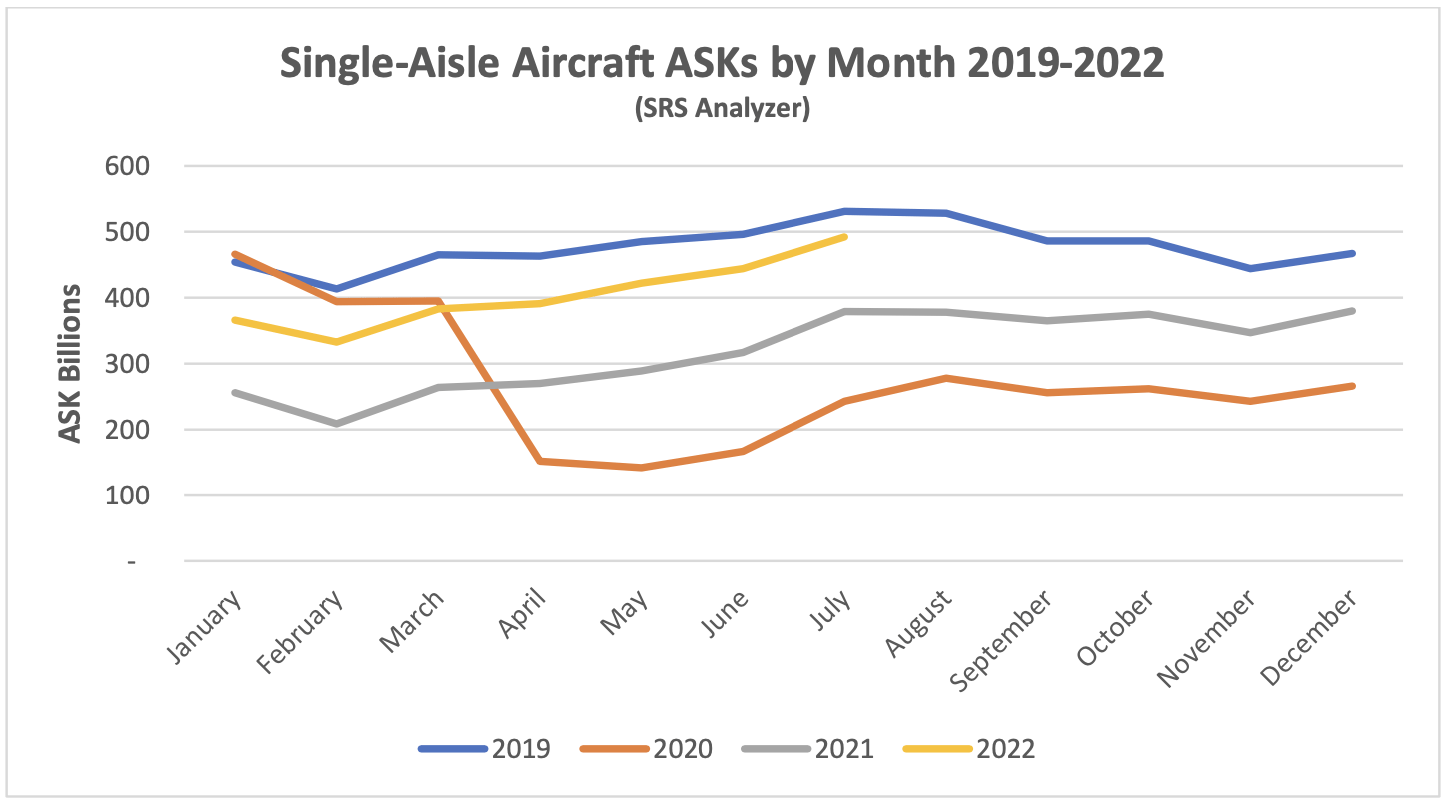
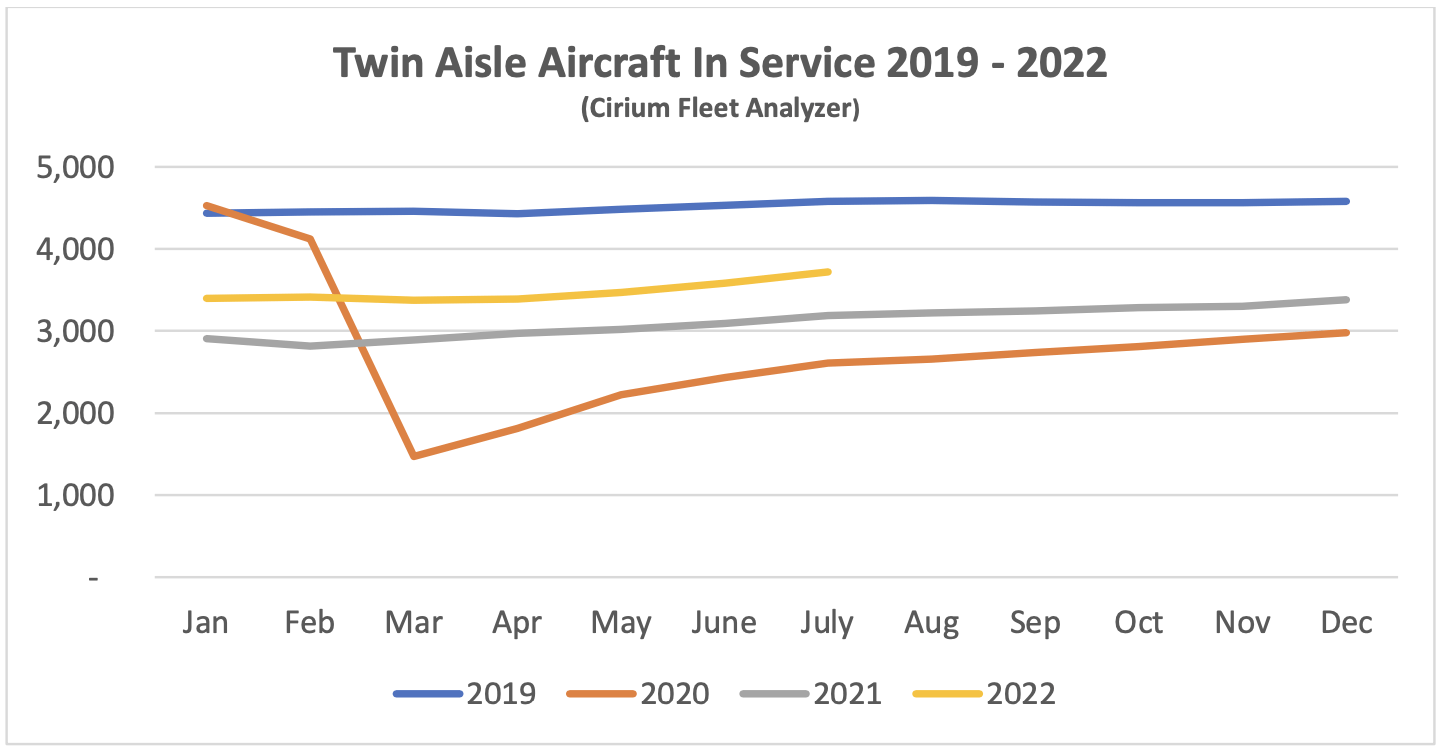
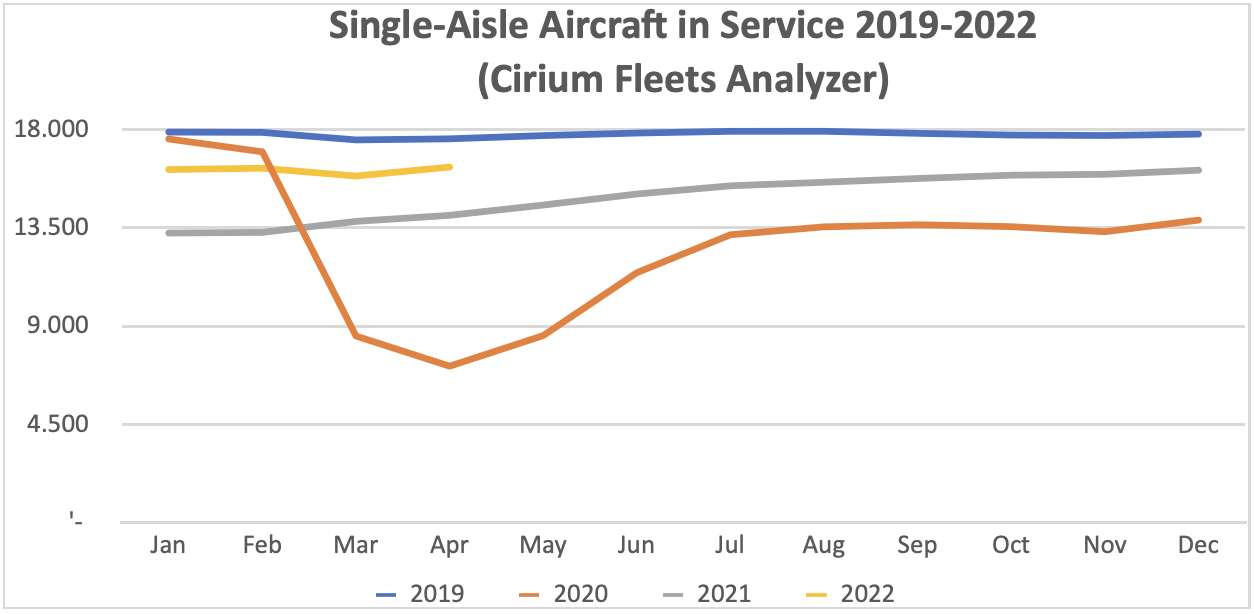
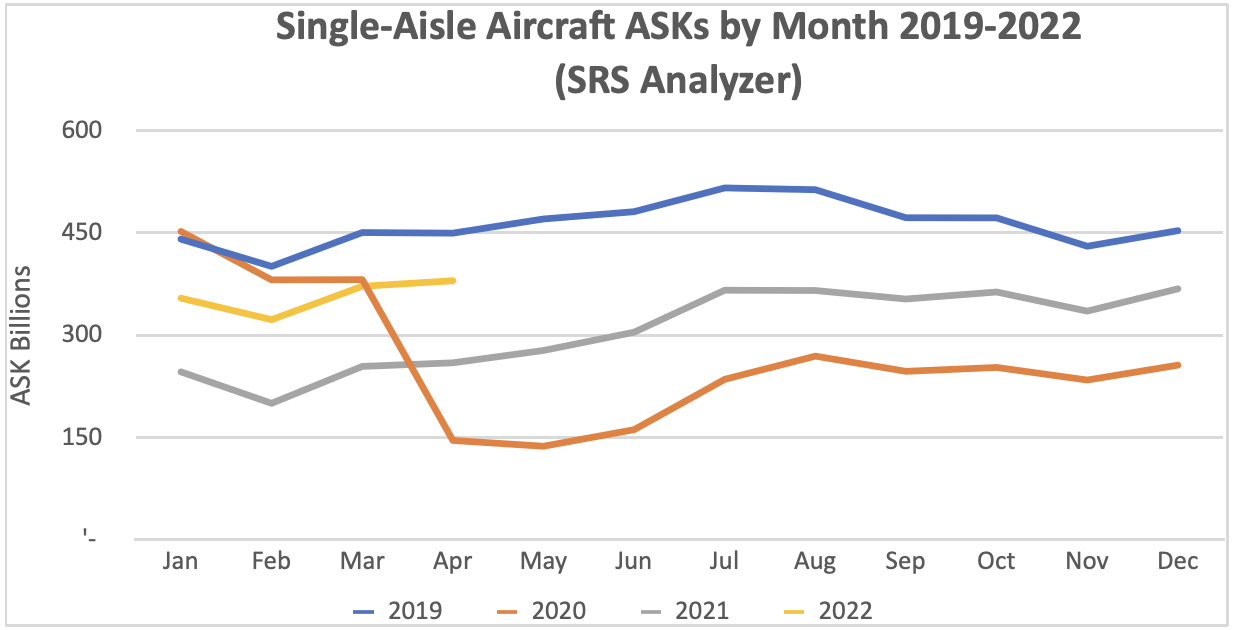
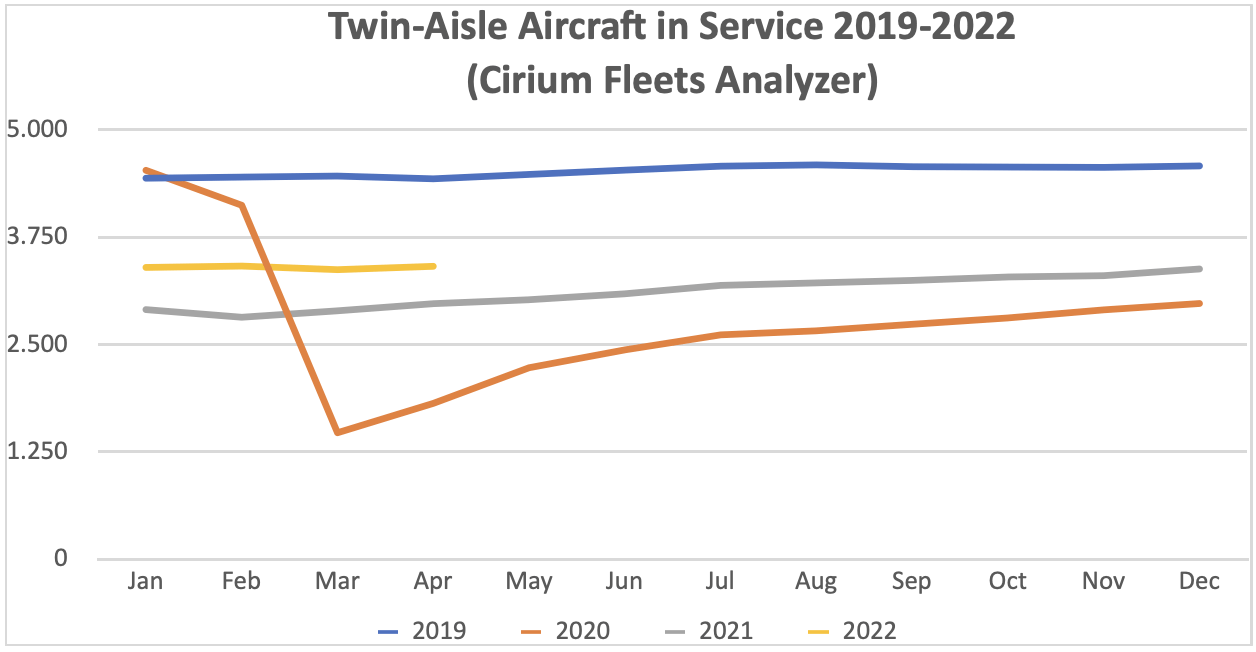
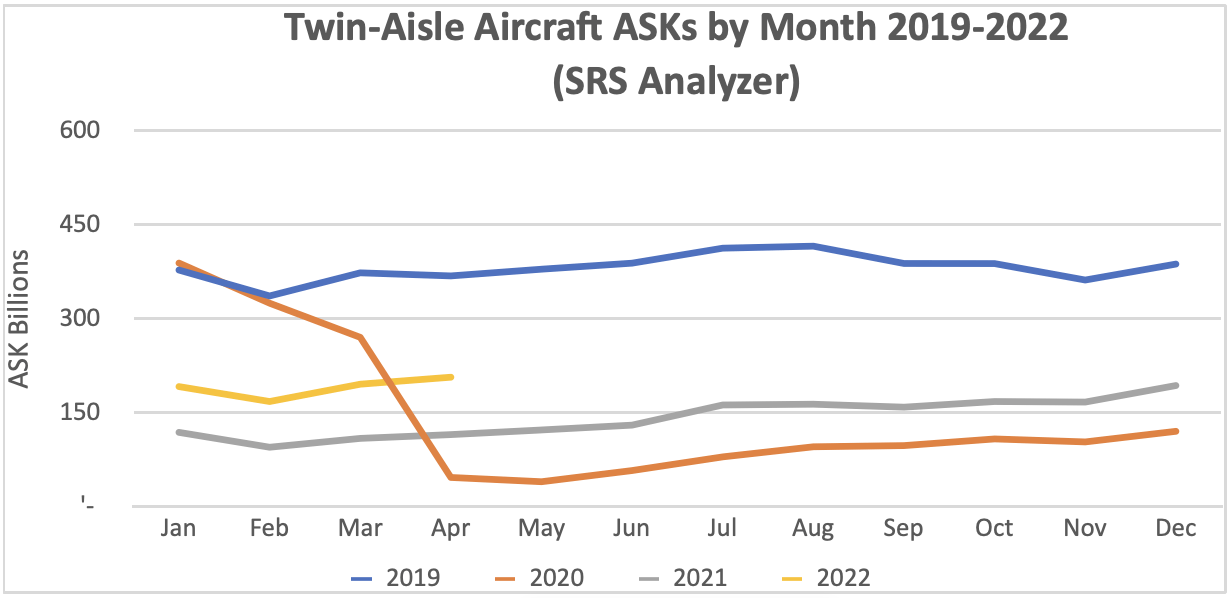
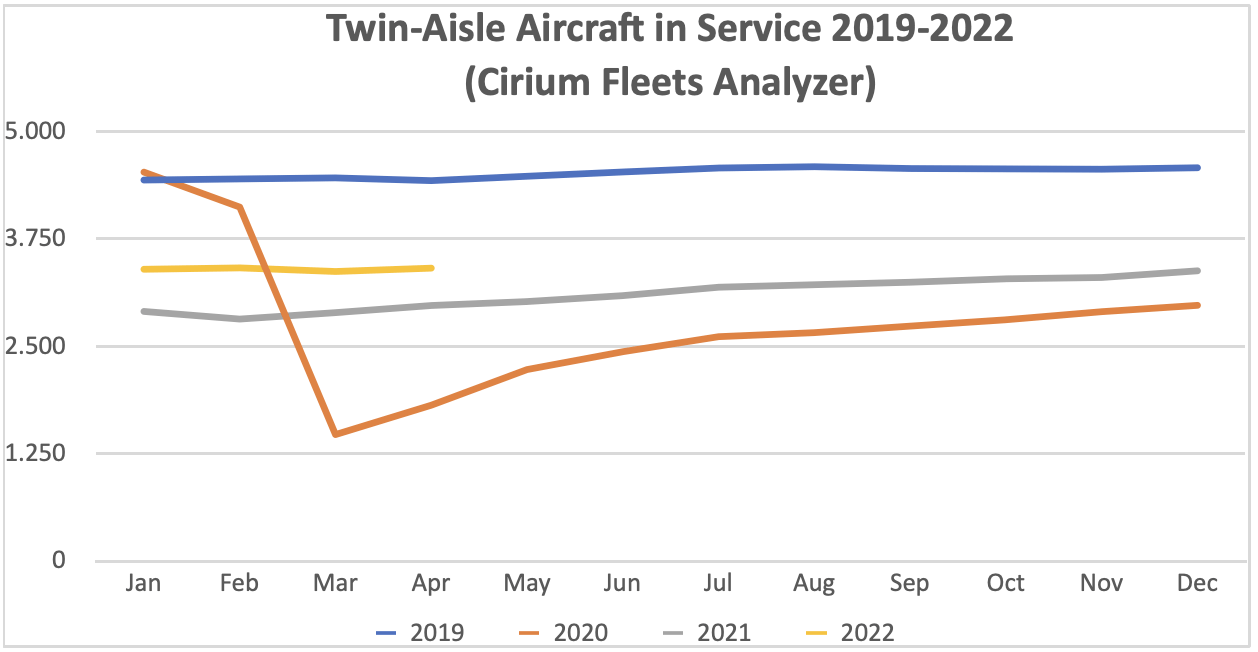
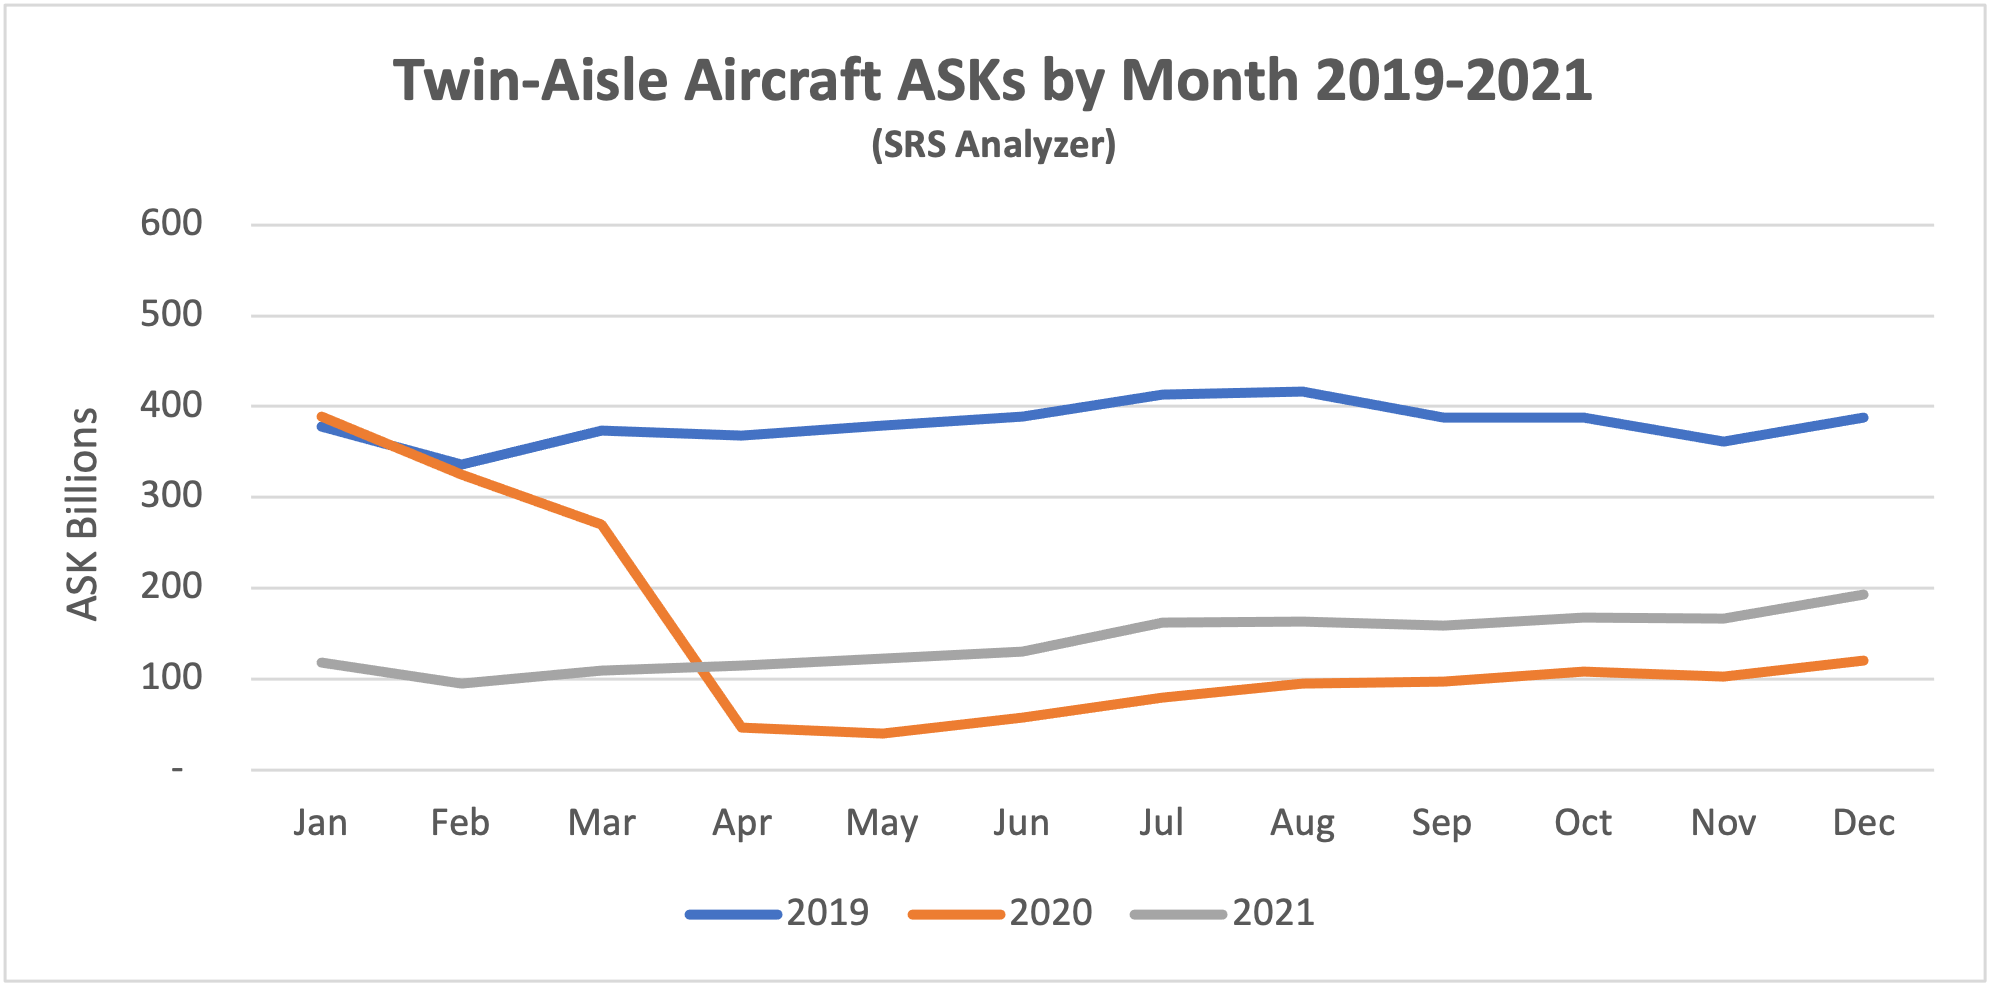
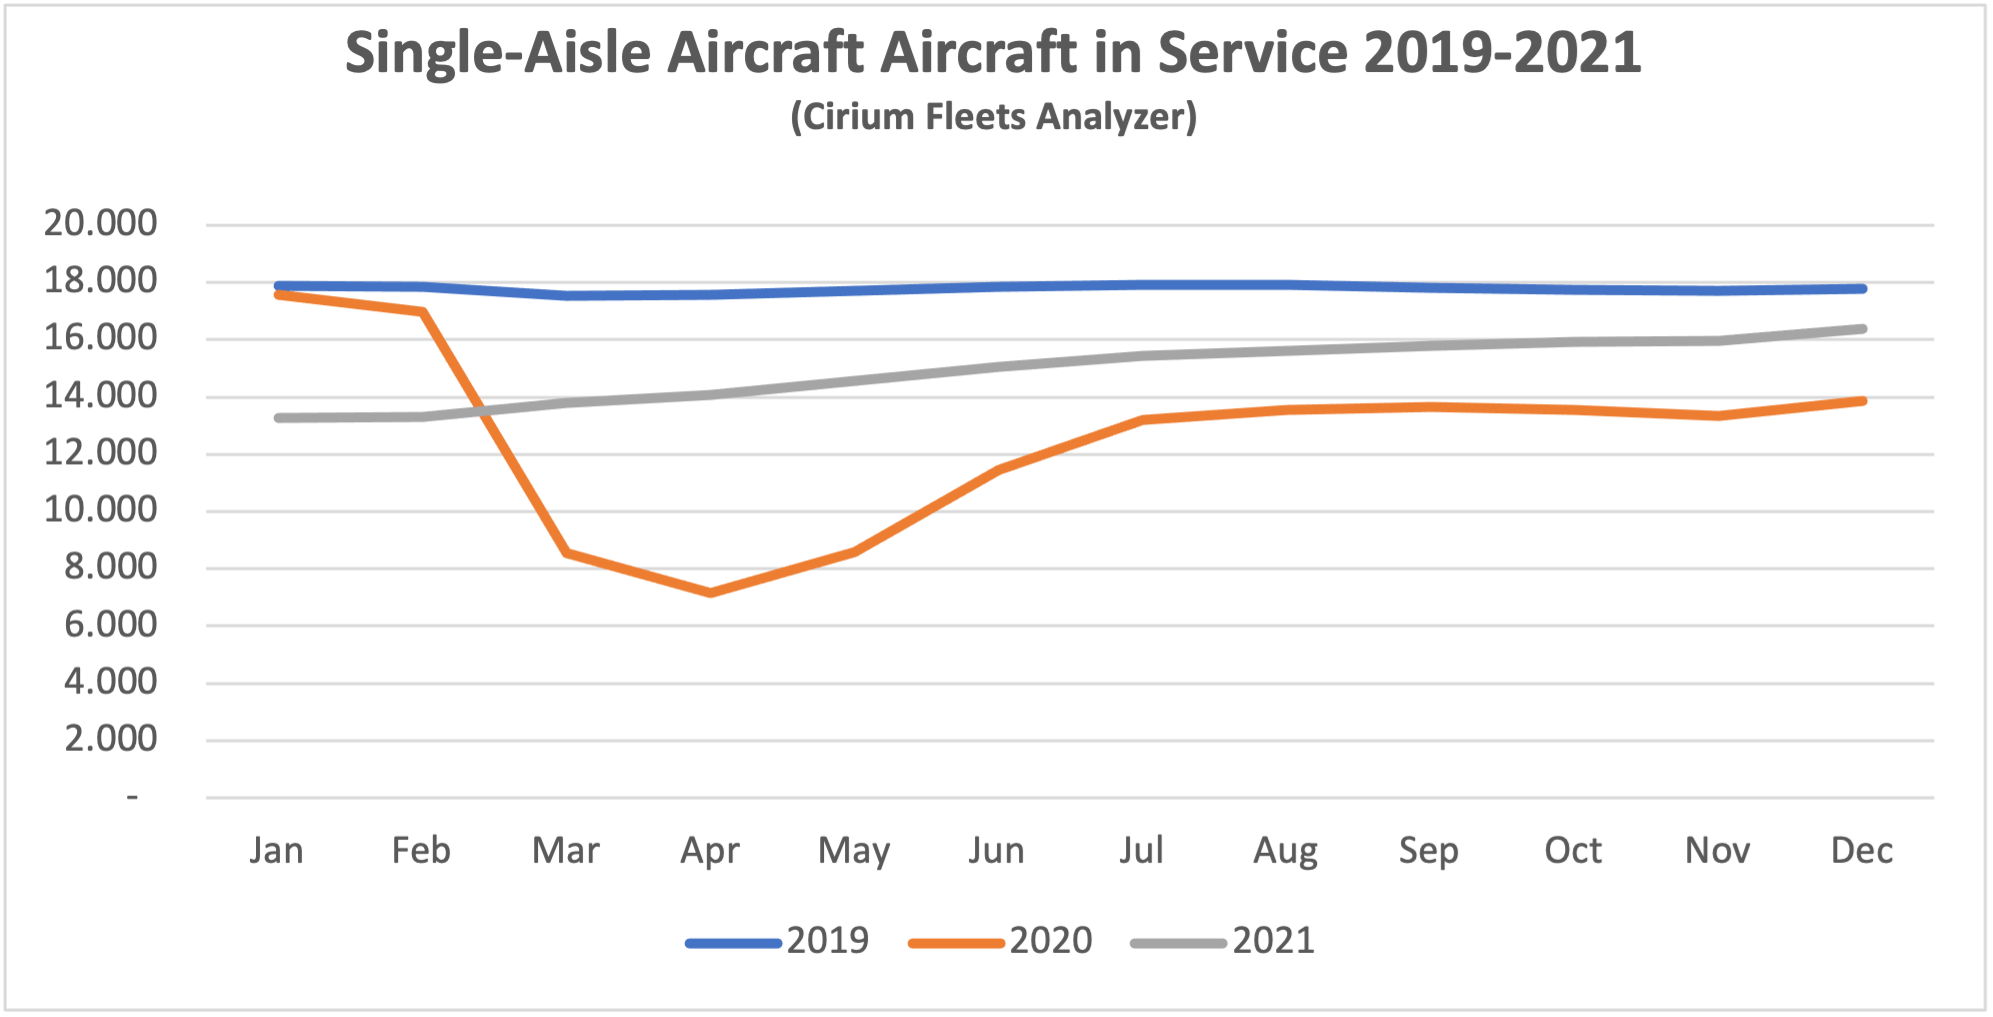
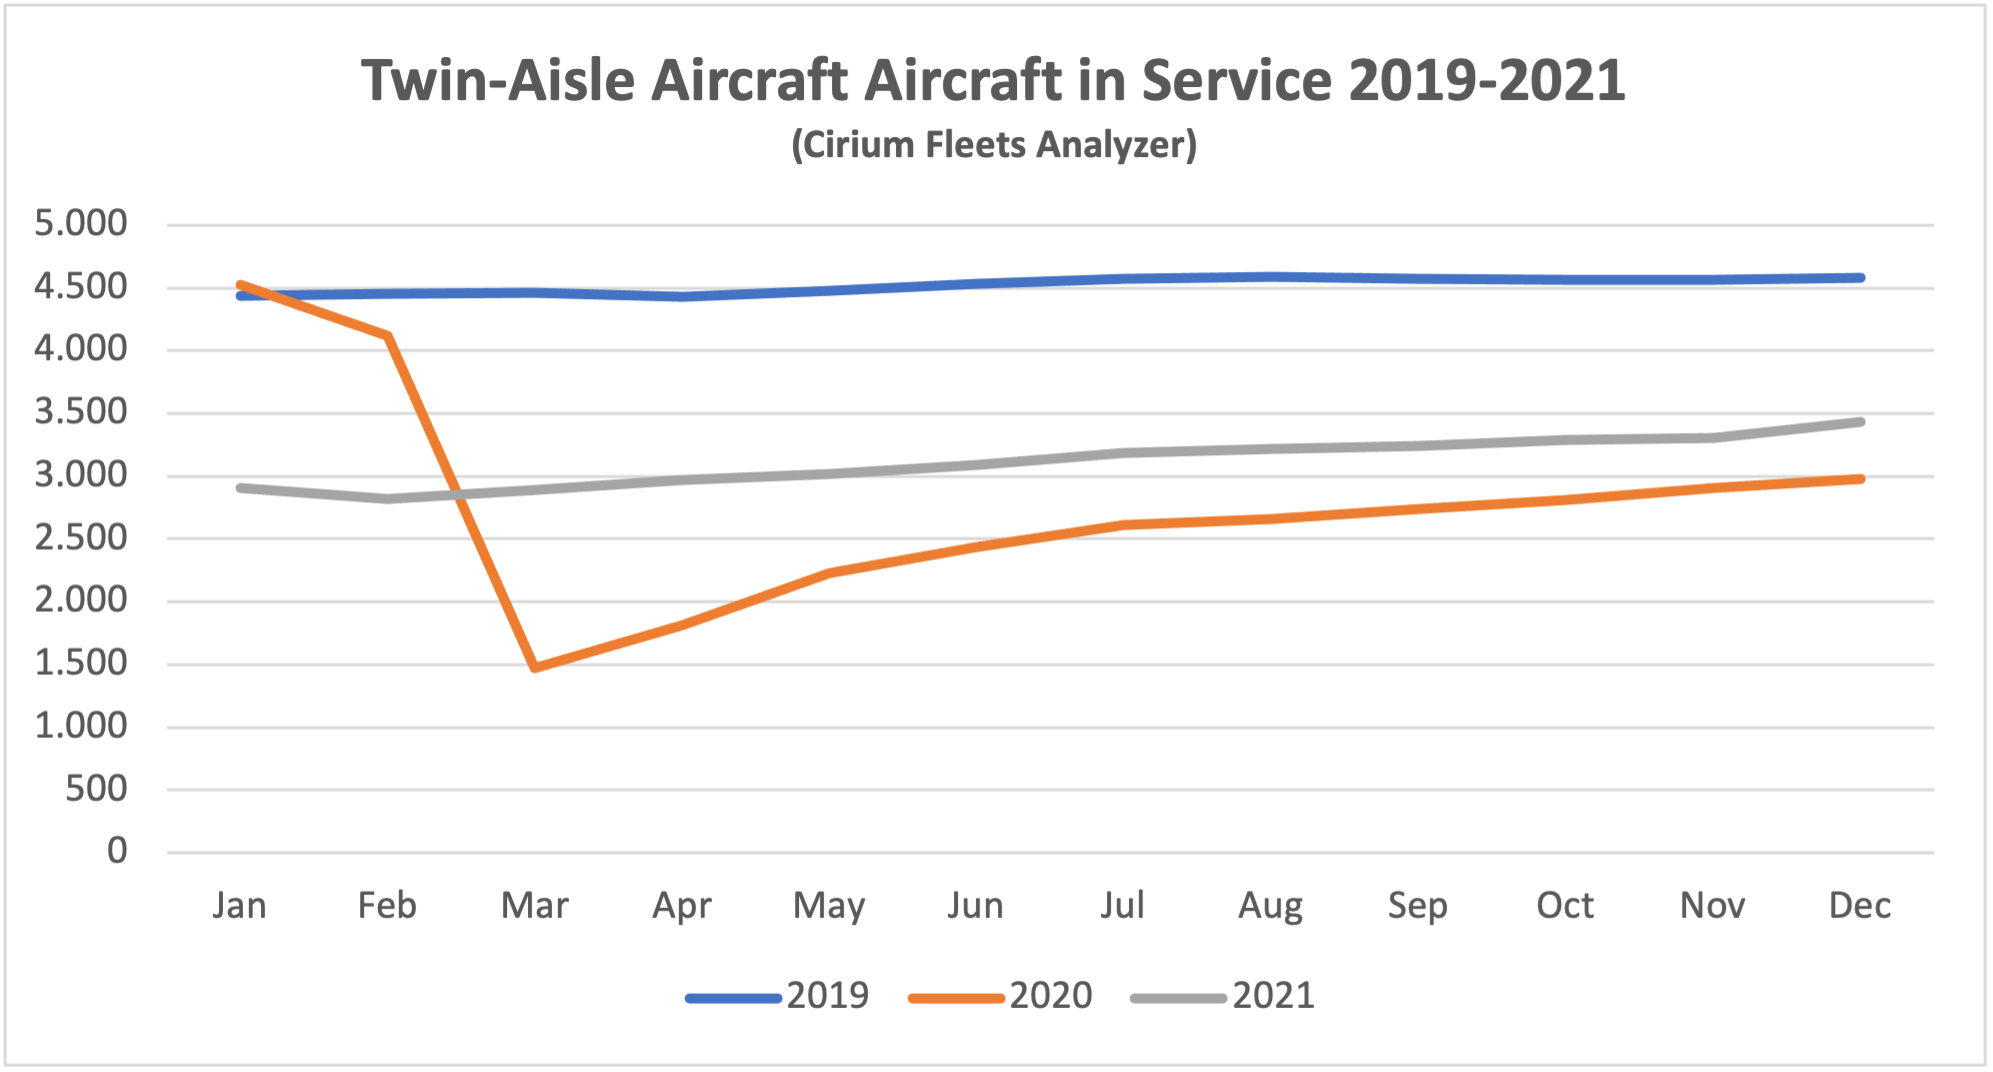
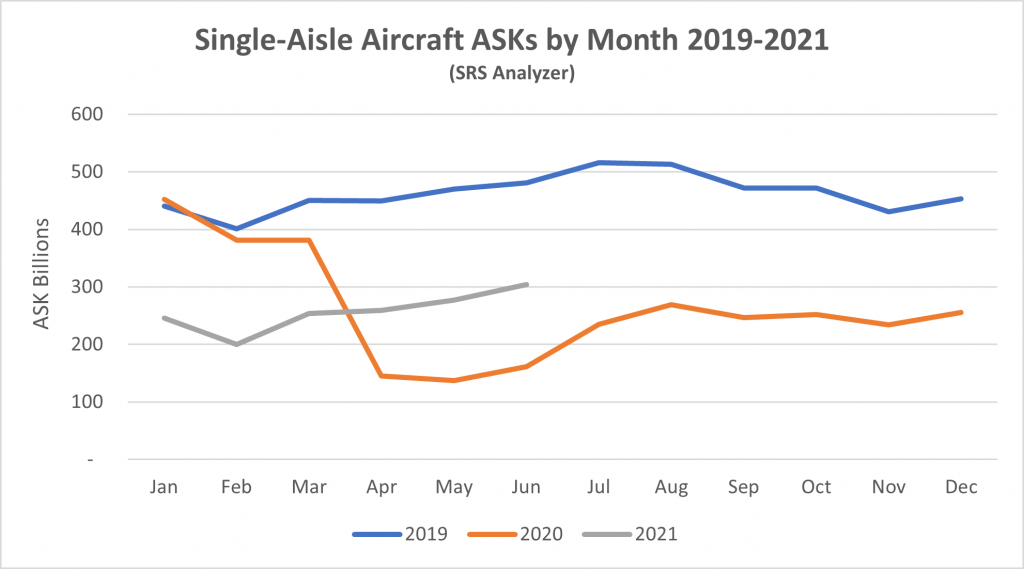
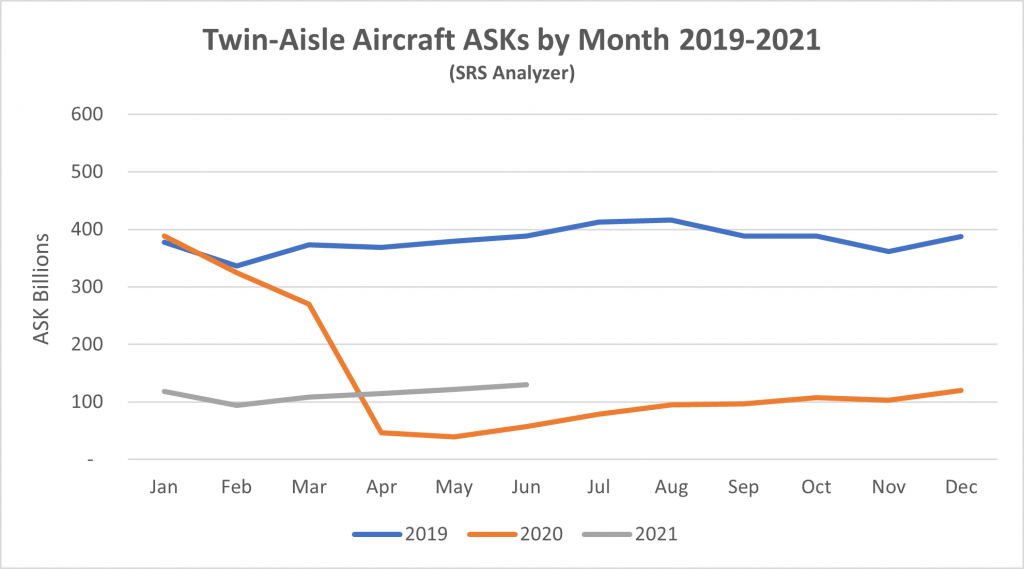
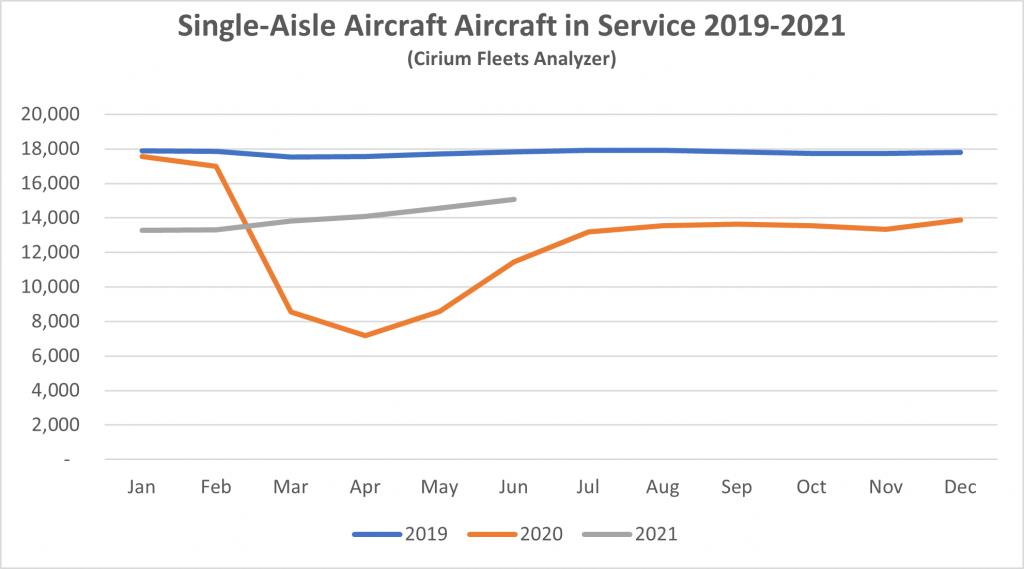
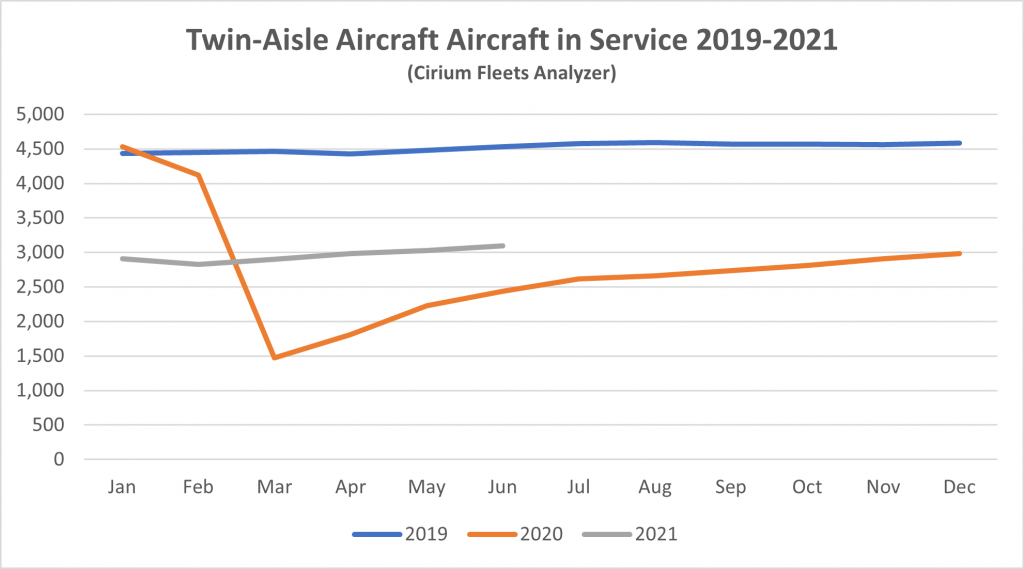
Although some short-haul aircraft serve international routes nearly all long-haul aircraft do so, and this is reflected in the relative demand for single-aisle (narrowbody) and twin-aisle (widebody) aircraft. Aircraft demand can be measured in terms aircraft in service and ASKs[3], the standard measure of aircraft capacity deployed by airlines which indicates how intensively aircraft are being flown. Single aisle aircraft in service levels are now very close to where they were in 2019 with a slightly weaker recovery in ASKs due to lower utilization. The comparable figures for twin aisle aircraft remain much weaker.
New Aircraft Supply

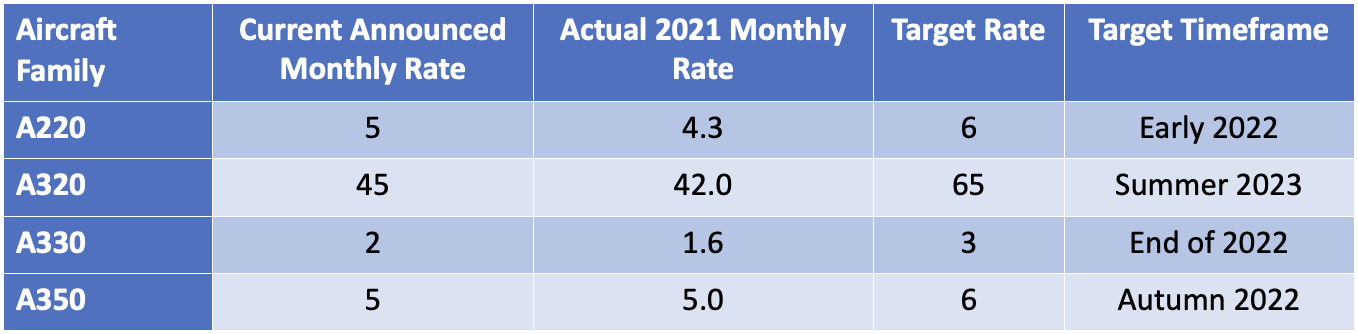
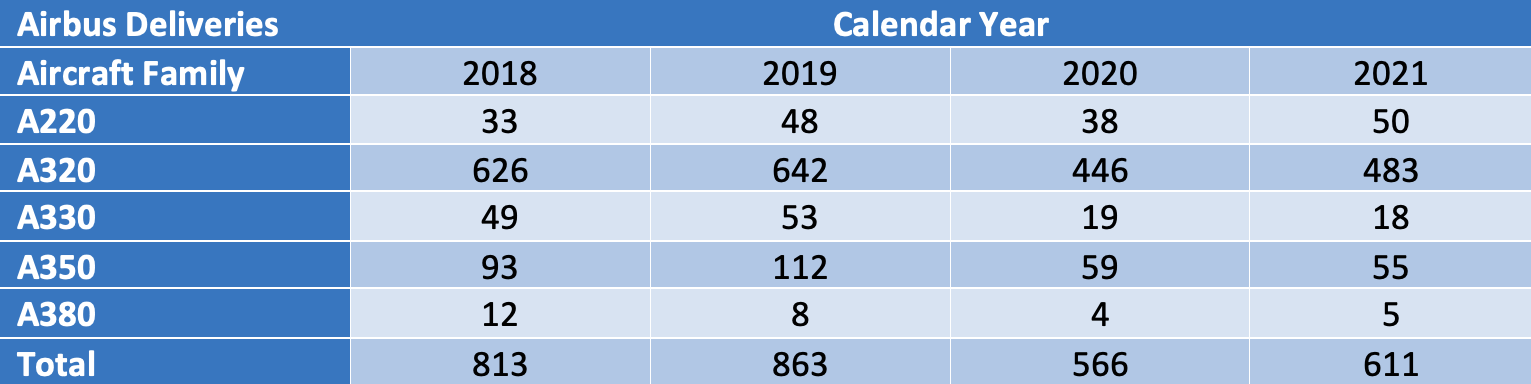
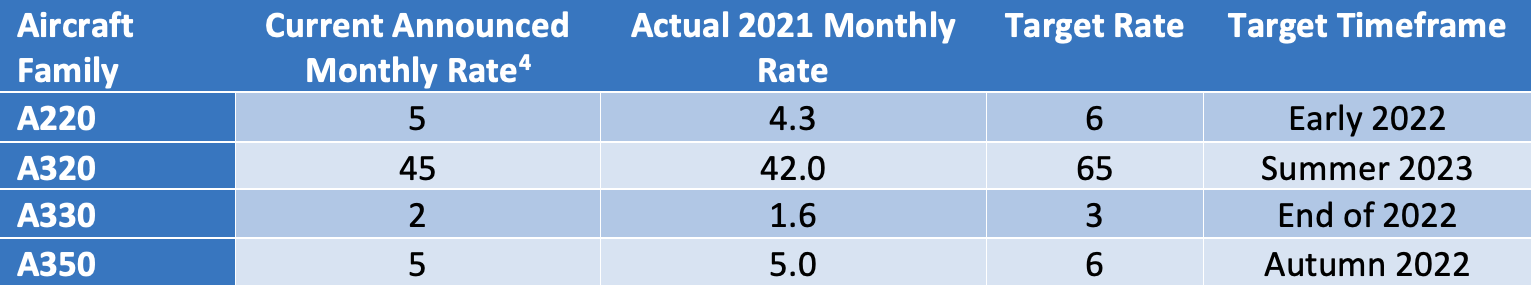
The latest status of Airbus’s production plans is:
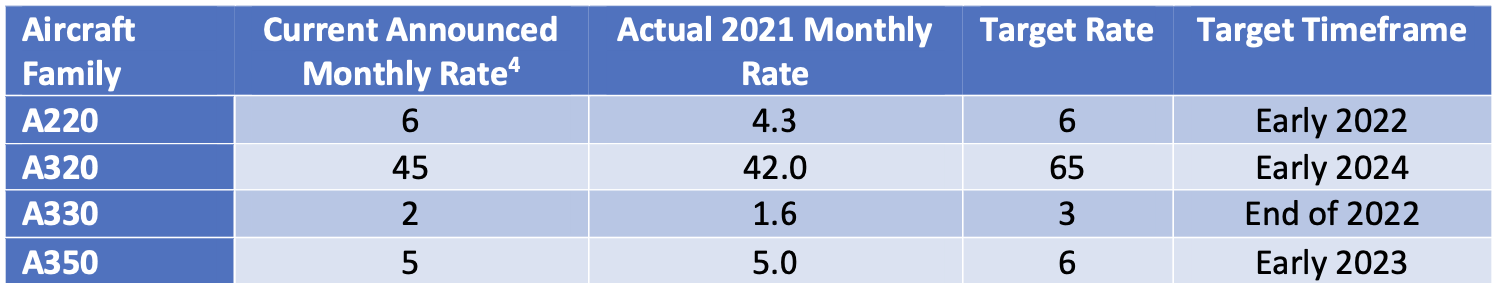
In its H1 2022 results presentation Airbus confirmed that it is aiming for an A320 production rate of 75 per month in 2025. However, due to supply chain problems it has put back the timing for its interim target of 65 per month from mid-2023 to early 2024. The A321 Neo XLR has had its target date for entry into service put back from 2023 to early 2024 and the timing for an increase in the A350 production rate has slipped from late 2022 to early 2023.
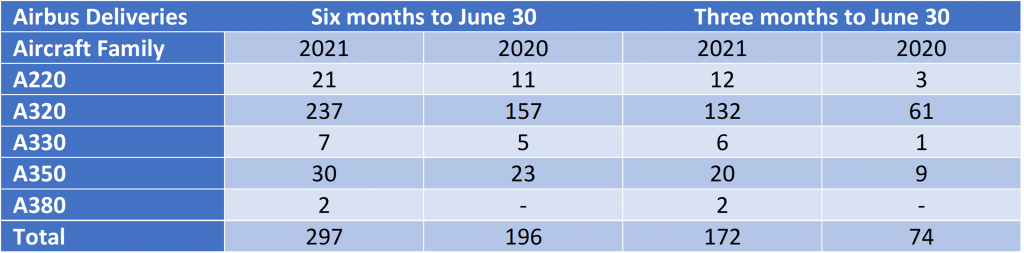
Airbus reduced its overall deliveries guidance for 2022 from 720 to 700.
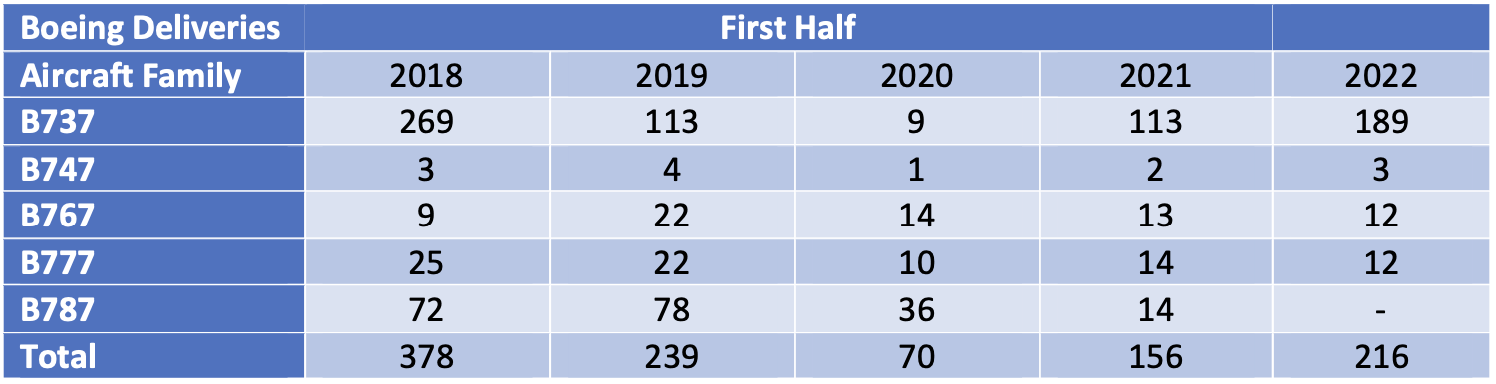
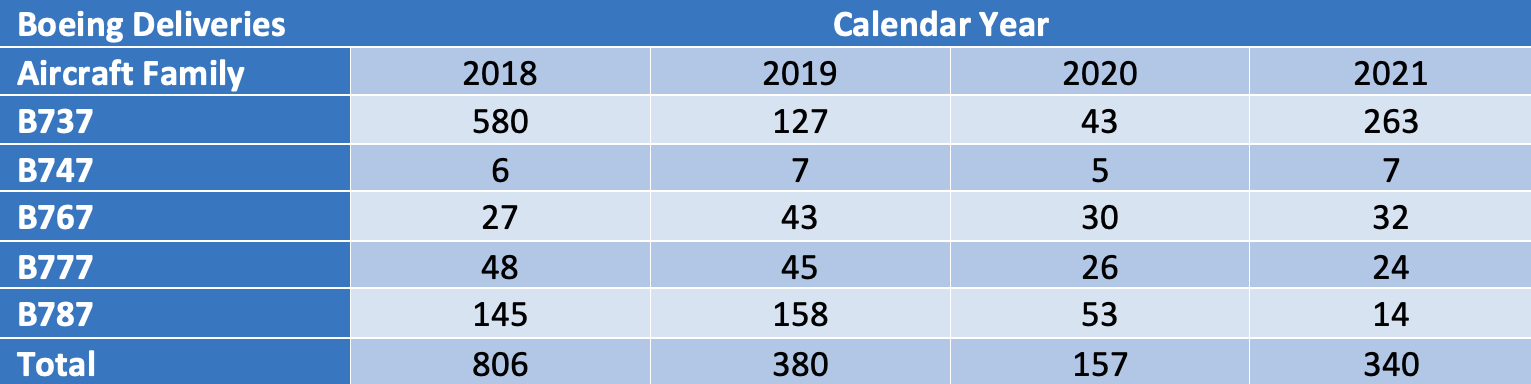
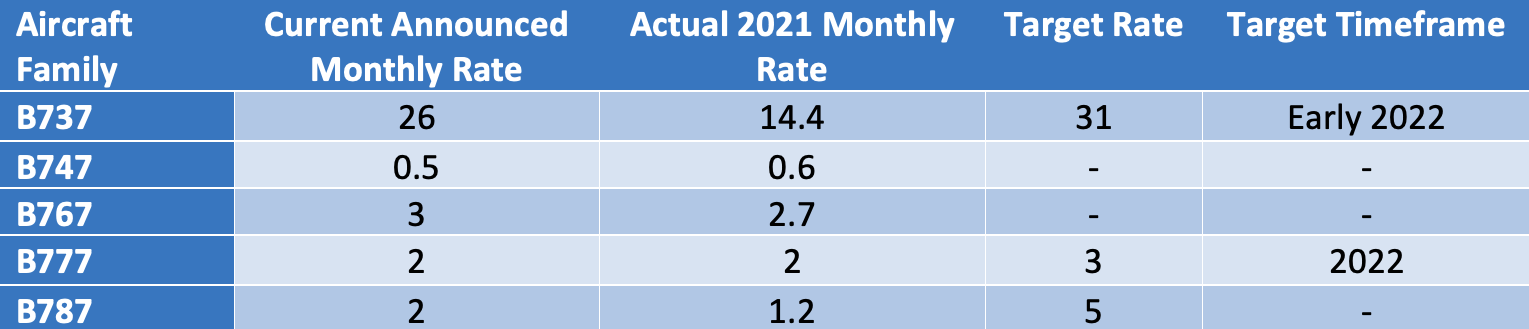
The latest status of Boeing’s production plans is:
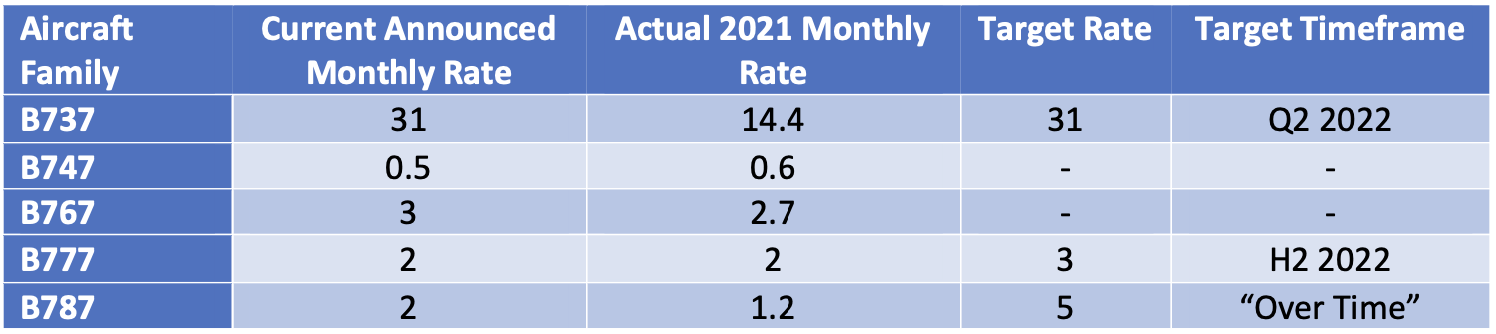
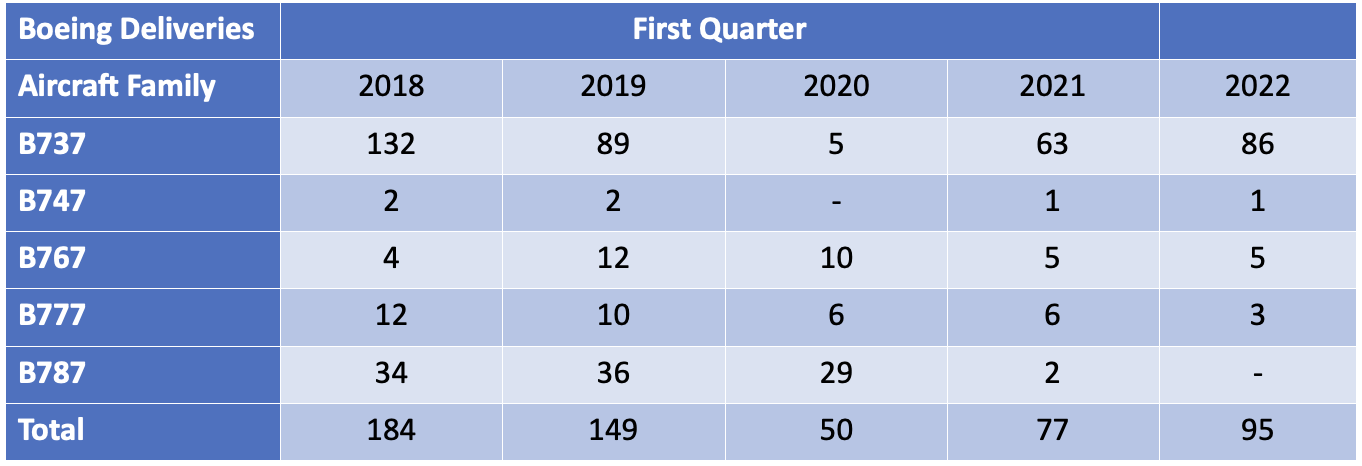
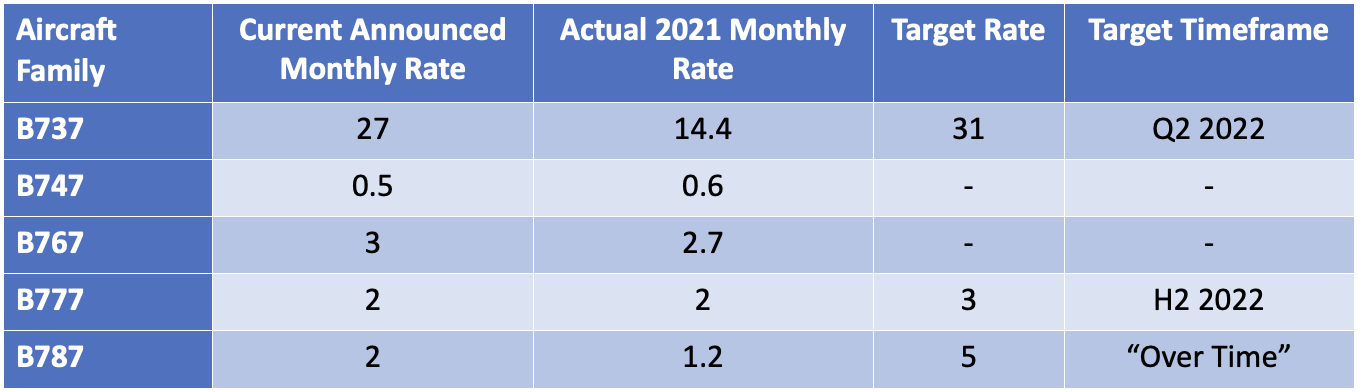
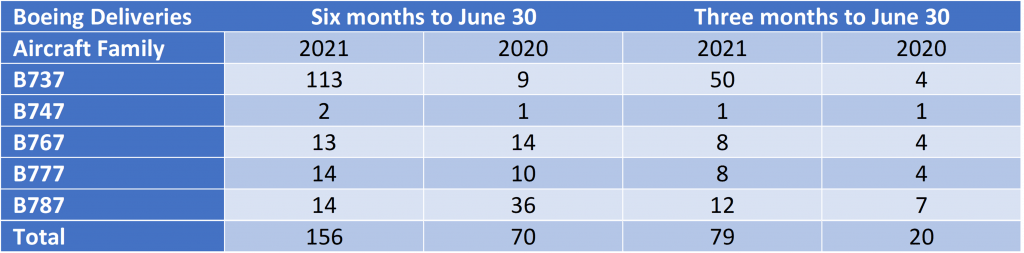
Boeing significantly increased B737 Max deliveries in the first half of 2022 and has achieved the target monthly rate of 31 that it announced when it resumed production in 2021. Boeing’s inventory of manufactured but undelivered B737 Max aircraft is dropping very slowly, from 335 aircraft at the end of 2021 to 290 at the end of June 2022, although Boeing expects to eliminate most of this inventory by the end of 2023. Earlier discussion of an increase in production to 38 per month has been shelved due to supply chain problems.
Despite this overall success the B737 max still faces challenges. It has yet to be recertified by the Chinese authorities although this is expected to be resolved soon. Also, there is effective FAA certification deadline at the end of 2022 for the new B737 Max 7 and B737 Max 10 variants. If Boeing fails to meet this deadline these aircraft will have to be redesigned to add a new emergency alerting system, which would lead to delivery delays.
Boeing has also had quality and production problems with the B787, its main passenger twin-aisle product (nearly all B747, B767 and B777 deliveries are freighters or tankers) and has suspended deliveries since May 2021. In the last few days Boeing has announced that these issues have been resolved and deliveries will resume this month. The inventory of undelivered B787 aircraft stands at 120 and there is as yet no firm timetable for this to be eliminated. Also, entry into service for the B777X has been pushed back by a year until early 2025 because of certification difficulties with the FAA.
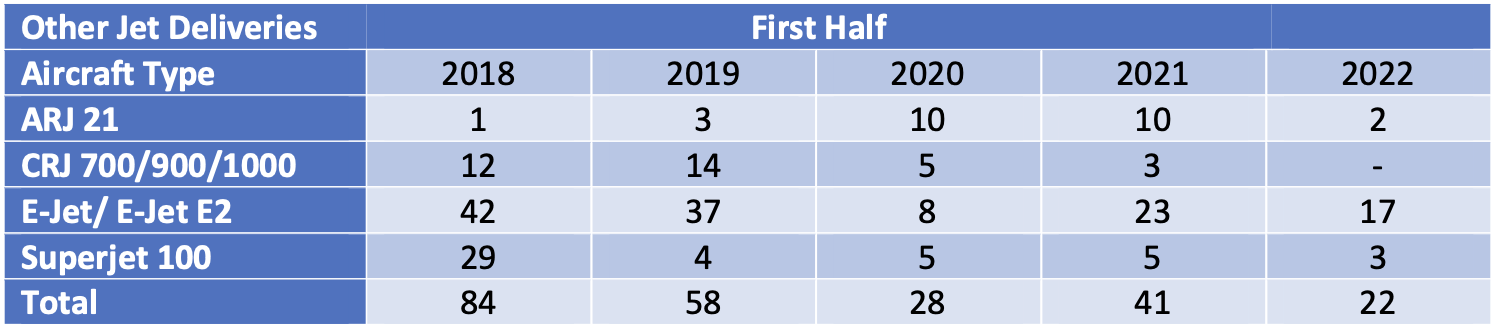
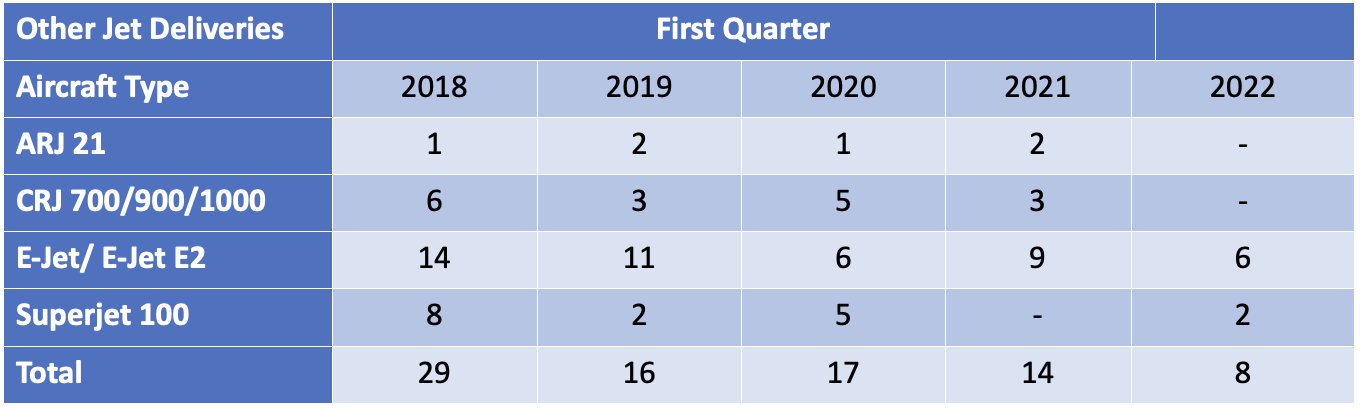
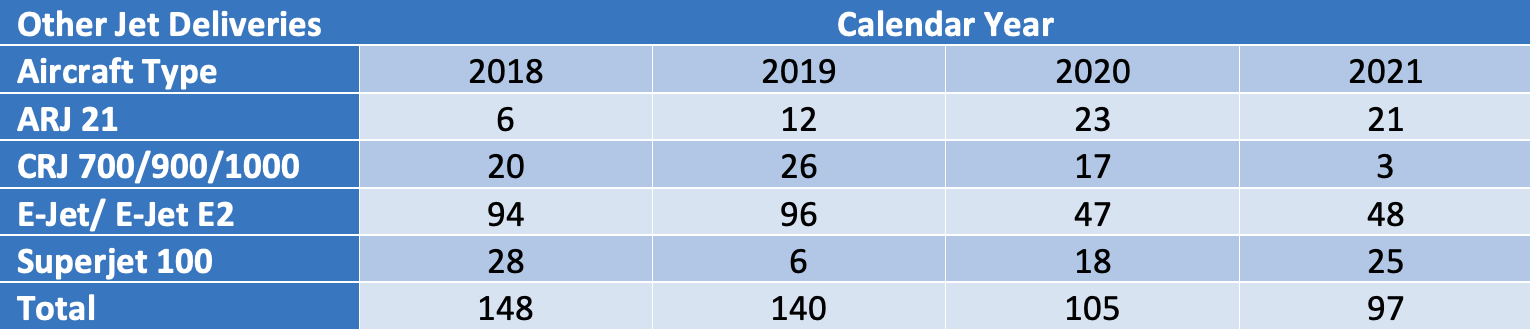
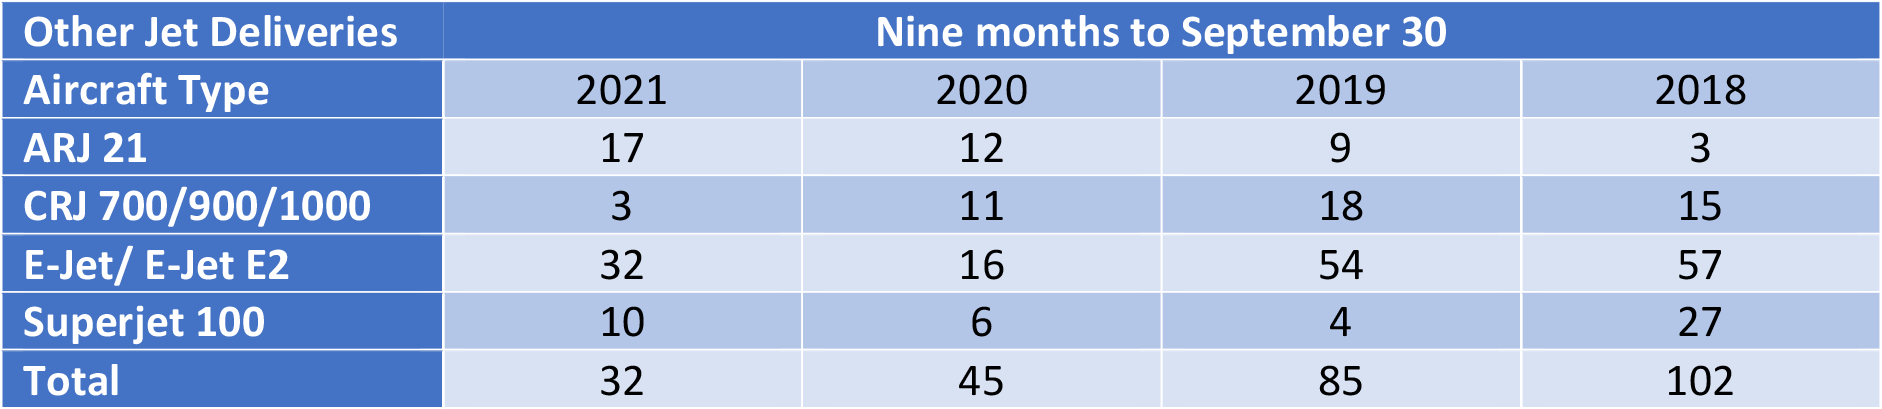
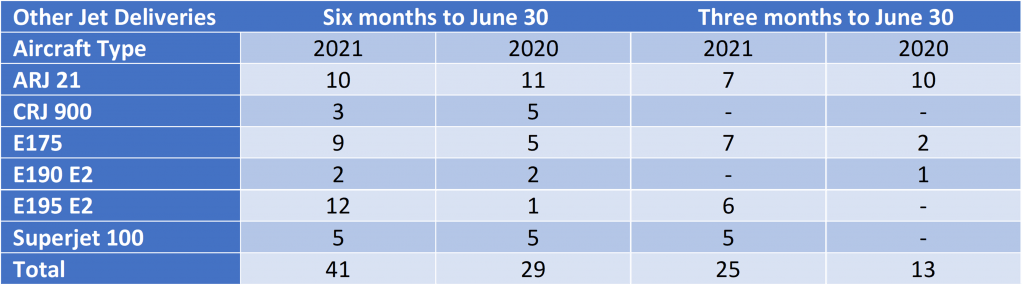
The number of commercial jets delivered by OEMs other than Airbus and Boeing has halved in the first half of 2022 compared to the same period in 2021. Modest declines for the CRJ and SSJ are due to the former ending production and the impact of sanctions on Sukhoi, in particular the announcement by the SSJ’s engine supplier Powerjet that it is withdrawing from the Russian market. The production decreases at COMAC and Embraer are more short term as the former has a strong backlog and the latter is guiding 60-70 deliveries for the full year.
Airline Industry Financial Performance
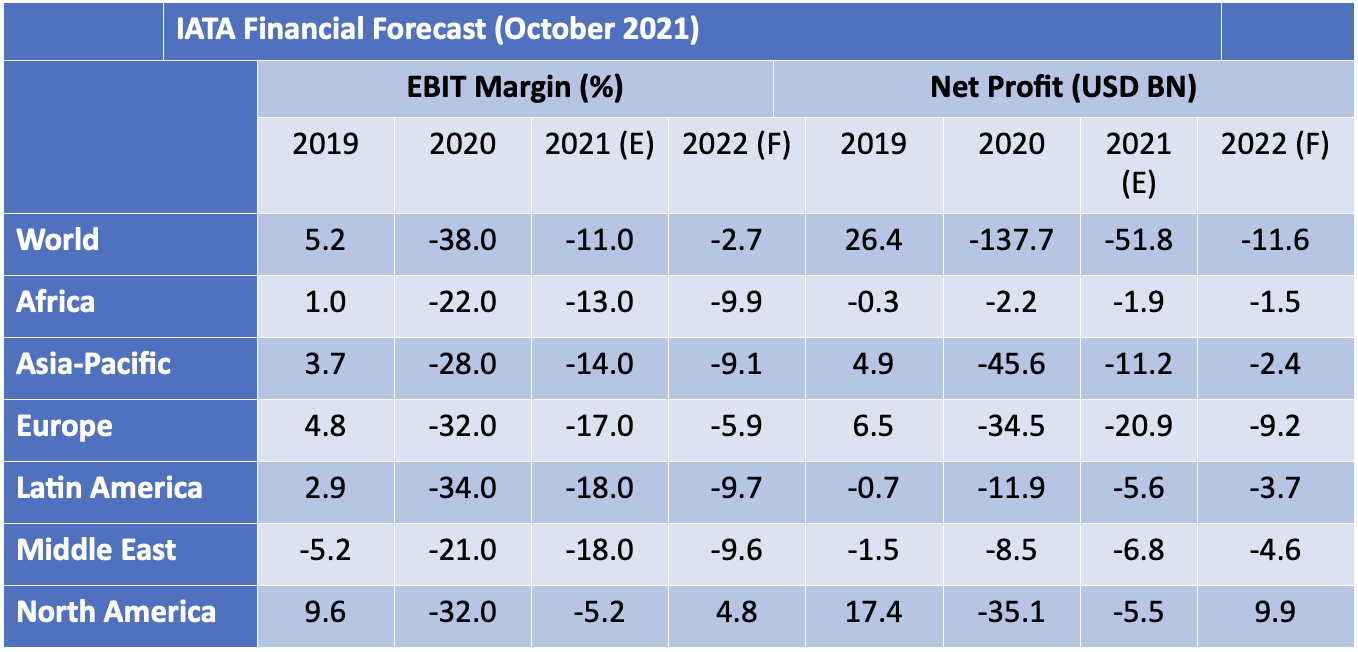
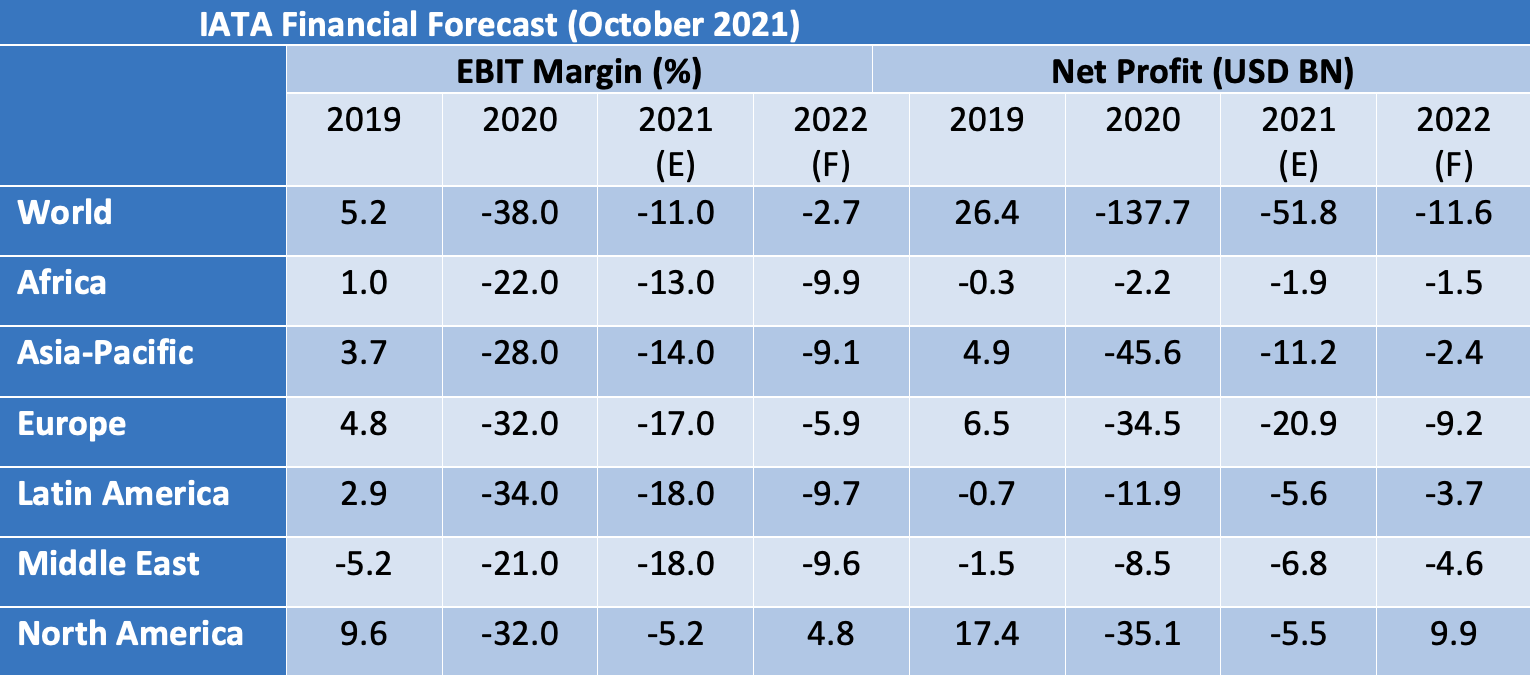
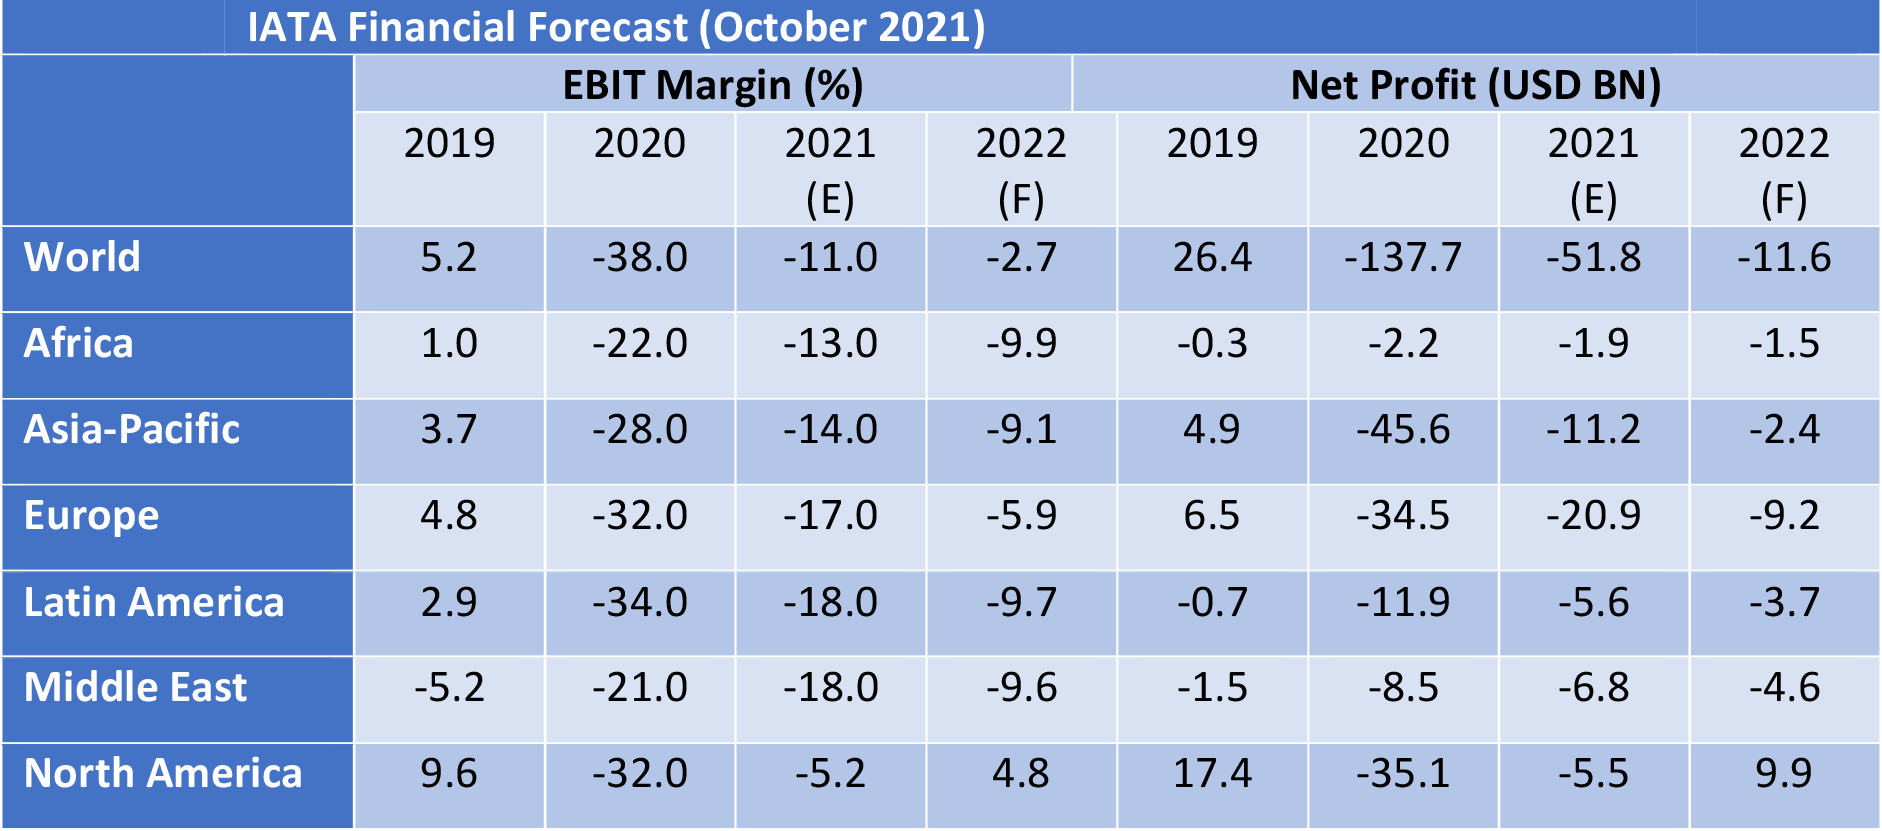
IATA’s June 2022 financial forecast shows the airline industry returning to near breakeven in 2022. North America is set to be the first region to move back into net profit and Europe is forecast to be the next best performer on an EBIT Margin basis. The forecast shows a general pattern of modest improvements compared to its predecessor in October 2021 except for a much-improved outlook for Europe and a much less favourable outlook for Asia-Pacific. Europe’s relative performance is much better than in 2021 due to positive impacts of its Covid passport scheme and the re-opening of North Atlantic travel, whereas Asia-Pacific is suffering from both lockdowns in China and more persistent government travel restrictions than in other regions.

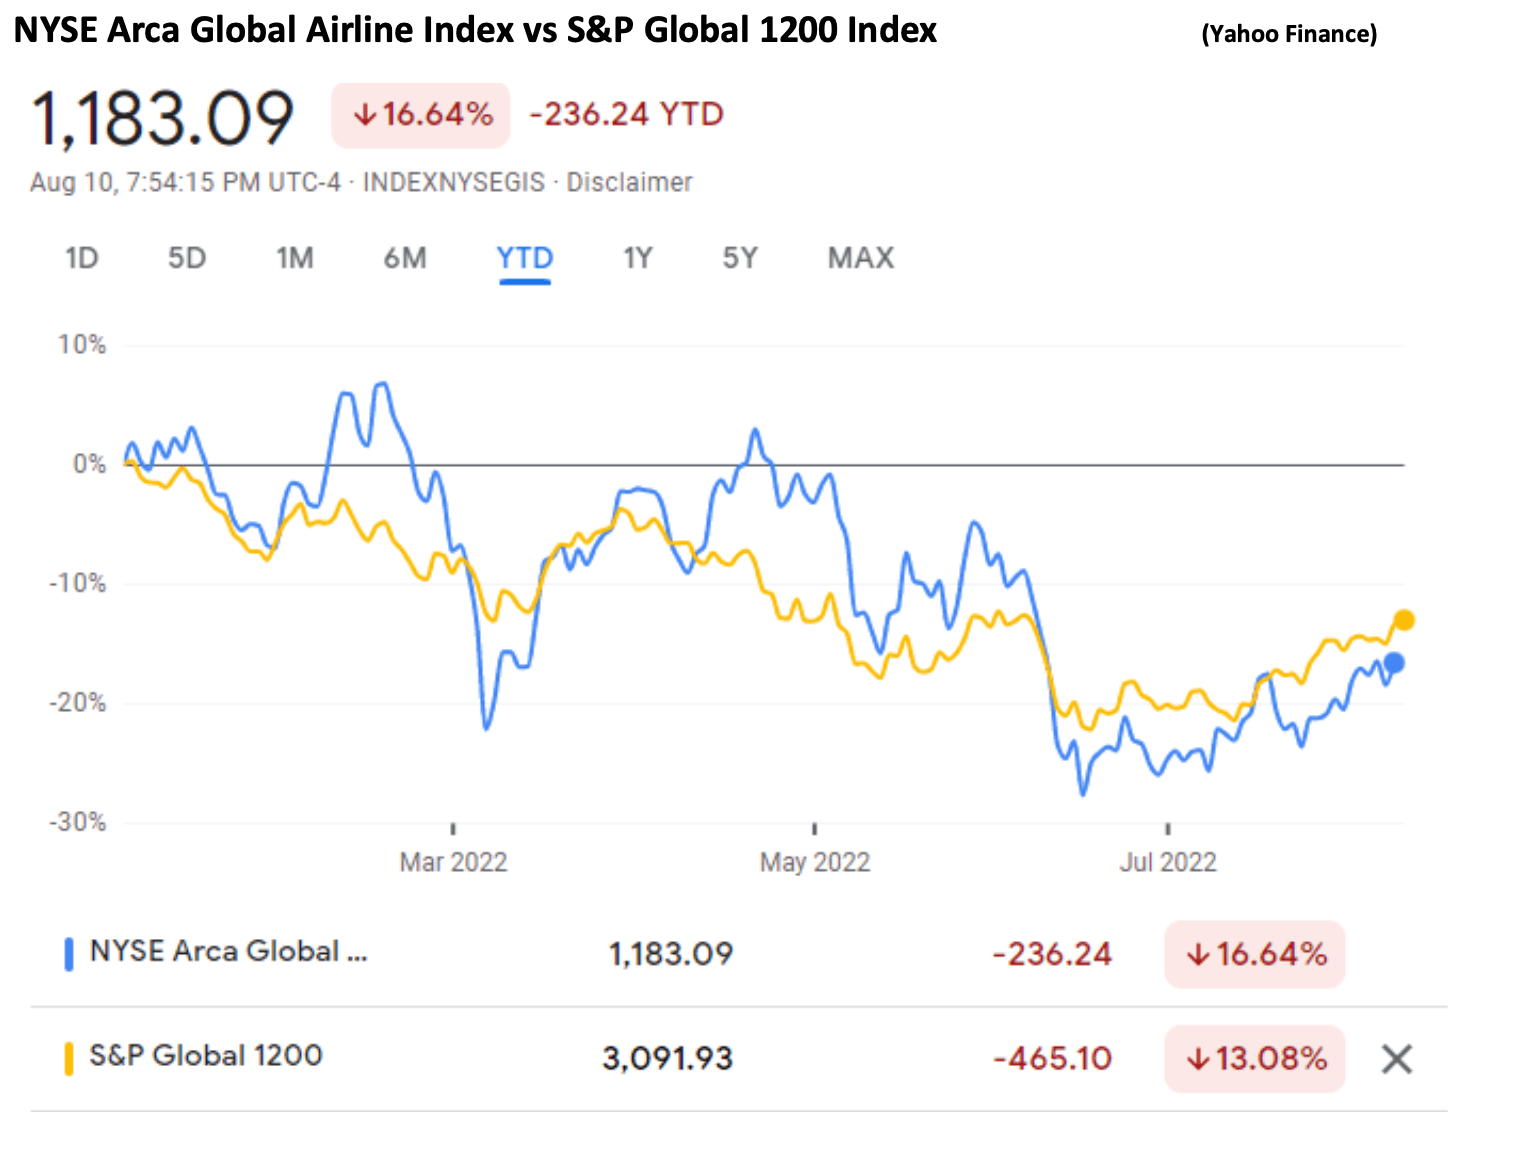
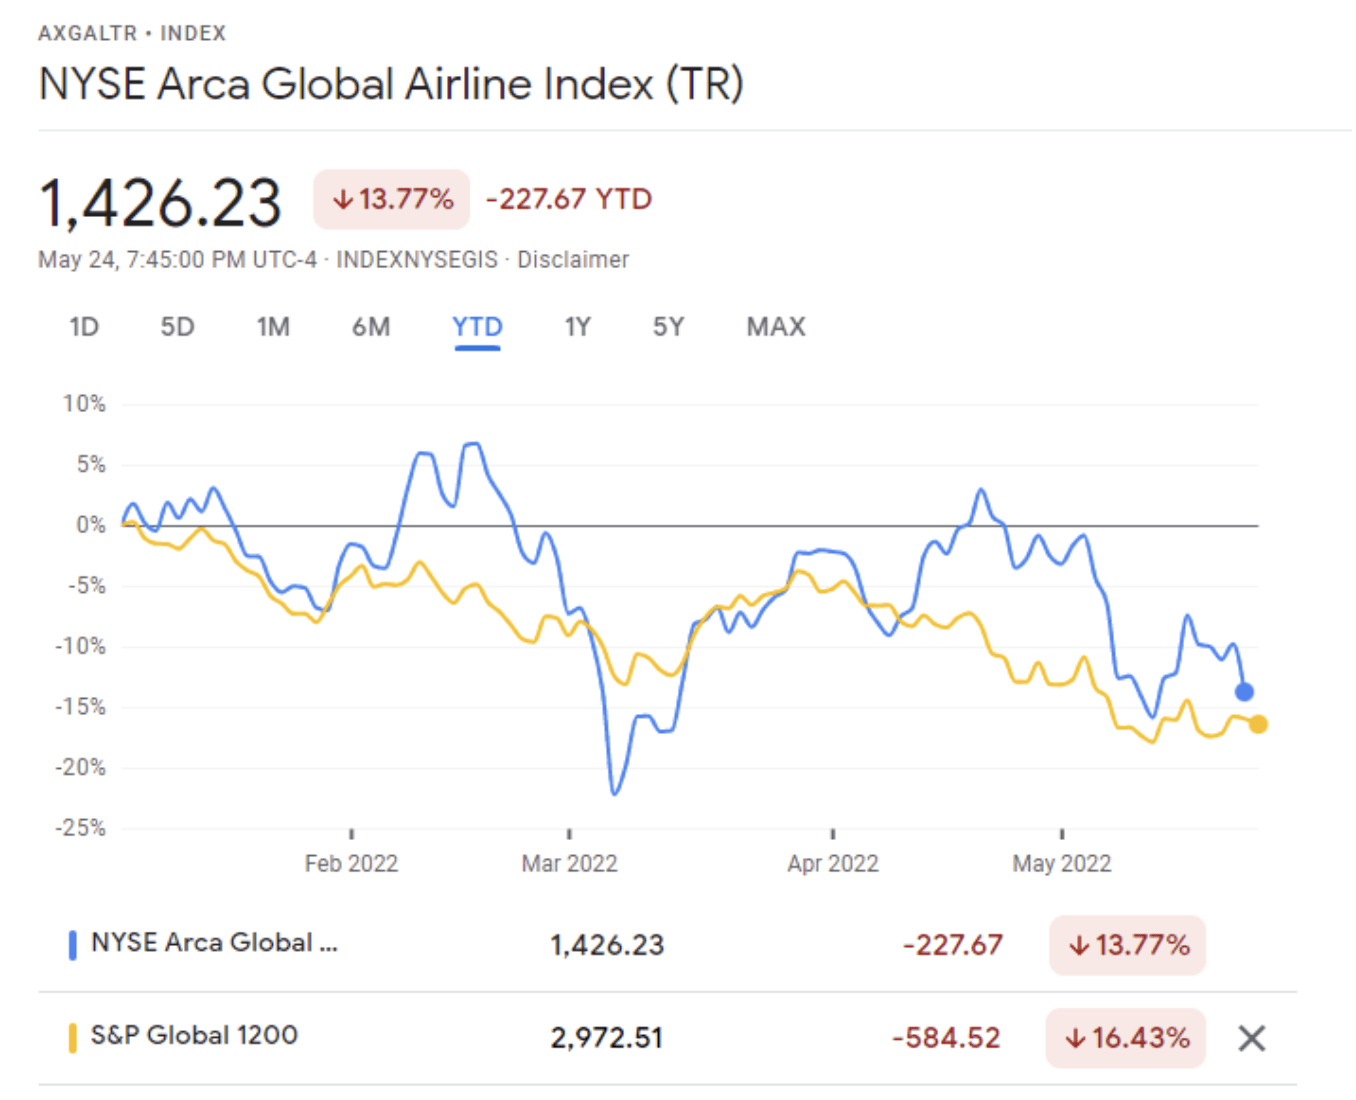
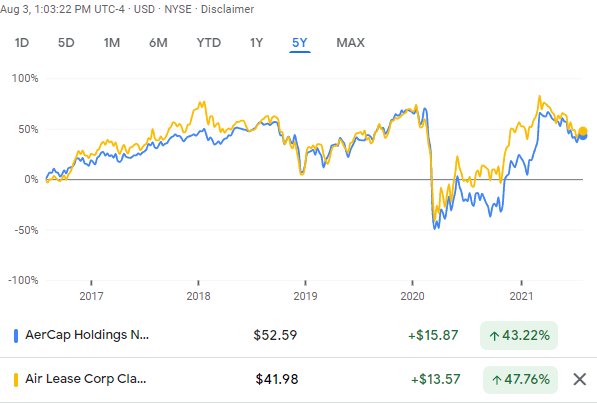
So far in 2022 airline shares have slightly underperformed the overall market. Since 2020 airlines have not recovered in line with the overall market because of the need to issue new stock to repair their balance sheets. New equity issuers have included Air Asia, Air France-KLM, Air New Zealand, American Airlines, easyJet, El Al, Flyr, Garuda, Lufthansa and TUI.
The major airline credit event in 2022 so far has been the effective confiscation of aircraft leased to Russian airlines by western lessors, which we discussed in detail in our Q1 2022 publication. There has been no fundamental change since then, although recent reports that some western aircraft are being cannibalised for spare parts is in line with our discussion of likely future developments.
In July 2022 SAS applied for Chapter 11 bankruptcy protection in the US courts. This is the only major airline bankruptcy so far this year. We have not been able to identify any significant airline failures outside Russia since the start of 2022. Also, in June Comair (South Africa) entered liquidation after a successful restructuring in 2020. These events illustrate the fragile financial condition of many airlines post-pandemic and their vulnerability to adverse events such as the pilot strike at SAS. Given the high level of fuel prices and the US Dollar there is a good chance of further failures this winter, particularly if there is a recession. According to the aviation consultancy Ishka the number of airlines in bankruptcy/restructuring in July was 11 with 623 aircraft affected[5].
Special Topic - New Aircraft Pricing
What does an aircraft purchase agreement look like?
The structure of new aircraft purchase agreements is well understood as many of these are in the public domain for example as exhibits to SEC filings by airlines and lessors, although the key economic terms are redacted.
Typical key economic terms of an aircraft purchase agreement include:
• A schedule of delivery dates - one should bear in mind that most aircraft purchase agreements are for more than one aircraft and can run to over one hundred;
• A base price per aircraft as of a specific date, normally the contract date. The calculation of this price is complex involving multiple credits against the quoted list price;
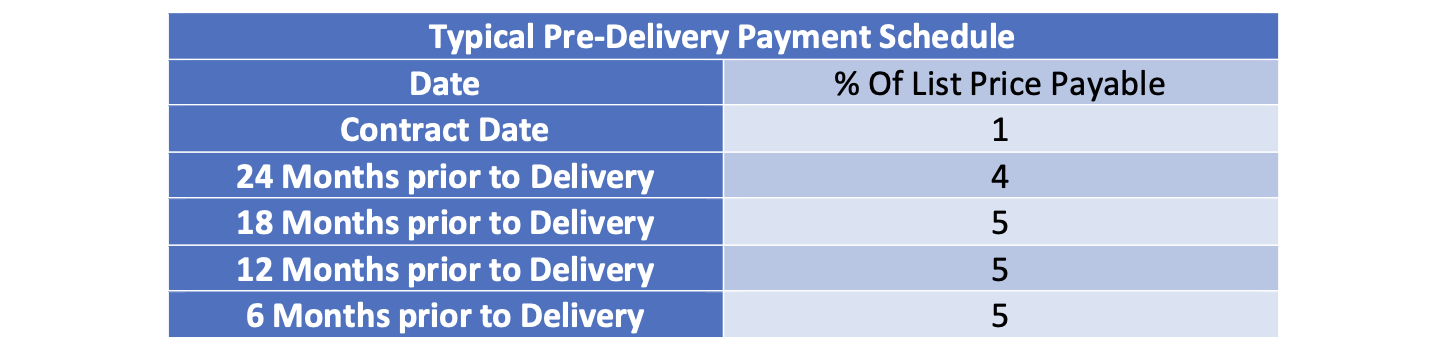
• A pre-delivery payment schedule, whereby the purchaser makes a series of payments both on the contract date and also at various periods prior to aircraft delivery. These pre-delivery payments are offset against the final purchase price;
• An escalation formula which adjusts the base price by reference to one or more inflation indices to compensate the manufacturer for increased costs between the contract date and delivery date. There is a more detailed discussion of escalation below.
Normally there will also be a separate agreement with the engine manufacturer. This might be a full purchase agreement where there are competing engine types for a twin-aisle aircraft, with a similar structure to an aircraft purchase agreement. For most single-aisle aircraft the aircraft manufacturer generally has a concession arrangement with the engine manufacturer and incorporates the engines within the aircraft purchase agreement. However, there will likely still be a less extensive side agreement between the buyer and the engine manufacturer.
Aircraft list prices
Airbus and Boeing’s aircraft list prices have been the object of increasing scepticism and/or bemusement amongst their customers over the years and the chart below tries to explain why. We have calculated inflation indices for Airbus and Boeing list prices based on the average change in list price by aircraft type. The chart presents these along with the US CPI and our proprietary estimate of actual aircraft inflation based on extensive industry research.
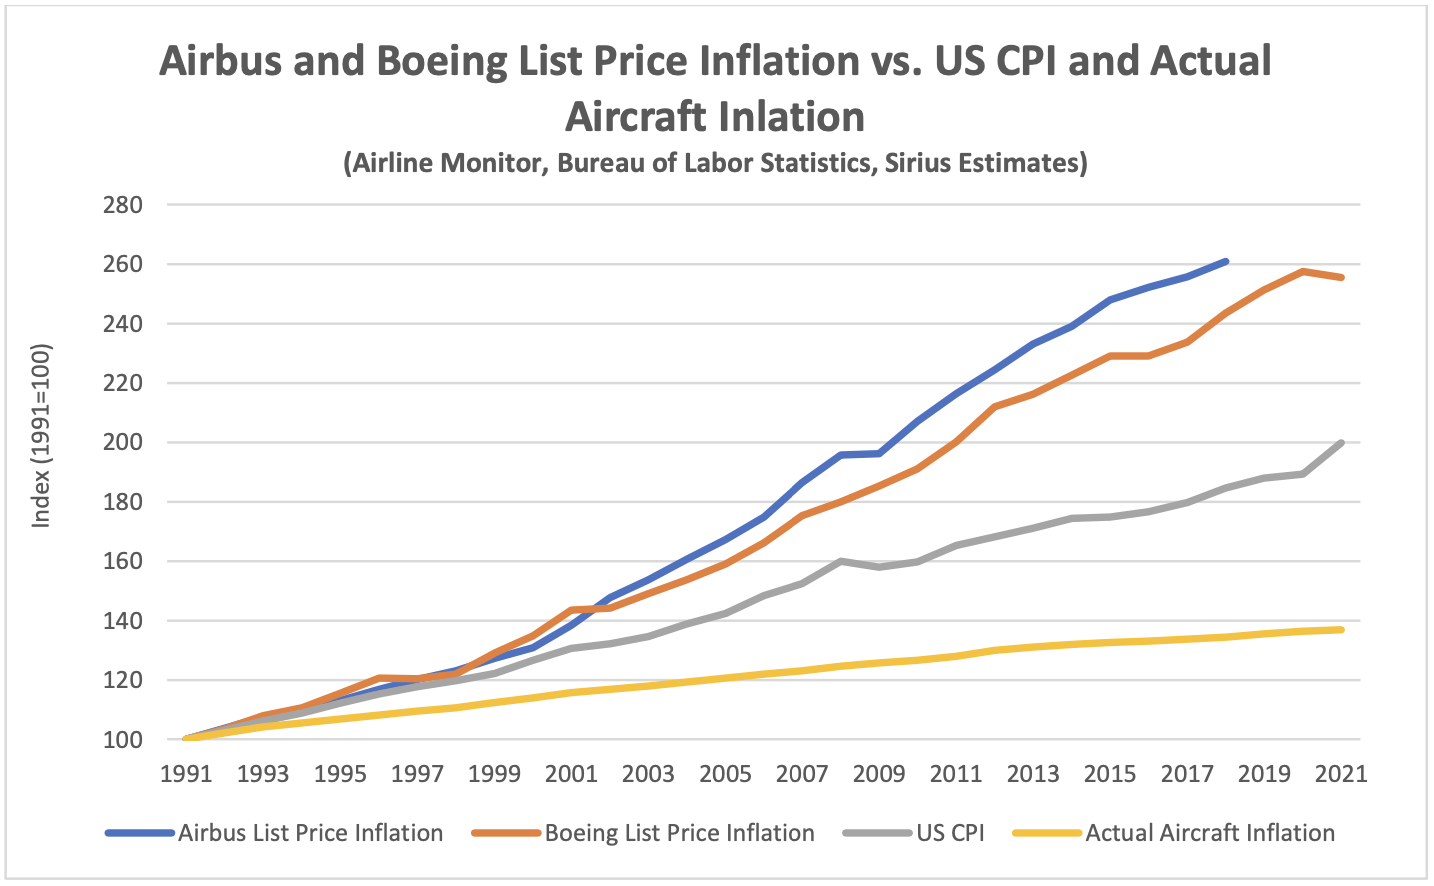
List price inflation is much higher than general inflation, which in turn has been higher than our estimate of the actual inflation in new aircraft prices. We believe the low level of actual inflation has been driven by Airbus and Boeing passing on efficiency improvements to customers in lower real prices so as to maintain market share. The cumulative effect of these differences is that typical discounts to list price are now between 50% and 60%.
The OEMs’ motivation for this behaviour is unclear but may include the following:
• Aircraft list prices have moved broadly in line with aircraft engine list prices, which are very close to actual spare engines prices (engines sold are part of an aircraft order are heavily discounted);
• Pre-delivery payments are calculated relative to list prices so high list prices help the OEMs’ cash flow; and
• Higher nominal discounts help sell aircraft.
There has been speculation that list prices can play a role in “market signalling” and where Airbus and Boeing have very similar products such as the A320-200 and B737-they have stayed quite close. However, this argument is undermined by the generally higher increases in Airbus list prices over time and the fact that Airbus stopped publishing them after 2018.
Escalation
Escalation calculations in an aircraft purchase agreement are based on a blend of one or more inflation indices. These are all US indices as nearly all commercial aircraft transactions are in US Dollars. Although there is no standard blend, a typical combination might be:
• 50% Aircraft manufacturing Wages and Salaries (Series ID: CIU2023211000000I); and
• 50% Industrial Commodities (Series ID WPU03THRU15).
Escalation is calculated on a cumulative basis over the period from contract to delivery date and is normally subject to a negotiated cap of around 3% p.a. However, if cumulative escalation is higher than around 5% p.a. the cap may fall away under an arrangement sometimes described as a “hyper- out”, designed to protect the OEM from an excessive exposure to rising costs.
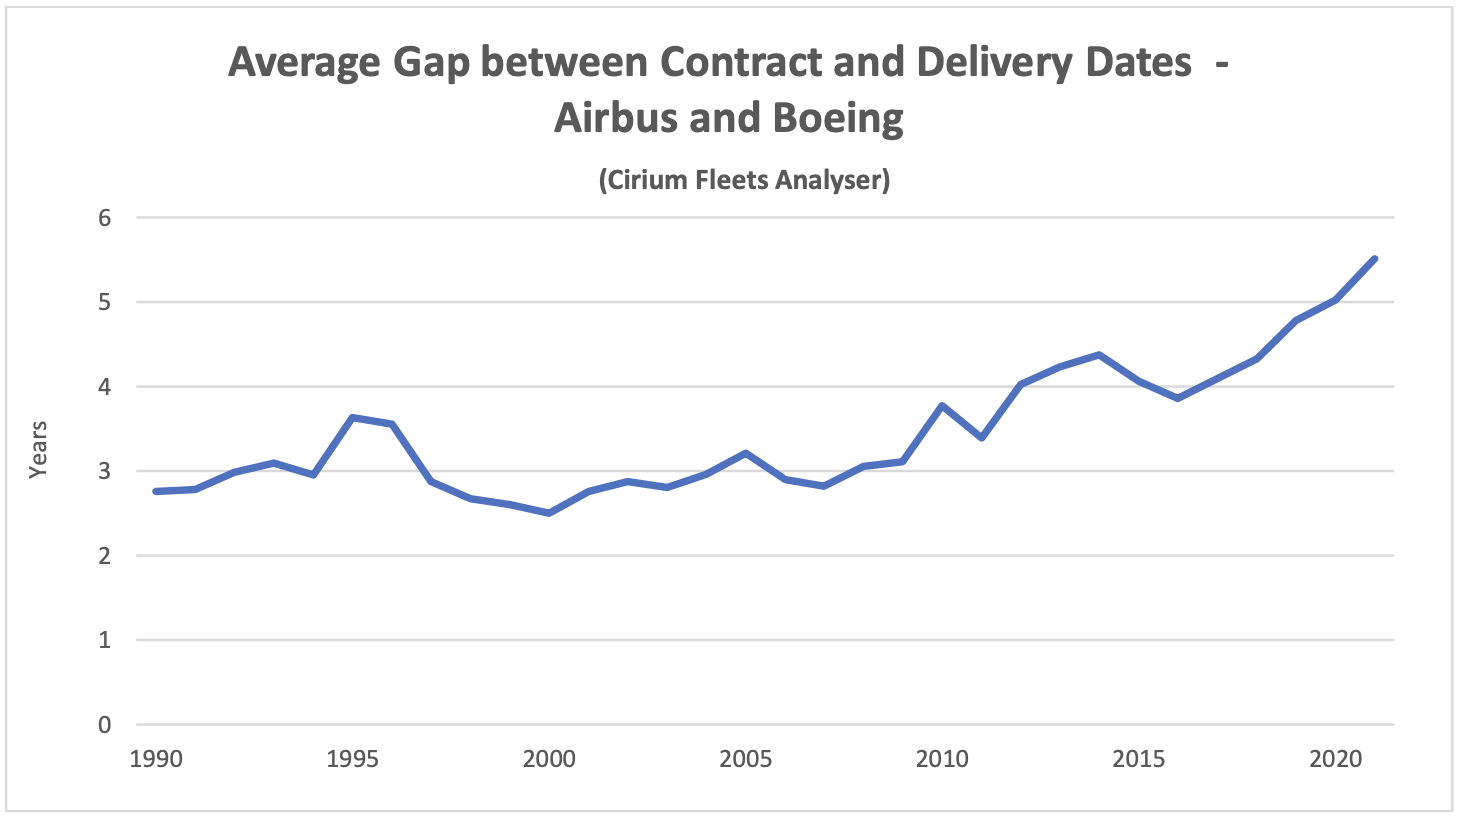
The impact of escalation on delivered aircraft prices has increased since 2010 because the gap between contract date and delivery date has increased from 3 years to nearly 6 years. This trend has been stronger since 2019 because of belayed deliveries of the B737 Max and the B787 but clearly predates these events. Where escalation is in line with actual aircraft inflation that impact is not very important, but on average escalation has been higher so the real cost of the last aircraft delivered under a purchase contract becomes significantly higher than the first.
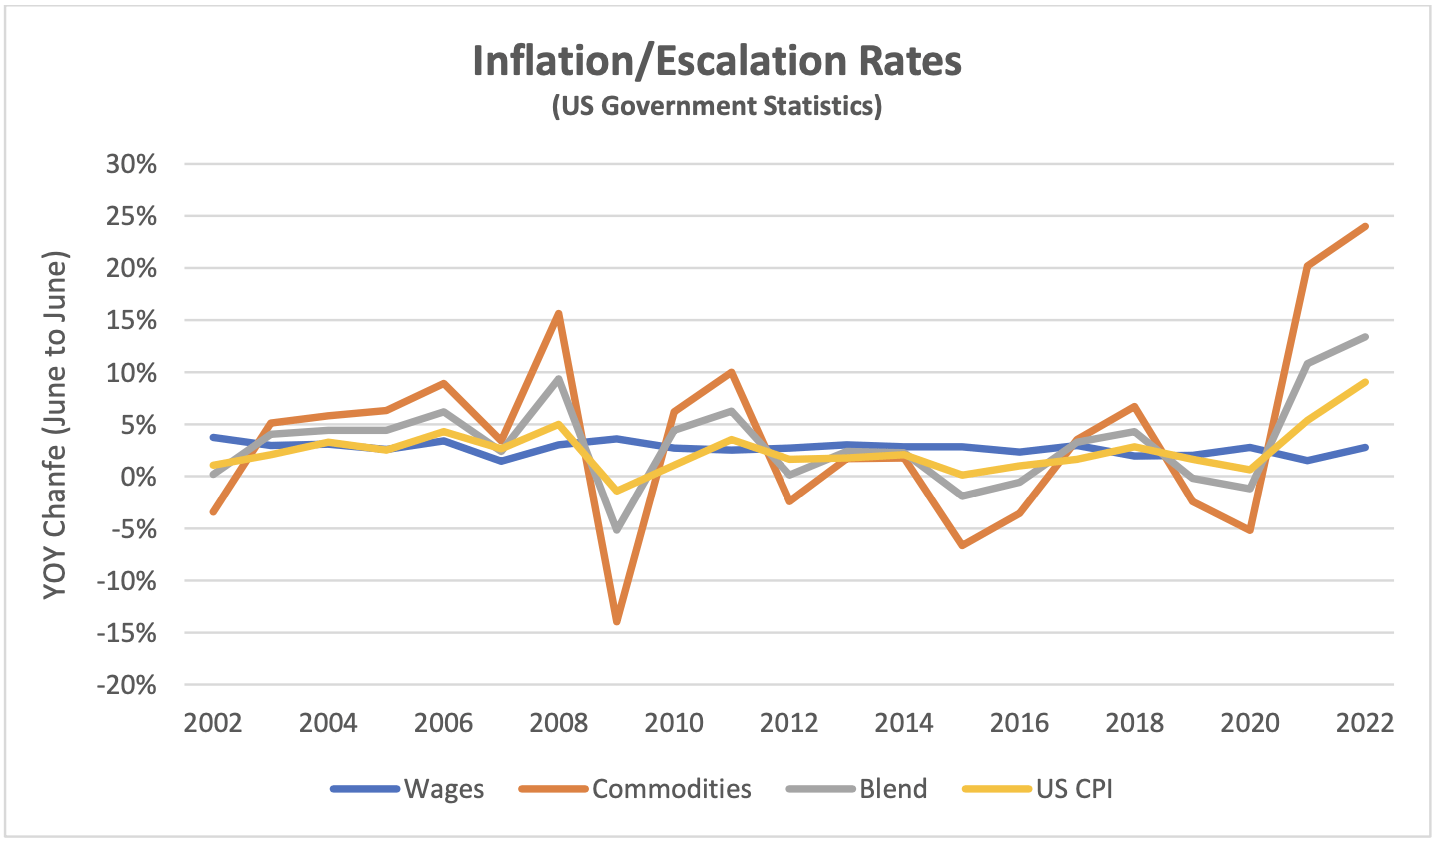
Commodity prices have been much more volatile than wages or general inflation, so the blended escalation rate has also been volatile. Recent spikes in commodity prices have led to speculation that some purchase contracts may have their “hyper-outs” triggered. The chart above shows the annual change in the wage and commodity price indices listed above together with a 50/50 blend and the US CPI for comparison purposes.
The extent to which aircraft buyers are exposed to “hyper-outs” is a function of when they placed their orders because escalation is calculated on a cumulative basis. The chart below shows the escalation CAGR[6] through 2022 for the previous 8 years (if the average gap between order and delivery is six years there will be some aircraft delivering that were ordered 8 years or even longer ago).
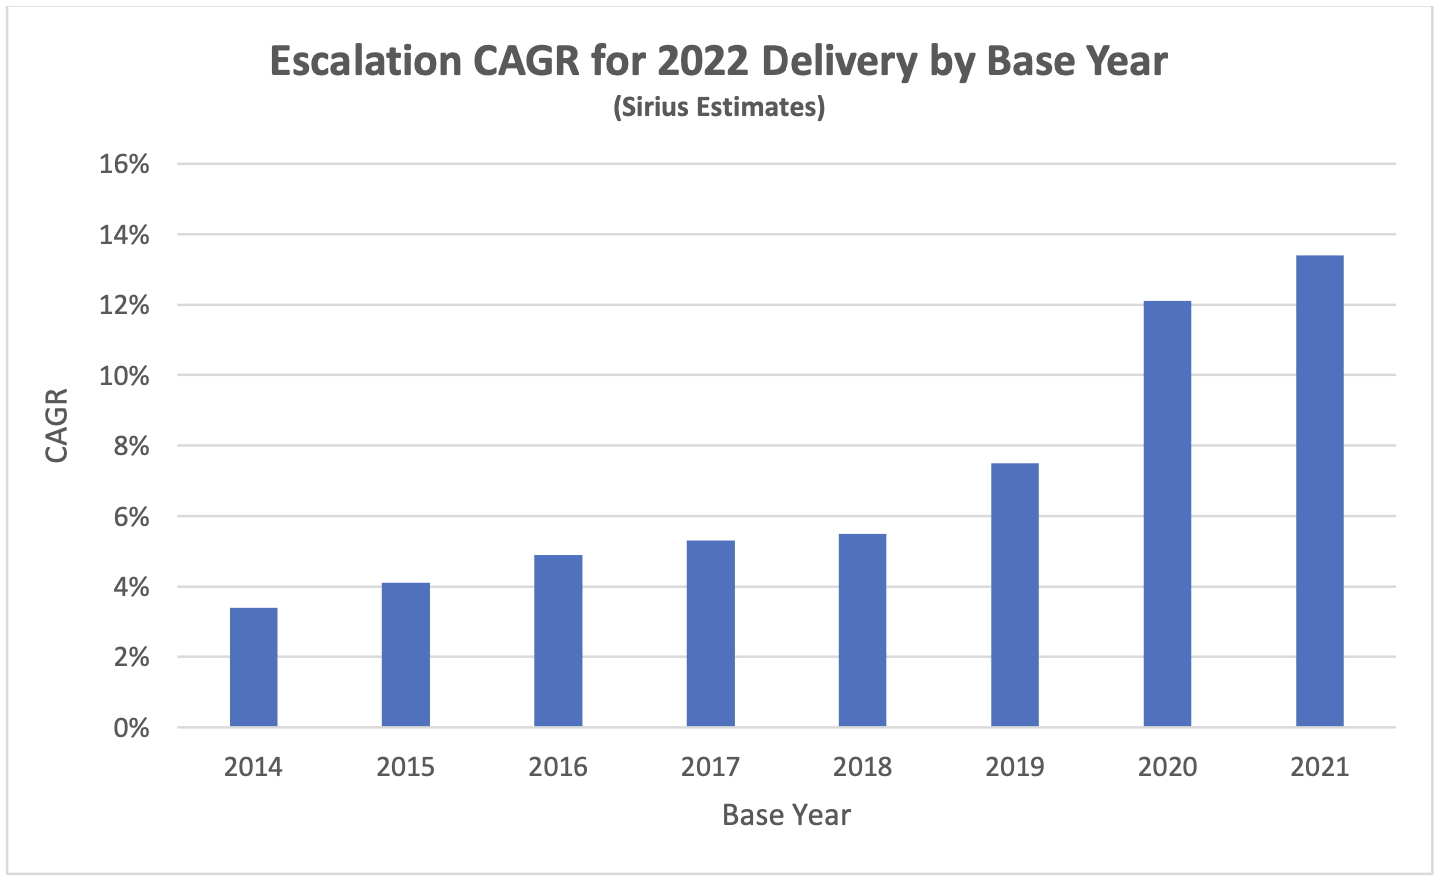
Although our escalation formula is only illustrative, we believe it is broadly representative of market practice, and this analysis suggests the following:
• Most buyers will be paying escalation up to their cap;
• There should be relatively little impact on buyers who ordered before 2019; and
• Buyers that ordered after 2018 will be impacted, particularly if they ordered in 2020 or
2021.
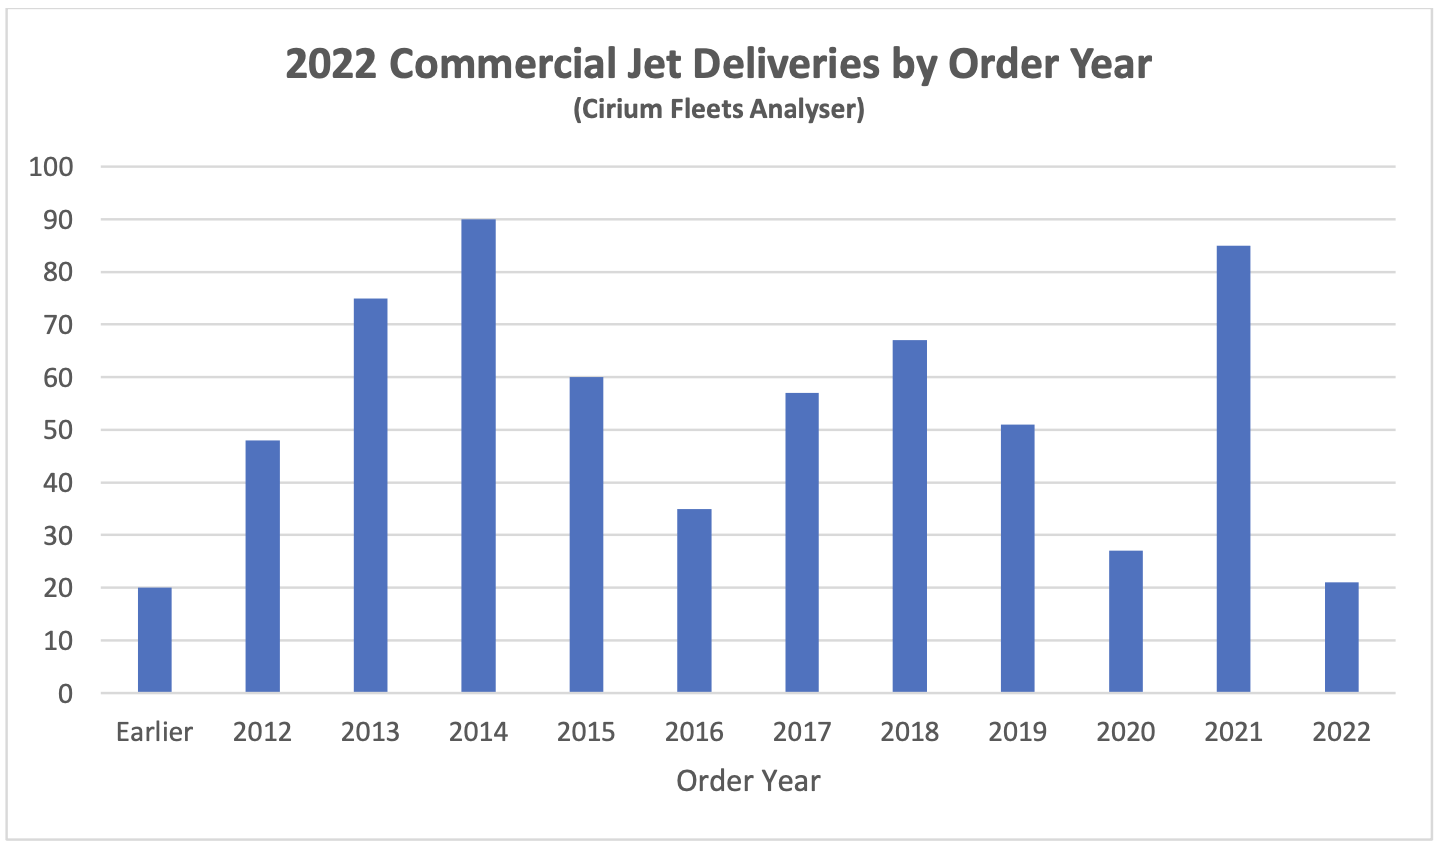
There may not be an enormous aggregate impact on average aircraft delivery prices from these developments, mainly because right now there are not many aircraft delivering that were ordered in 2020 and 2021. Also, those aircraft that were ordered in these years (and 2022) probably became available as a result of airline defaults and sanctions on Russia, which means that the new buyers would have had had the opportunity to renegotiate various contractual terms including escalation.
If increases in commodity prices persist then there will be a major impact on aircraft delivery prices in the next few years, particularly if wage growth picks up as well. This could happen even if general inflation becomes more subdued because industrial commodities are a fairly small part of an increasingly service-orientated economy. However, commodity prices have a history of high volatility including a number of precipitous falls so such a development is far from certain.
Disclaimer
This document is for informational purposes only. It is not intended as advice or a recommendation with respect to any transaction. The recipient of this document shall be solely responsible for making its own independent investigation and appraisal of any transaction. No market or company data or other information is warranted or guaranteed by Sirius Aviation Capital as to its completeness, accuracy, or fitness for a particular purpose, express or implied, and such data and information are subject to change without notice. Any comments or statements made herein reflect the assumptions, views, and analytical methods of the persons that prepared this document as of its date of preparation, and do not necessarily reflect the views of Sirius Aviation Capital. Sirius Aviation Capital may have issued, and may in the future issue, other communications that are inconsistent with, and reach different conclusions from, the information presented herein. Sirius Aviation Capital specifically disclaims any obligation to update this document, or any comments or statements contained herein.
[1] The crack spread refers to the overall pricing difference between a barrel of crude oil and the petroleum products refined from it. It is an industry-specific type of gross processing margin.
[2] Sources: IATA, Platts
[3] ASKs is the acronym for available seat kilometres, which is the product of the number of seats flown and distance flown.
[4] Airbus normally quotes its production rates based on an 11.5-month year for single-aisle aircraft and an 11- month year for twin-aisle aircraft.
[5] Fleet totals are based on Cirium Fleets Analyser data as of July 2022
[6] Compound Annual Growth Rate
Industry Review Q1 2022
• Macro-Economic Background
• Traffic and Aircraft Demand
• New Aircraft Supply
• Airline Industry Financial Performance
• Special Topic – Why are Twin Aisle Aircraft Production Rates So Low?
Macro-Economic Background
The IMF has continued to downgrade its forecast for world economic growth with significantly lower numbers for 2022 and 2023 only partly offset by an upward historic revision for 2021. The main change since January has been economic impact of the Russian invasion of the Ukraine. This has worsened the problems in global supply chains that were already leading to increased inflation. Global economic growth is vital to the long-term growth of air travel. However, in the next few years the key drivers of growth will likely be very specific to the airline industry, especially the recovery from the industry downturn caused by
the Covid 19 pandemic.
Fuel prices have spiked since February mainly due to an increase in the “crack spread” to record levels, rather than an increase in the price of crude oil. The crack spread is a function of the market for oil refining capacity which has clearly been disrupted by the economic shocks described above. Another symptom of this disruption is the wide divergence in jet fuel prices in different geographies.
For airlines outside of the US this cost increase has been compounded by a strengthening US Dollar. This is a very important factor in airline financial performance because so many airline costs are typically US Dollar-denominated – not just fuel but also aircraft rents, debt service, aircraft, and spare parts.
Traffic and Aircraft Demand
The first quarter of 2022 experienced what looks like the beginning of the long-awaited recovery in global airline traffic - there were particularly sharp traffic increases in Europe and the Middle East. However, traffic growth in Asia Pacific was very weak and actually declined year on year in March, mainly due to the disruptive effect of lockdowns on domestic Chinese RPKs. As the chart below shows global traffic remains well below 2019 levels, and a full recovery will require much greater relaxation of government interventions to combat the spread of Covid 19.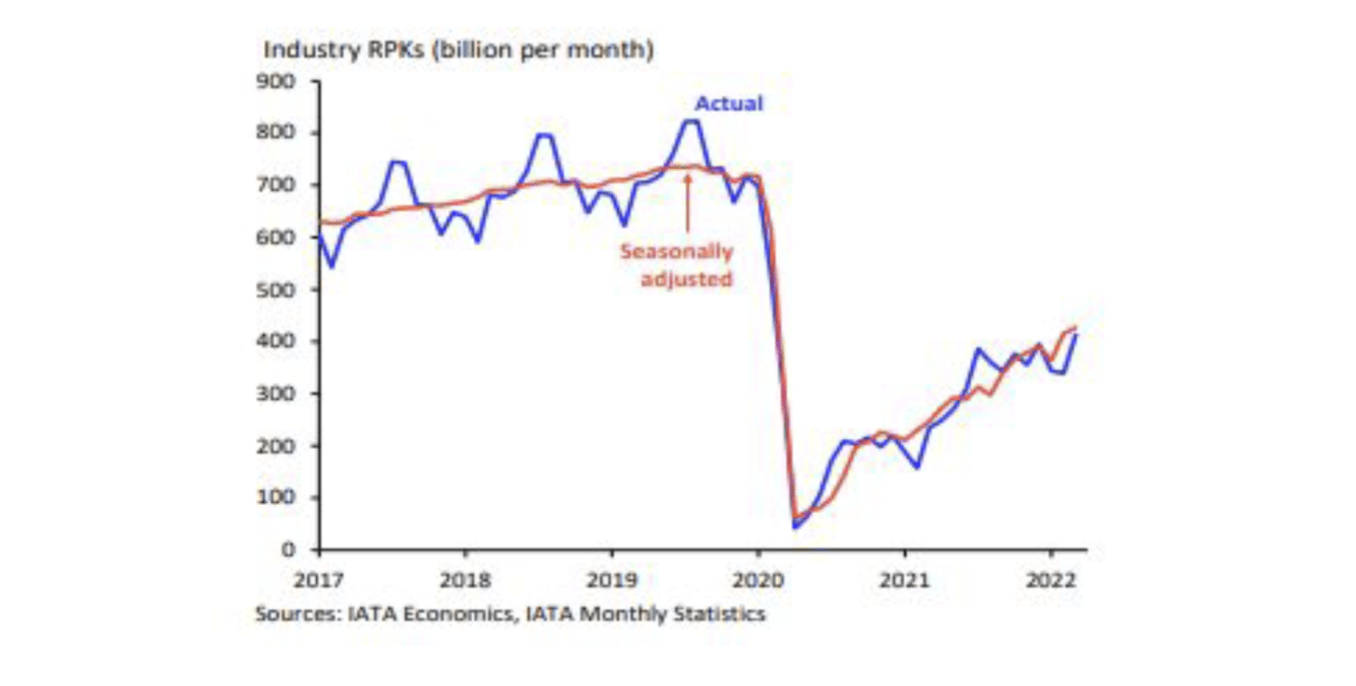
There was a much bigger increase in international traffic vs domestic traffic, mainly because the former was coming off a much lower base. The strongest international recovery was in Europe and barring further unexpected geopolitical events there is a very strong summer in prospect. It should be borne in mind that European international air travel includes much more short haul than other regions because geography limits the demand for domestic air travel outside of Russia.
Although some short-haul aircraft serve international routes nearly all long-haul aircraft do so, and this is reflected in the relative demand for single-aisle (narrowbody) and twin-aisle (widebody) aircraft. Aircraft demand can be measured in terms aircraft in service and ASKs[1], the standard measure of aircraft capacity deployed by airlines which indicates how intensively aircraft are being flown. Single aisle aircraft in service levels are now very close to where they were in 2019 with a slightly weaker recovery in ASKs due to lower utilization. The comparable figures for twin aisle aircraft are much weaker.
New Aircraft Supply

The latest status of Airbus’s production plans is:
Airbus has recently announced that it will decide about future increases in A320 family production after 2023 by the middle of 2022. It is considering production rates of up to 75 per month by the middle of the decade but has to deal with significant supply chain problems and scepticism from some of its major lessor customers about the ability of the market to absorb this level of supply.
The A321 Neo now accounts for a majority of A320 family backlog – this is a very significant development because it suggests the trend for single-aisle aircraft to take market share from twin-aisle aircraft retains a lot of momentum and because Boeing has yet to develop a strong competitor to this aircraft type.
Although Airbus is in a much better position than Boeing (see below), it is reported that its deliveries are subject to widespread and significant delays.
The latest status of Boeing’s production plans is:
We have not been able to find any updates on Boeing’s inventory of undelivered B737 Max and B787 aircraft after December 2021, but we do not believe they have changed materially from 335 and 110 respectively. This is because Max deliveries of 86 in Q1 2022 were broadly in line with aircraft produced, and because there were no B787 deliveries production is very low.
Although the B737 max has successfully resumed production it still faces challenges. It has yet to be recertified by the Chinese authorities although this is expected to be resolved soon. Also, there is effective FAA certification deadline at the end of 2022 for the new B737 Max 7 and B737 Max 10 variants. If Boeing fails to meet this deadline these aircraft will have to be redesigned to add a new emergency alerting system, which would lead to delivery delays.
Boeing has also had quality and production problems with the B787, its main passenger twin-aisle product (nearly all B747, B767 and B777 deliveries are freighters or tankers) and has suspended deliveries since May 2021. Boeing is working with the FAA on certification issues and deliveries are expected to resume in 2022 but there is no firm guidance on timing.
Finally, it has been reported that entry into service for the B777X has been pushed back by a year until early 2025 because of certification difficulties with the FAA.
There has been no significant change in production levels of other aircraft manufacturers apart from the winding down of the CRJ programme.
Airline Industry Financial Performance
IATA’s most recent October 2021 financial forecast shows the airline industry returning to a near breakeven in 2022. North America is set to be the first region to move back into profit and Europe is forecast to be the next best performer on an EBIT Margin basis. Europe’s relative performance is much better than in 2021 due to positive impacts of its Covid passport scheme and the re-opening of North Atlantic travel. We anticipate another forecast will be released by June 2022 and the most likely change will be a downward revision in the outlook for the Asia Pacific region due to the impact of renewed lockdowns in China.
So far in 2022 airline shares have slightly outperformed the overall market. Since 2020 airlines have not recovered in line with the overall market because of the need to issue new stock to repair their balance sheets. This process is under way, with a recent announcement by Air France-KLM of its plan to sell €2.26BN of new shares following similar news from Air Asia, Air New Zealand, American Airlines, easyJet, El Al, Flyr, Garuda, Lufthansa and TUI.
The major airline credit event in Q1 2022 was obviously the effective confiscation of aircraft leased to Russian airlines by western lessors. Most of these lessors had taken out contingency insurance which they  believe provides full or partial financial compensation for their losses. However, those lessors who have reported since Russia’s invasion of Ukraine are writing off their net Russian exposure before any such compensation because their claims will be contested by their insurers and the timing of any resolution is uncertain.
For the most part Russian airlines are still operating these aircraft, but over time their ability to do so will be reduced by their lack of access to spare parts. This can be temporarily offset by cannibalisation of some aircraft, but the longer the current situation prevails the less likely it becomes that repossession provides an adequate remedy for the lessors even if it were possible. This is because it would be very hard to redeploy an aircraft outside of Russia without its records being in order, and this is unlikely to be the case where widespread cannibalisation has occurred.
The impact of Russia’s actions has been very owner specific as there has not been a significant increase in available aircraft - according to IBA only 32 of 514 aircraft in Russia before the invasion have been returned.
We have not been able to identify any significant airline failures outside Russia since the start of 2022. The largest was CGA Airlines of Colombia which never operated more than four aircraft. According to the aviation consultancy Ishka the number of airlines in bankruptcy/restructuring reduced from 17 in January to 10 in May with 701 aircraft affected[2]. Large airlines to recently emerge from bankruptcy/restructuring include Aeromexico, Avianca, CSA Czech Airlines and HNA Group.
Special Topic - Why are Twin Aisle Aircraft Production Rates So Low?
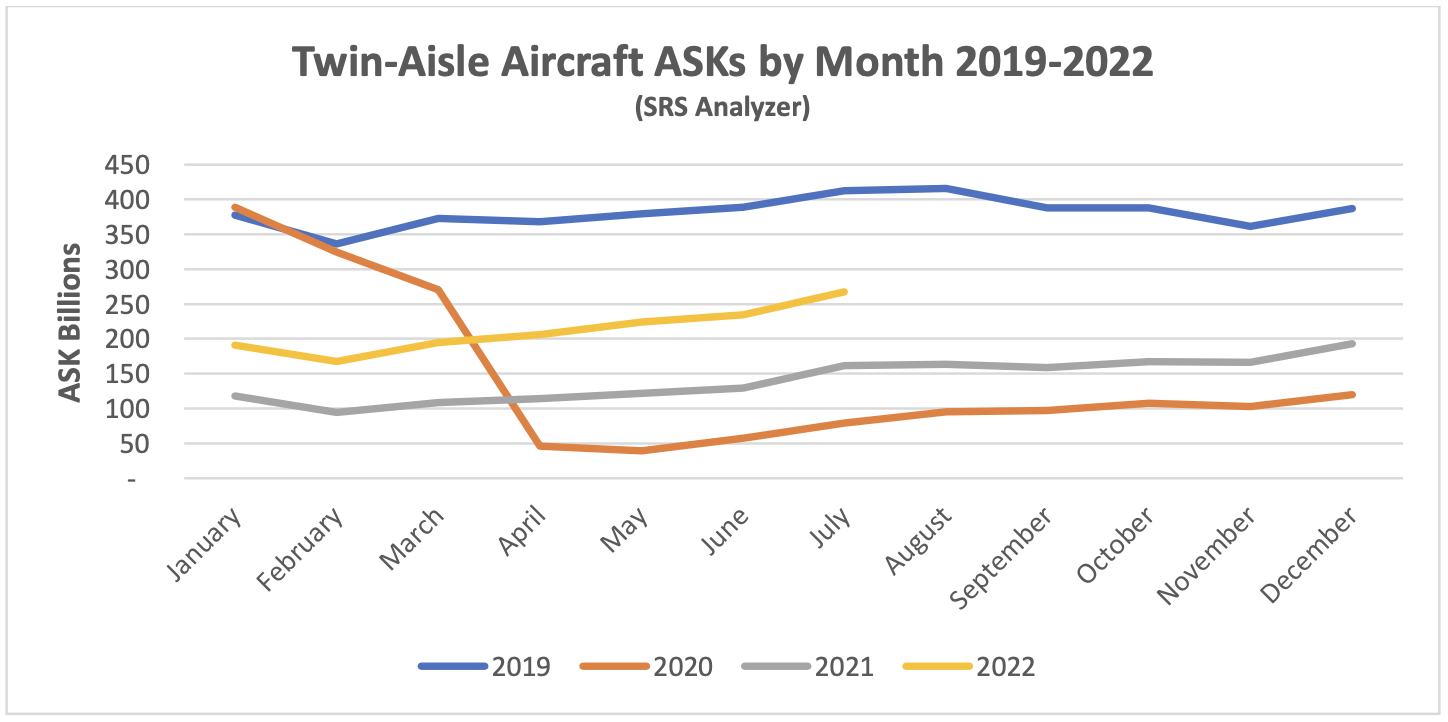
As discussed above Airbus are planning to increase A320 family production to record levels in the next few years and a big recovery in B737 Max deliveries is also very likely. The production outlook is very different for twin-aisle aircraft where the combined production targets for Airbus and Boeing are c. 180 aircraft a year, less than half the peak of c. 400 aircraft a year achieved from 2015 to 2019.
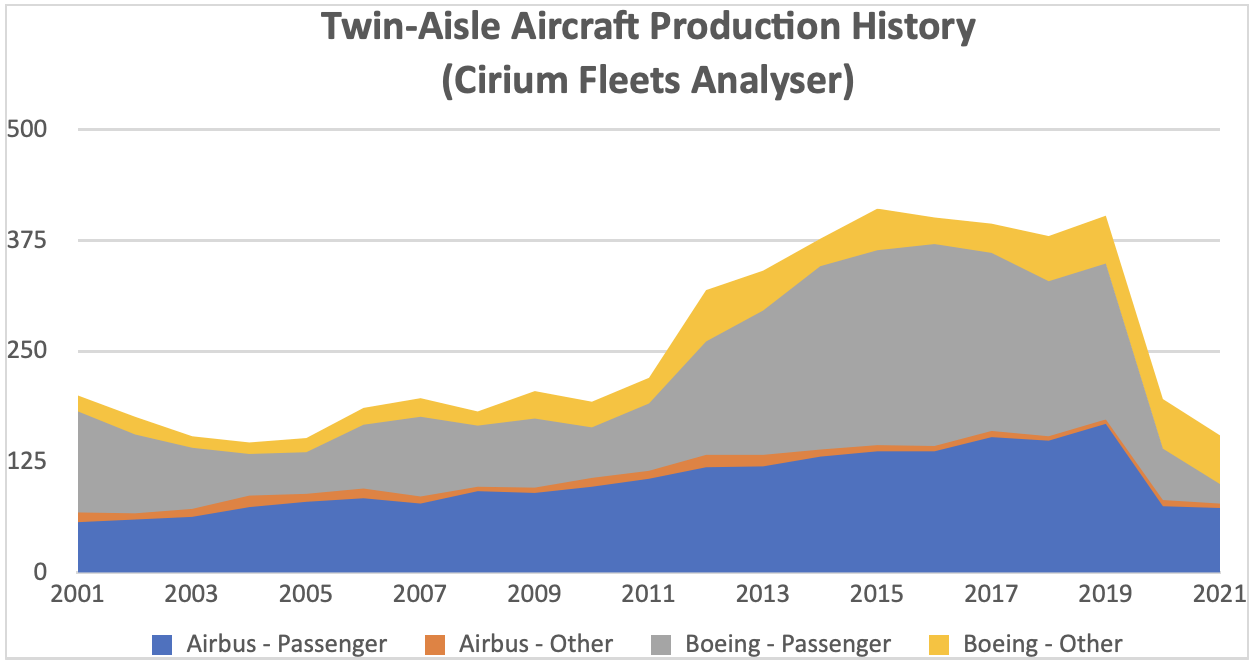
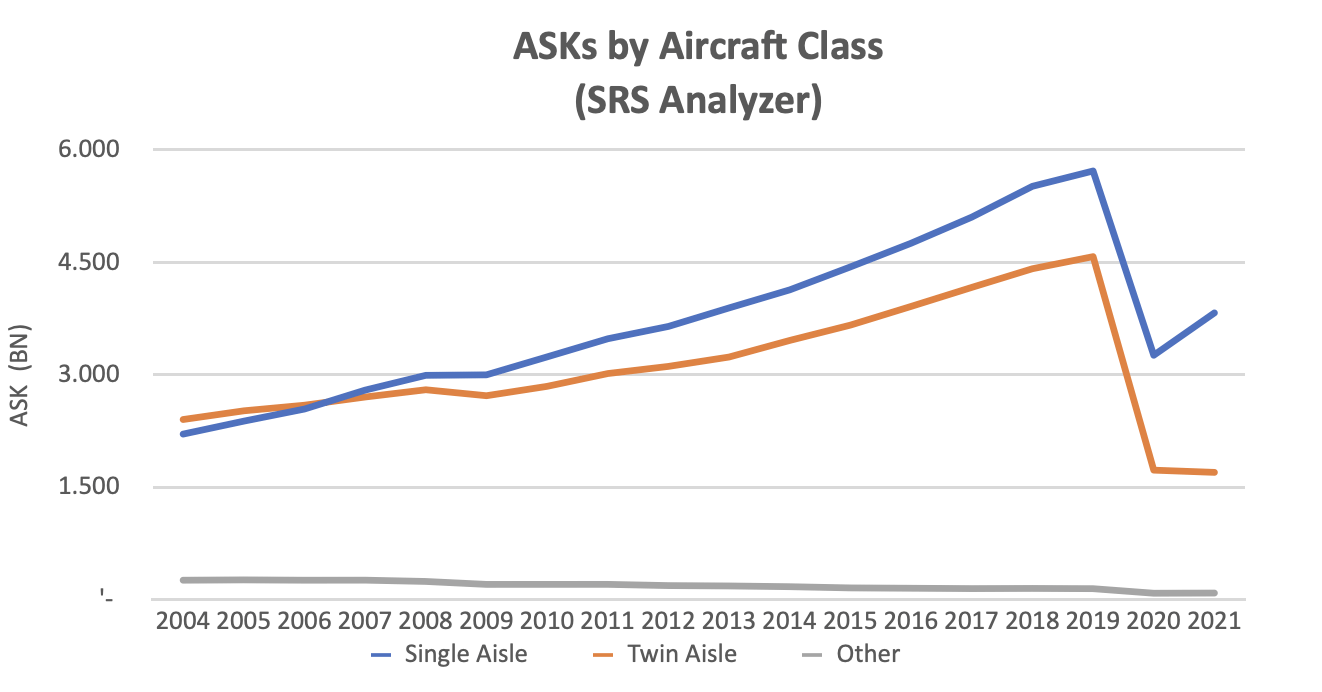
One important reason for this relative weakness is lack of demand. We have airline schedule data for ASKs back to 2004 from SRS Analyzer which shows a marked trend towards an increased share of capacity for single-aisle aircraft throughout this period. Part of this increase in single-aisle aircraft capacity came at the expense of smaller aircraft such as 50-seat jets and Turboprops included in “Other”, but the main source was twin-aisle aircraft.
Airlines will tend to replace twin-aisle aircraft with single-aisle where possible because they are cheaper and have better revenue potential. Cost savings are mainly driven by lower capital cost per seat as single-aisle aircraft do not have the structural enhancements to carry the additional fuel required for long-haul flights. Fuel costs per seat are similar and so are crew costs, because the larger seat capacity of twin-aisle aircraft is offset by higher cockpit crew salaries. Revenue potential is better because a smaller aircraft can profitably serve thin routes that would not be economic for a larger aircraft, and also a smaller aircraft can offer greater frequency on busy routes which is particularly attractive to business class passengers.
The obstacles to deploying more single-aisle capacity are range limitations and airport congestion. Single-aisle aircraft have offered greater range over time which has allowed them to substitute for twin-aisle aircraft – a typical example of substitution is the US transcontinental market which would have mainly been served by B767s in the 1980s and 1990s, but thereafter moved towards B737NGs and A321s. The chart below shows the increase in single-aisle capacity share for different route lengths up to 2018 (we stopped at 2018 to avoid analytical “noise” as a result of the Max grounding and Covid).
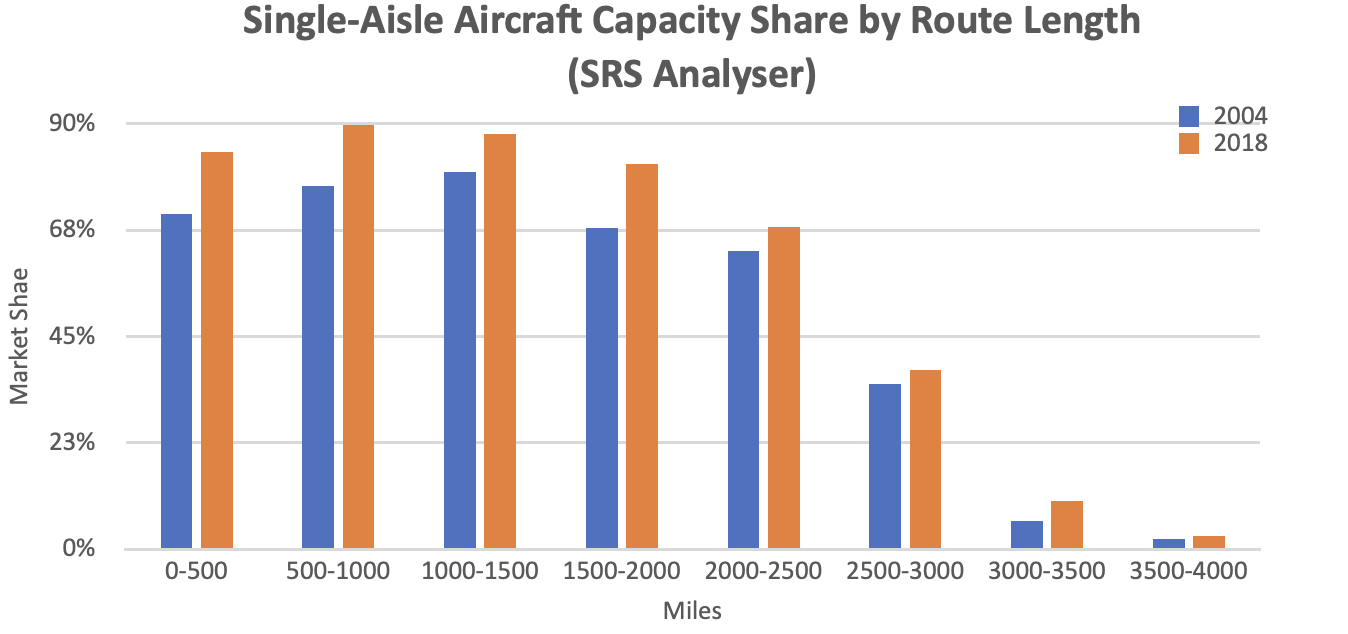
The successful introduction of the A321 Neo LR and A321 Neo XLR with ranges of 4,600 and 5,400 miles respectively and the greater range of other A320 Neo and B737 Max aircraft relative to their predecessors means that the trend towards more single-aisle capacity is likely to continue.
Airport congestion has proved to be less of a problem than anticipated in the past, partly due to increases in capacity but also because of the way airlines have developed their networks. The greater emphasis on point to point rather than hub and spoke networks has both reduced the pressure on hub airports and provided a better service to passengers. There are still routes where capacity constraints dictate the use of twin-aisle aircraft of short haul routes such as Beijing – Shanghai, but these are increasingly unusual cases.
We believe there is also an issue with the long-run supply of twin-aisle aircraft which is driven by the improved service life performance of long-range twin-engine types[3] (“LRTEs”). The most common way to measure service life is by survival curves. These curves show the percentage of passenger aircraft remaining in passenger service by age. Ultimately aircraft leave passenger service by being retired or converted to another use, predominantly freighter. Before this point there can be routine temporary exits from service for maintenance or change of operator, or non-routine storage in a market downturn as experienced in 2020-2021.
Aircraft classes and individual types can have very different service life performance, particularly where they are subject to rapid economic obsolescence. The chart below shows survival curves for different passenger aircraft classes and highlights the impact of such obsolescence on early technology aircraft such as the B707 and DC8 and more recently 50-seat jets. It also shows that twin-aisle aircraft have under-performed relative to single-aisles because they have been more impacted by improvements in technology and changes in the type of aircraft required by airlines due to the developments in route structures described above.
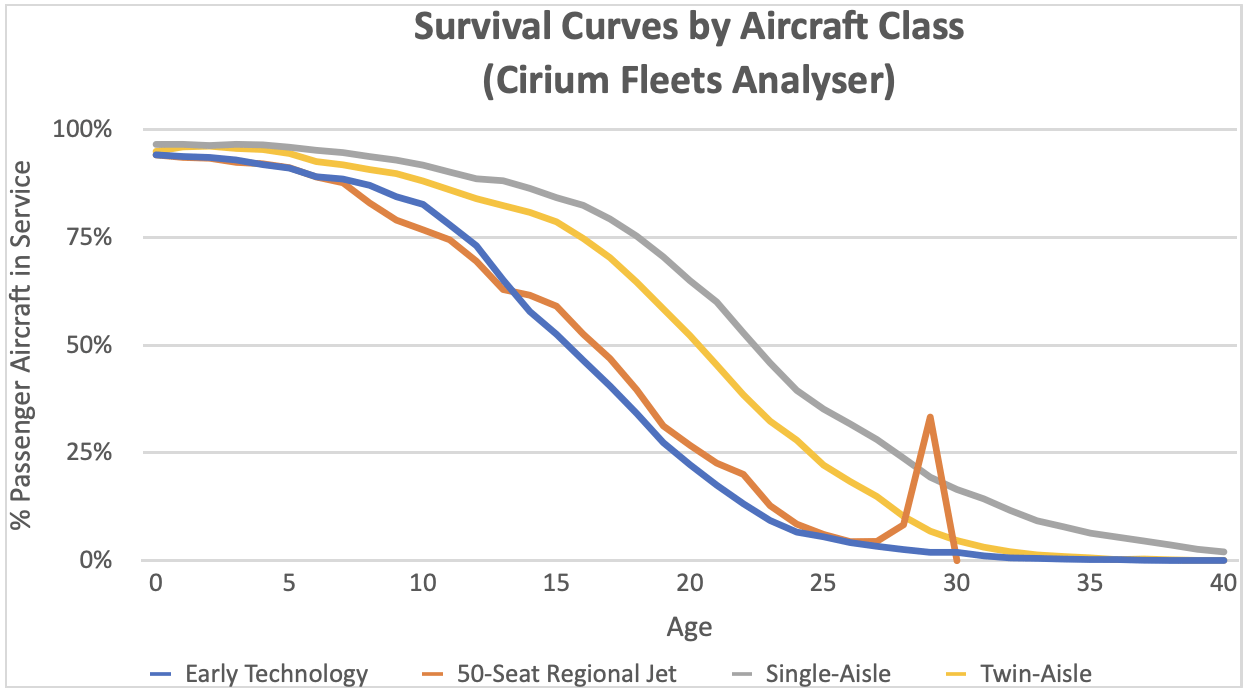
Survival curves are a key input for estimating future demand for new aircraft and in fact they are more useful than retirement age. There is a need to make subjective judgements in how to segment the available data as performance changes over time and allocating aircraft types to different classes should really group types with similar performance. For example, 50-seat jets perform very differently to other regional jets and the latter are more like larger single-aisle aircraft, so we segment on this basis. Also, all early technology types are single aisle but if you were to include them with their successors the resulting curve would be a poor guide to likely future performance by the modern types.
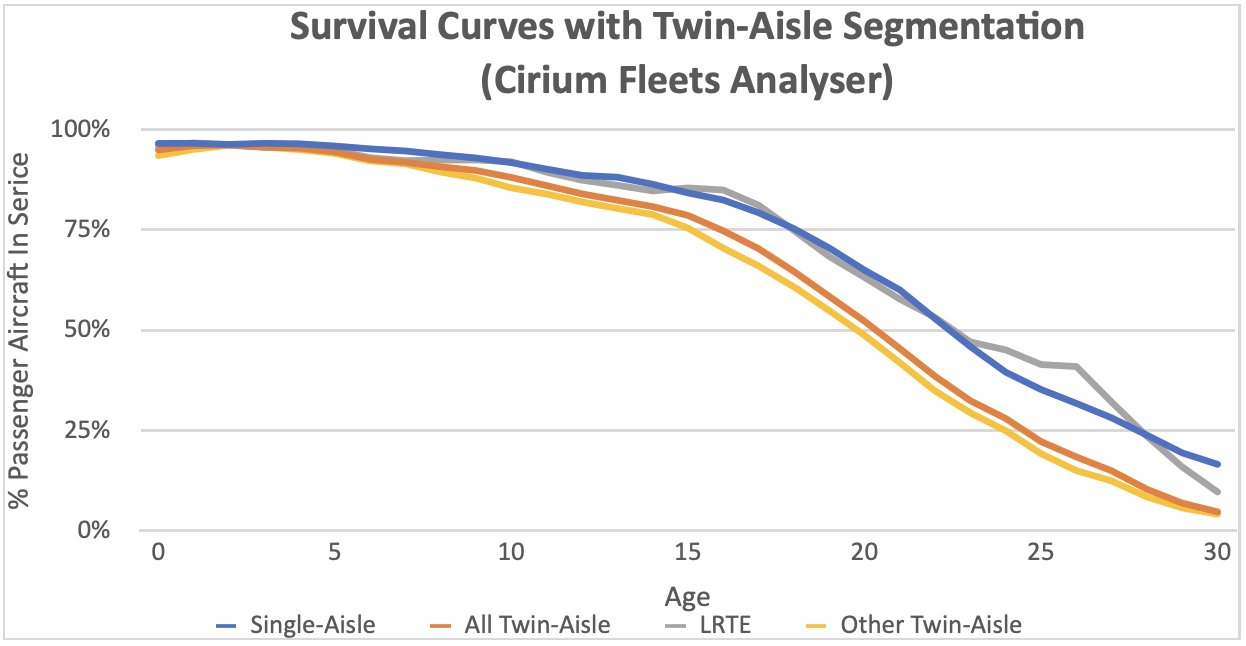
We suspect that demand for twin-aisle aircraft may have been over-estimated in the past because of an assumption that LRTEs would perform in line with other twin-aisle aircraft types. This was not an unreasonable assumption given that there was very little data to go on. However, with the benefit of hindsight there were good reasons why their performance would be different:
- A twin-engine aircraft in inherently cheaper to operate than a three or four engine aircraft
- Greater range allows an aircraft to serve routes that are not subject to single aisle competition
- Most LRTE types are 300 seats or less which fits better with point-to-point route structures.
The chart below segments the performance of LRTEs vs other twin aisle aircraft types and shows their performance is much stronger. While this is ultimately good news for owners it does mean that future demand for new aircraft is likely to remain subdued. This analysis helps to explain why it was very hard for lessors to place twin aisle aircraft in 2019 before Covid arrived. Our proprietary forecast model showed minimal excess capacity in the twin-aisle market without segmentation of in-service performance, but a large surplus with it. We believe that current and planned production rates are low enough that this surplus will be eliminated over time, but it will be a while before we see 400 twin-aisle aircraft delivered in a year.
Disclaimer
This document is for informational purposes only. It is not intended as advice or a recommendation with respect to any transaction. The recipient of this document shall be solely responsible for making its own independent investigation and appraisal of any transaction. No market or company data or other information is warranted or guaranteed by Sirius Aviation Capital as to its completeness, accuracy, or fitness for a particular purpose, express or implied, and such data and information are subject to change without notice. Any comments or statements made herein reflect the assumptions, views, and analytical methods of the persons that prepared this document as of its date of preparation, and do not necessarily reflect the views of Sirius Aviation Capital. Sirius Aviation Capital may have issued, and may in the future issue, other communications that are inconsistent with, and reach different conclusions from, the information presented herein. Sirius Aviation Capital specifically disclaims any obligation to update this document, or any comments or statements contained herein.
[1] ASKs is the acronym for available seat kilometres, which is the product of the number of seats flown and distance flown.
[2] Fleet totals are based on data as of January 2020.
[3] These aircraft types are the A330-200, high gross weight variants of the A330-300, A330 Neo, A350, B767-200ER, B767-300ER, B777-200ER, B777-300ER, B777LR and the B787.

Industry Review Q4 2021
• Macro-Economic Background
• Traffic and Aircraft Demand
• New Aircraft Supply
• Airline Industry Financial Performance
• Special Topic – Aircraft Leasing Industry Consolidation
Macro-Economic Background
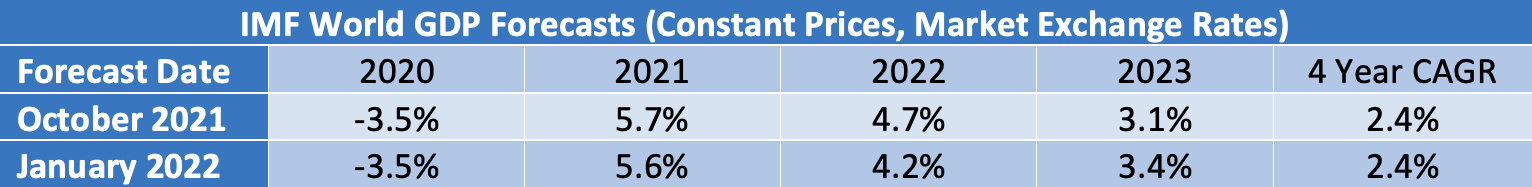
The tone of the IMF’s latest world economic forecast is rather downbeat. The headline reads” Rising Caseloads, a Disrupted Recovery, and Higher Inflation”. However, their revised forecast shows no material change in the overall four-year compound annual growth rate from 2020 to 2023, with reductions in 2021 and 2022 being offset by a stronger recovery in 2023. The increase in general inflation may present an opportunity for airlines to pass on some increased costs such as higher fuel prices.
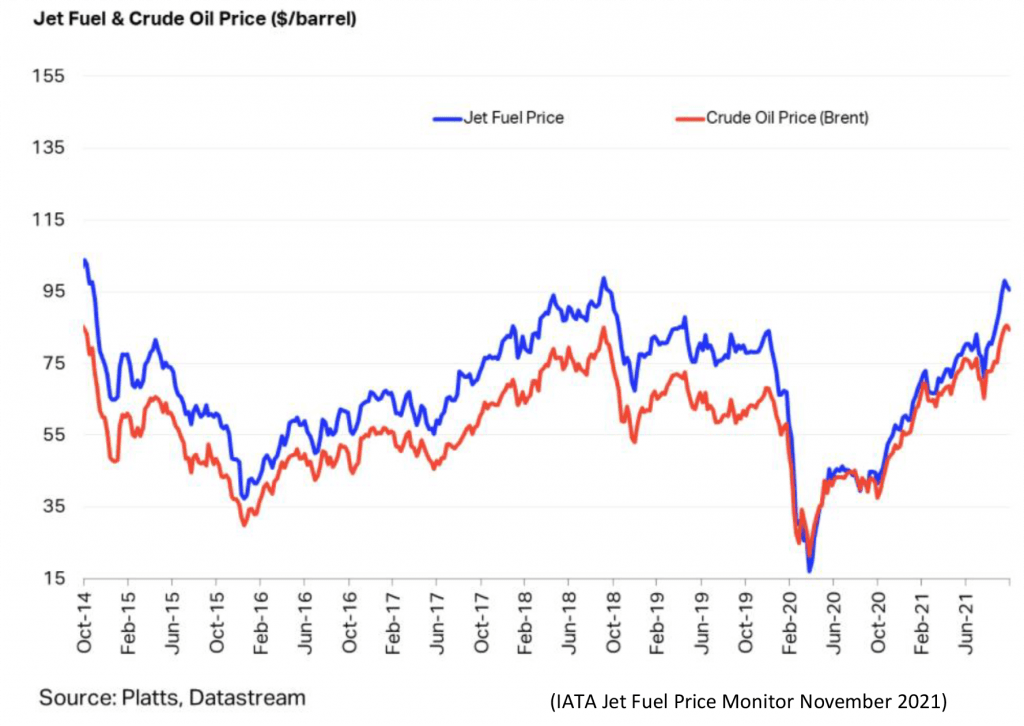
The price of jet fuel continued to increase in Q4 2021, driven by the increase in the price of crude oil and by the return of the “crack spread”[1] to more normal historical levels. Today’s price is a little higher than in 2018, which was a good year for the airline industry, so the current price is not an existential threat. However, it will reduce the airlines’ financial flexibility and at the margin will encourage them to prioritize profit margins over traffic growth as it will increase their break-even load factor.
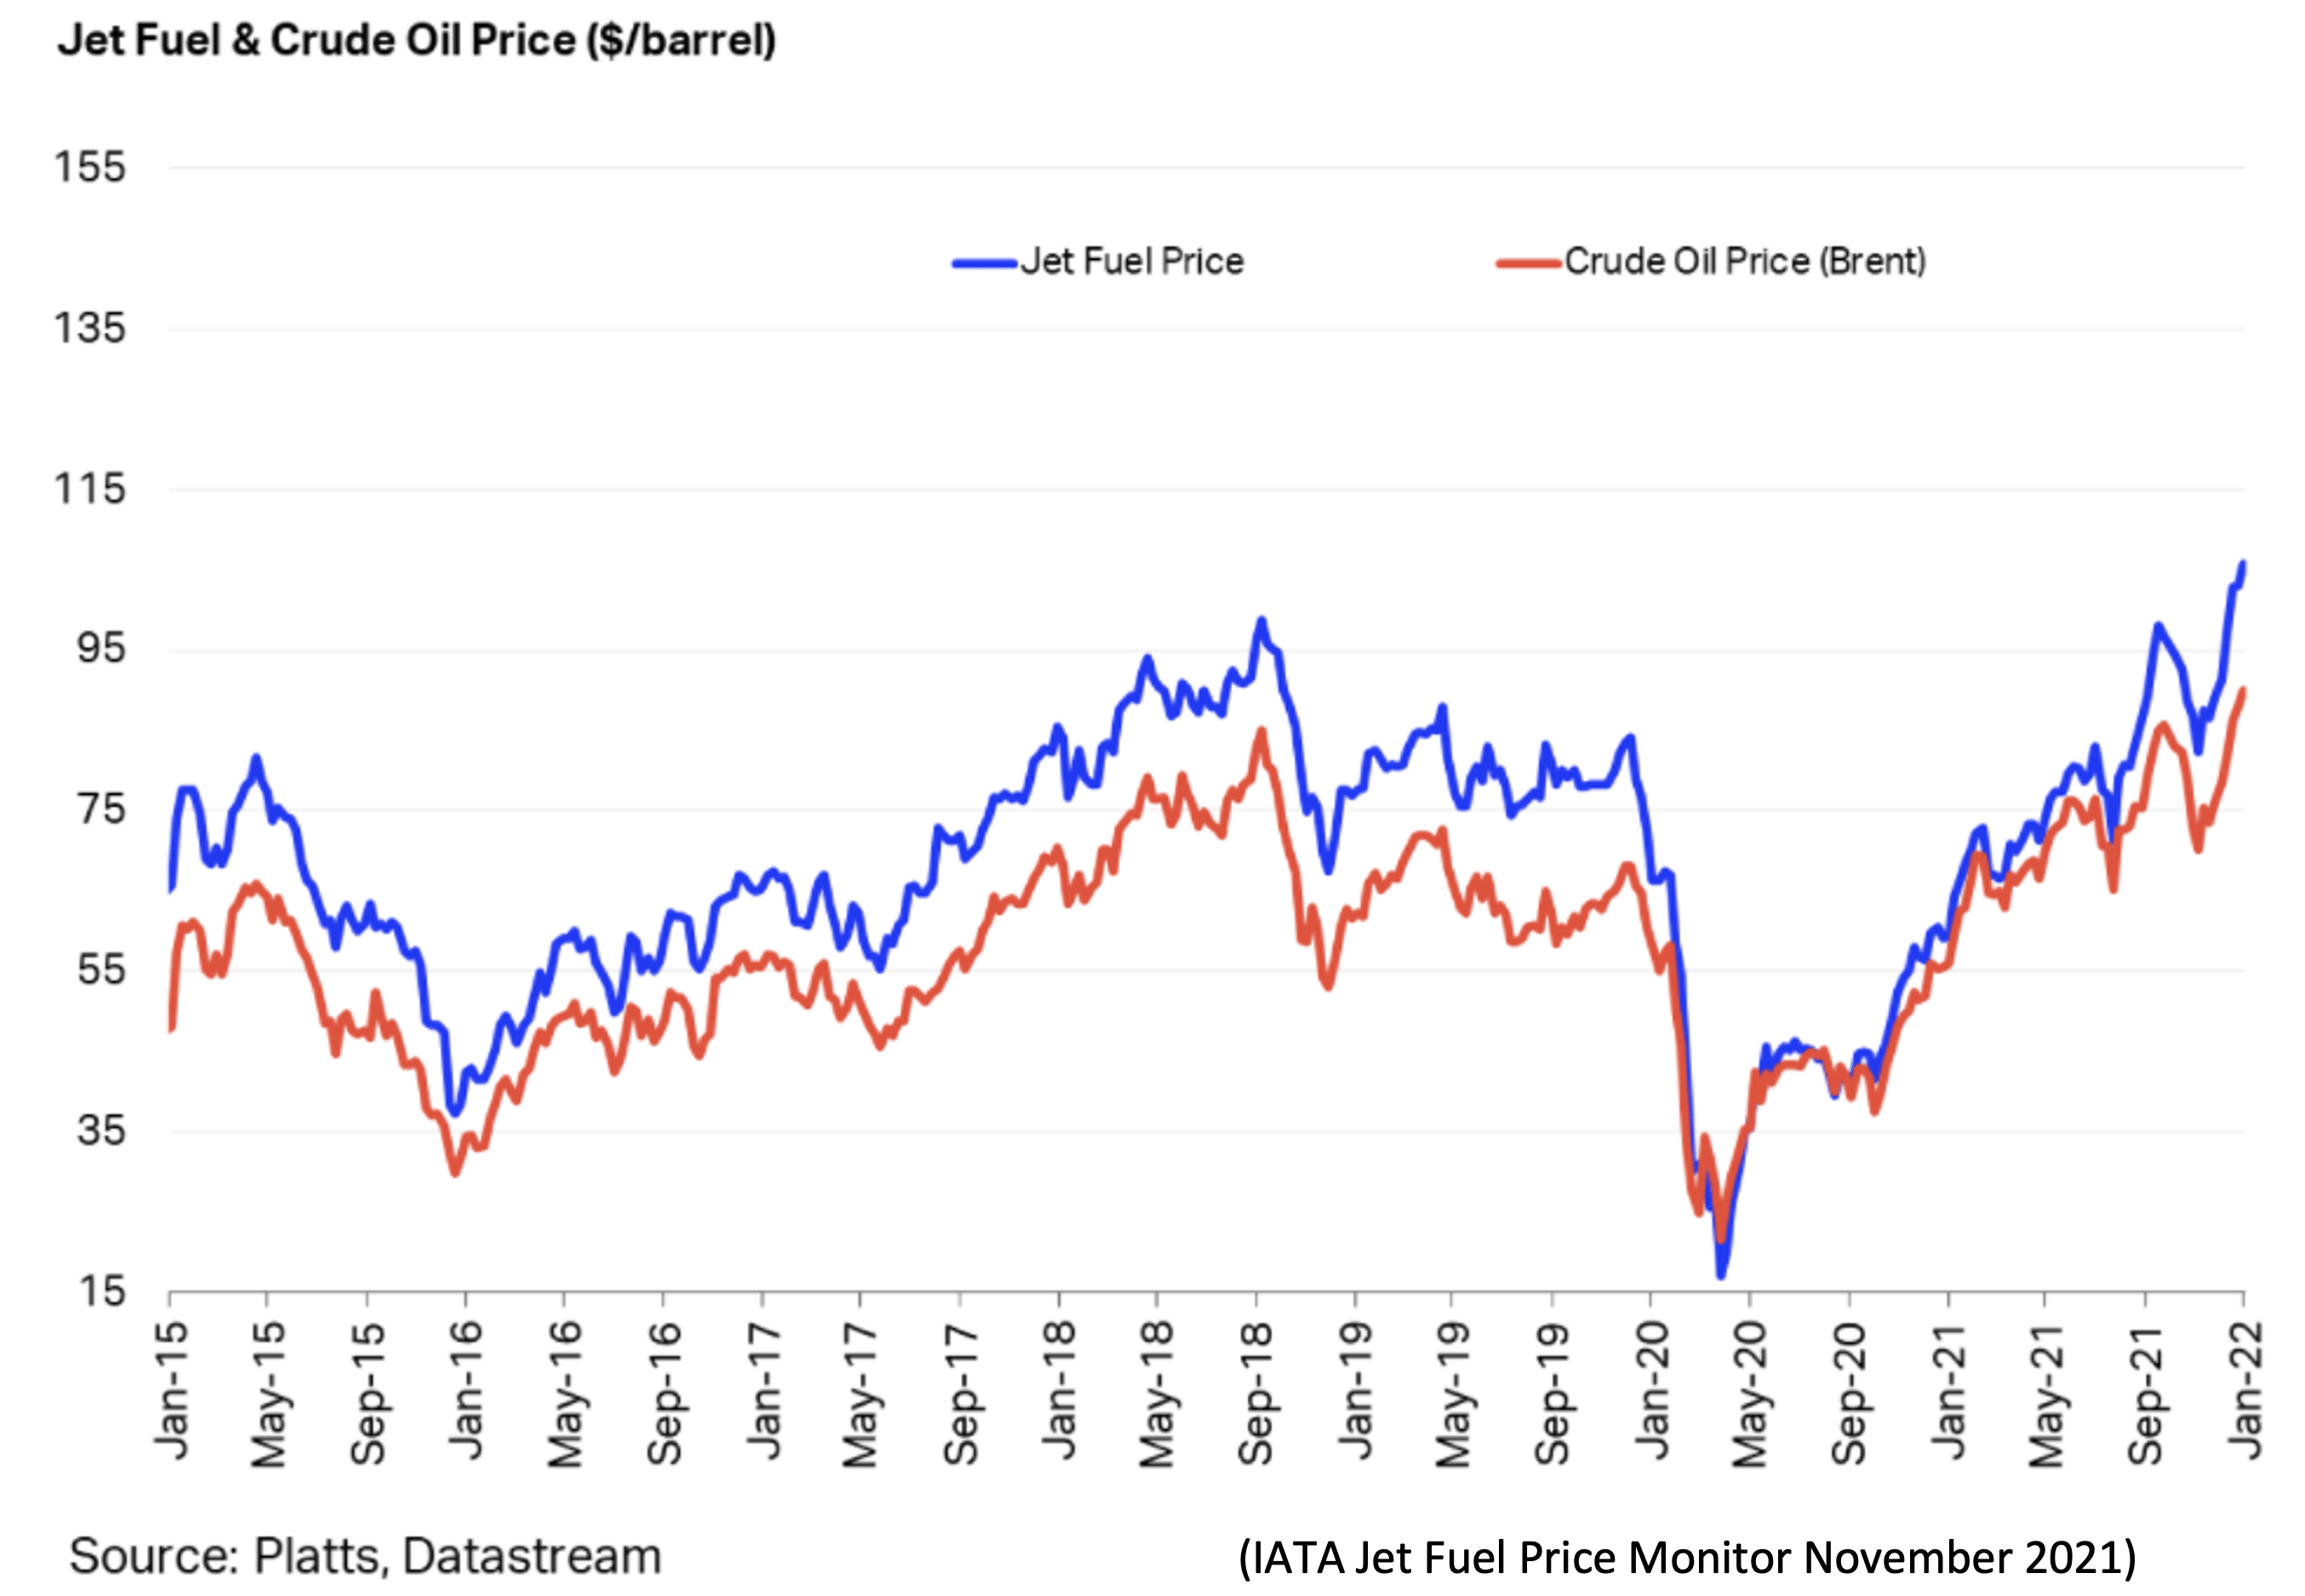
For airlines outside of the US this negative continues to be offset by a weaker US Dollar. This is a very important factor in airline financial performance because so many airline costs are typically US Dollar-denominated – not just fuel but also aircraft rents, debt service, aircraft, and spare parts.
Another indicator that is potentially important to aircraft investors is the breakeven inflation rate on US Treasury Inflation-Protected Securities (TIPS). This indicator measures inflation expectations and it matters because used aircraft values are strongly influenced by the cost of new aircraft and over time this cost is linked to US Dollar inflation. In the short term this linkage is driven by escalation clauses in aircraft purchase contracts and in the long term by the general input cost environment for the aircraft manufacturers. For this report we have compared the breakeven rate for 10-year and 5-year TIPS to highlight the differences in expectations for the two time horizons. The shorter time horizon has been more volatile, especially since the onset of the pandemic, but there is a strong overall correlation that suggests changed inflation expectations are not for a transitory “blip”.
Traffic and Aircraft Demand
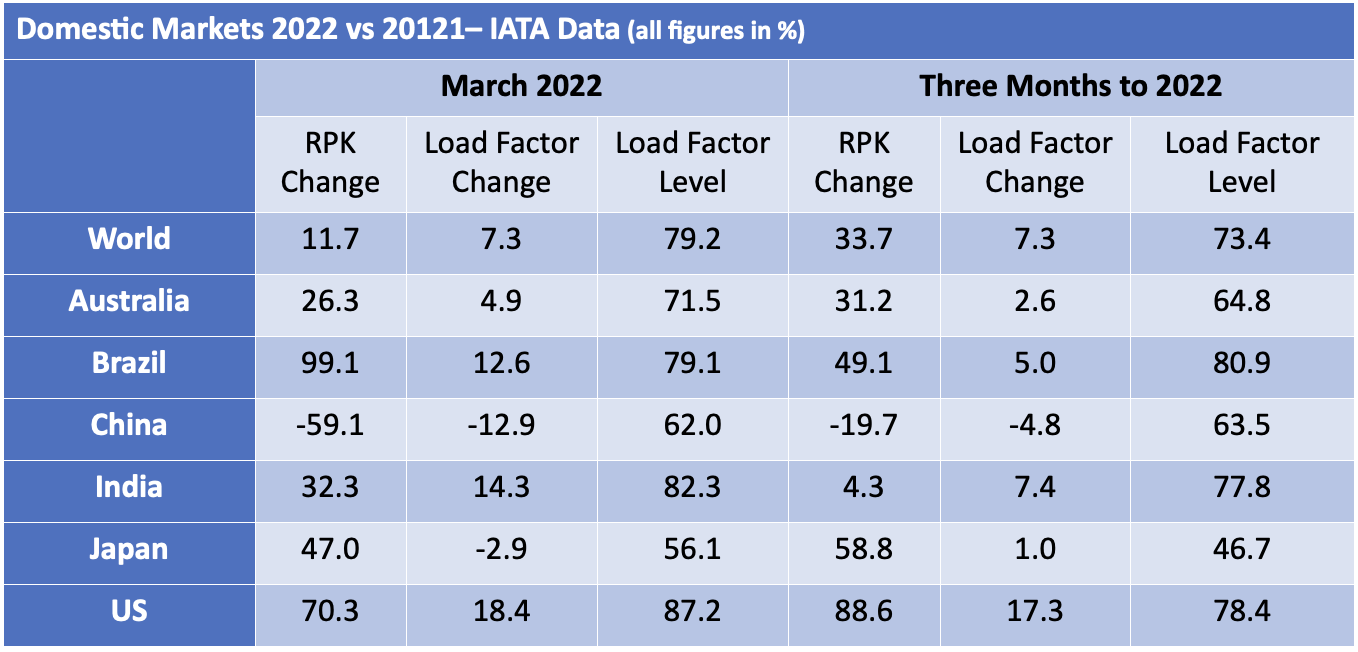
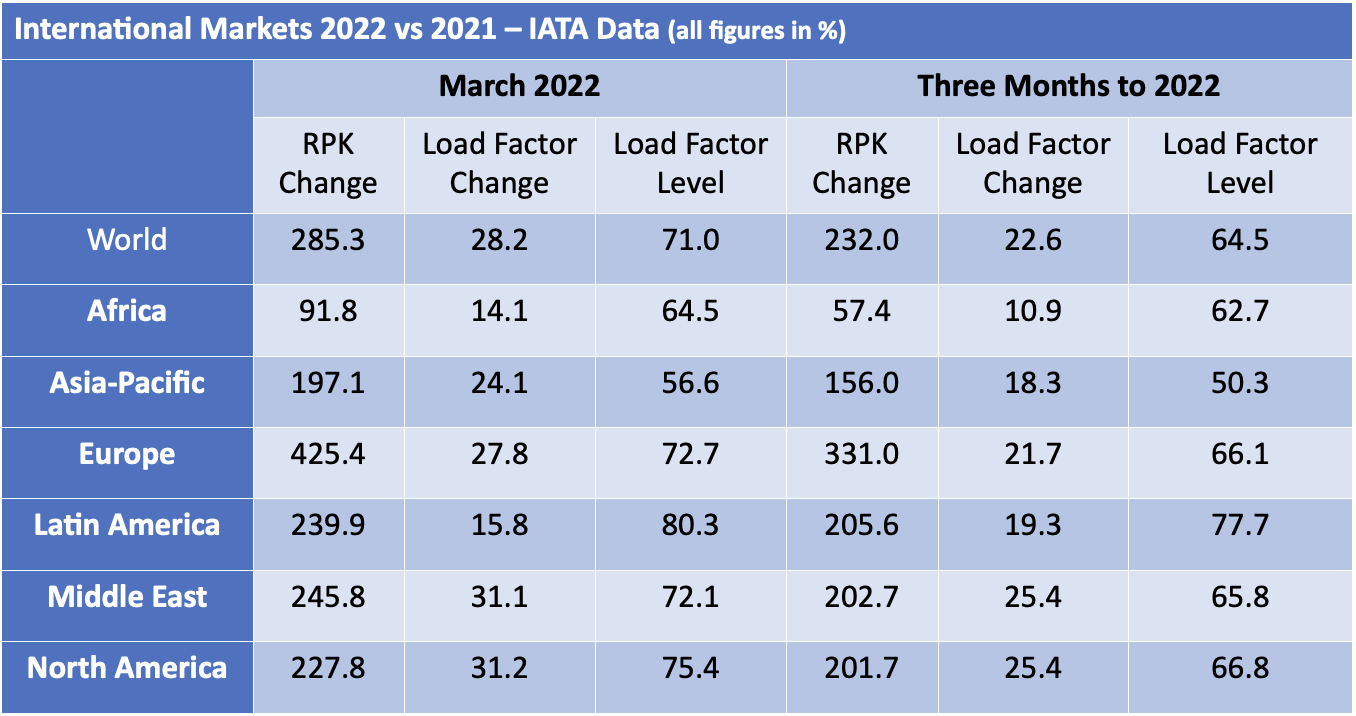
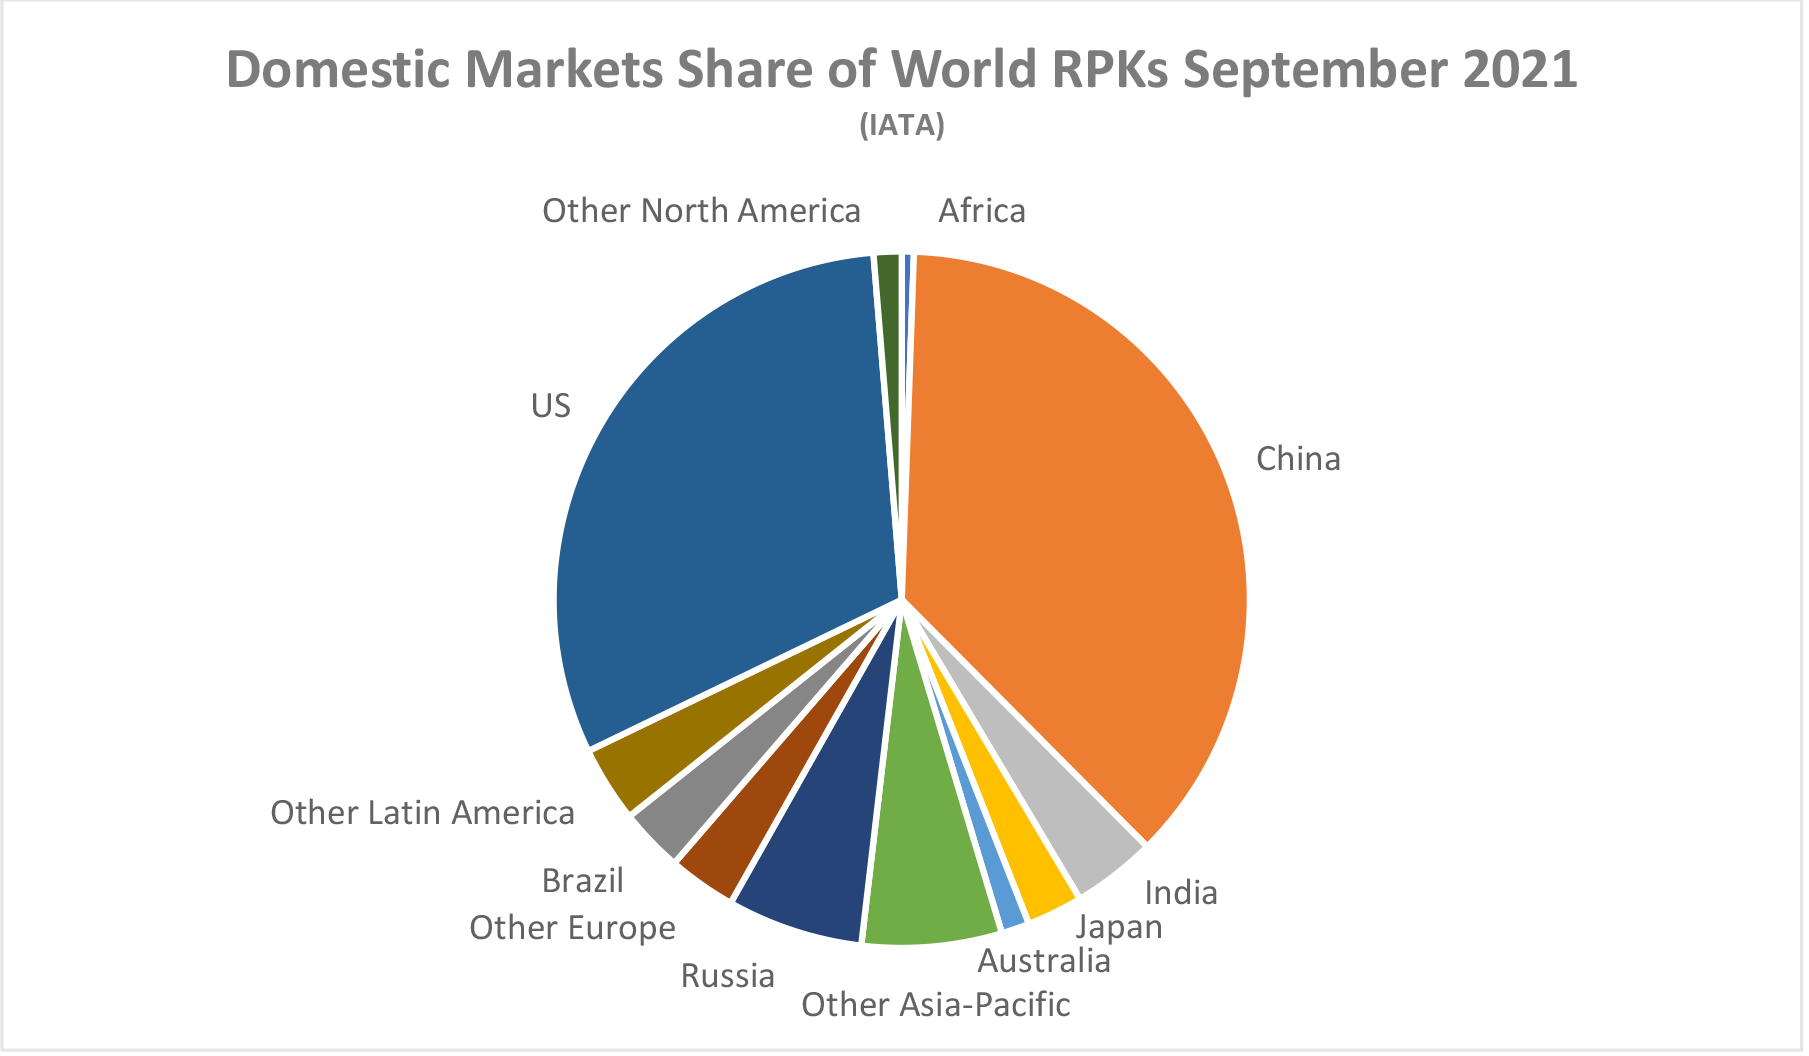
Recovery from the impact of COVID-19 remains slow and patchy. Global RPKs[2] for calendar year 2021 were down 58% vs 2019 compared to a 60% drop for the nine months to September. As the tables below make clear domestic traffic continues to outperform international by a large margin due to the greater impact of government restrictions on the latter.
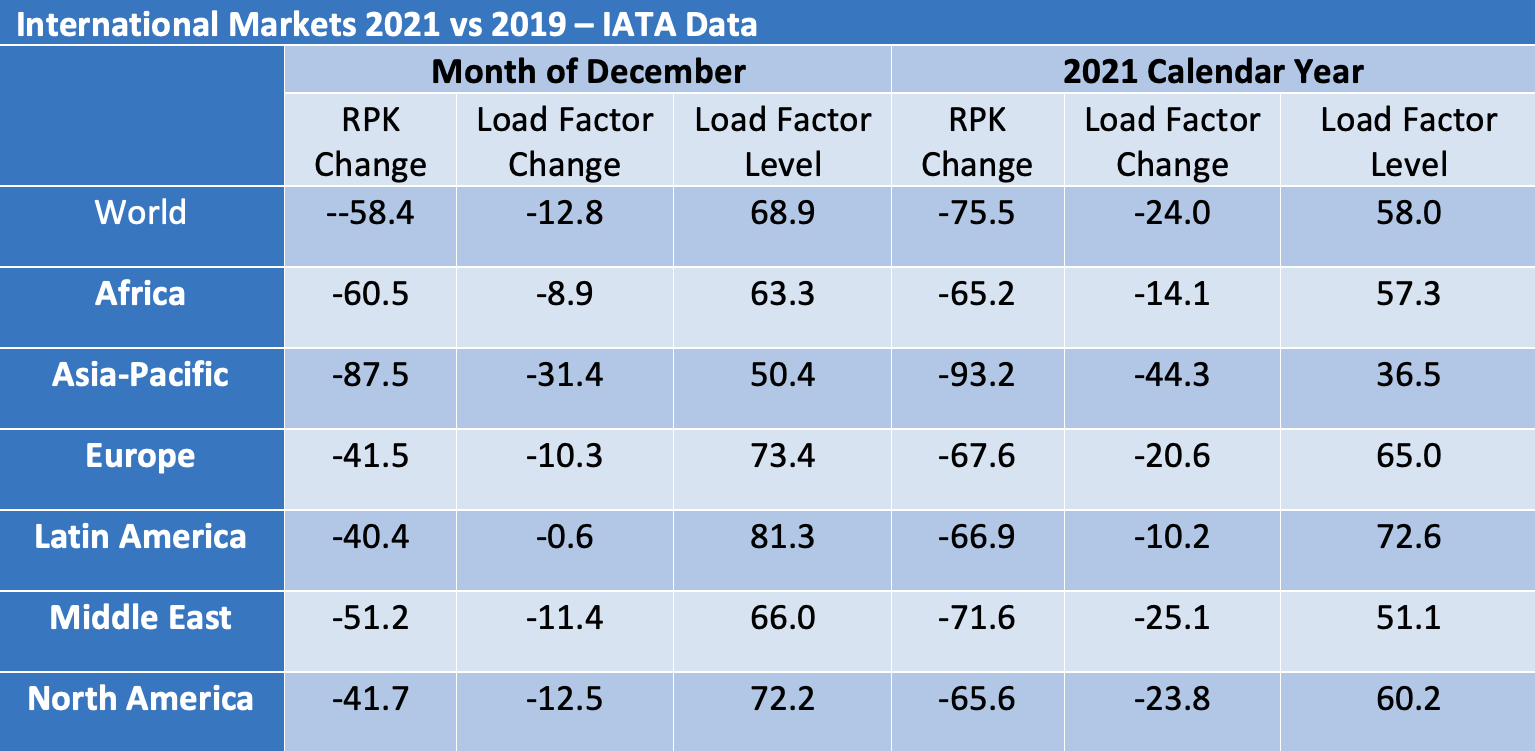
IATA reports changes in traffic and global market shares rather than actual values and reports domestic traffic on a different basis to international traffic by focusing on country rather than regional markets. The country focus becomes more understandable when one considers the 85% total domestic traffic accounted for by the seven countries listed separately.
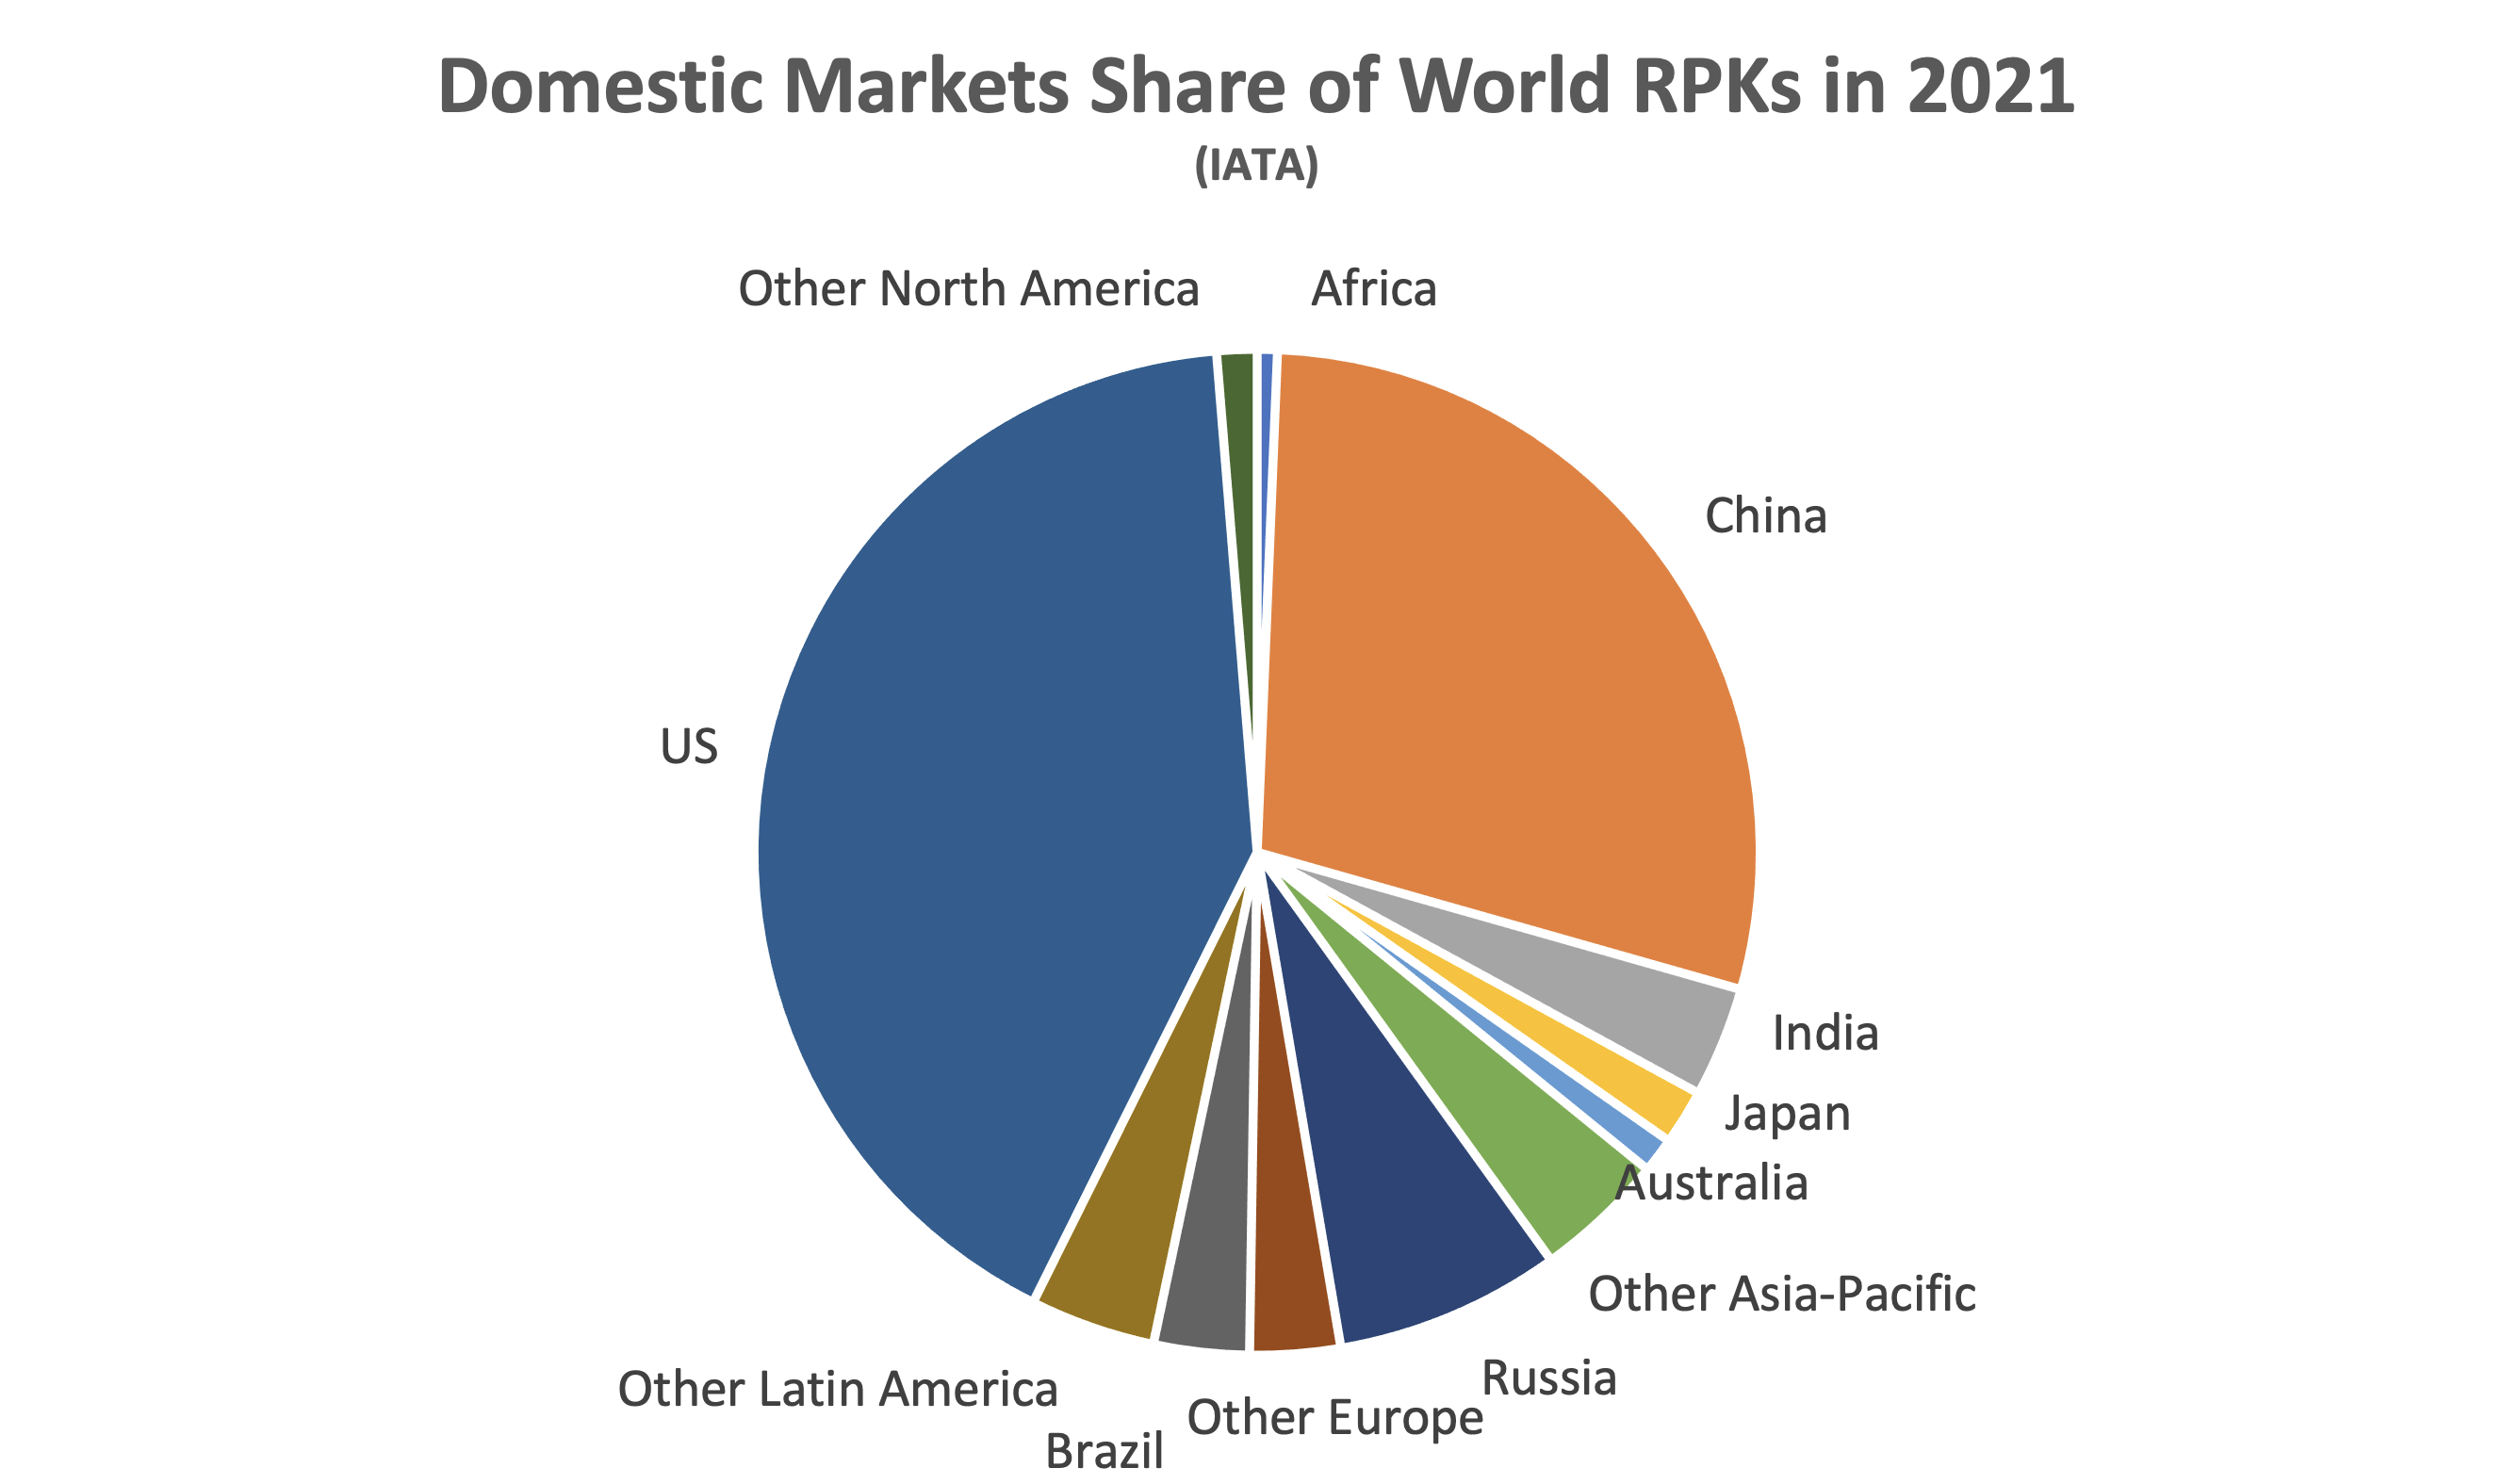
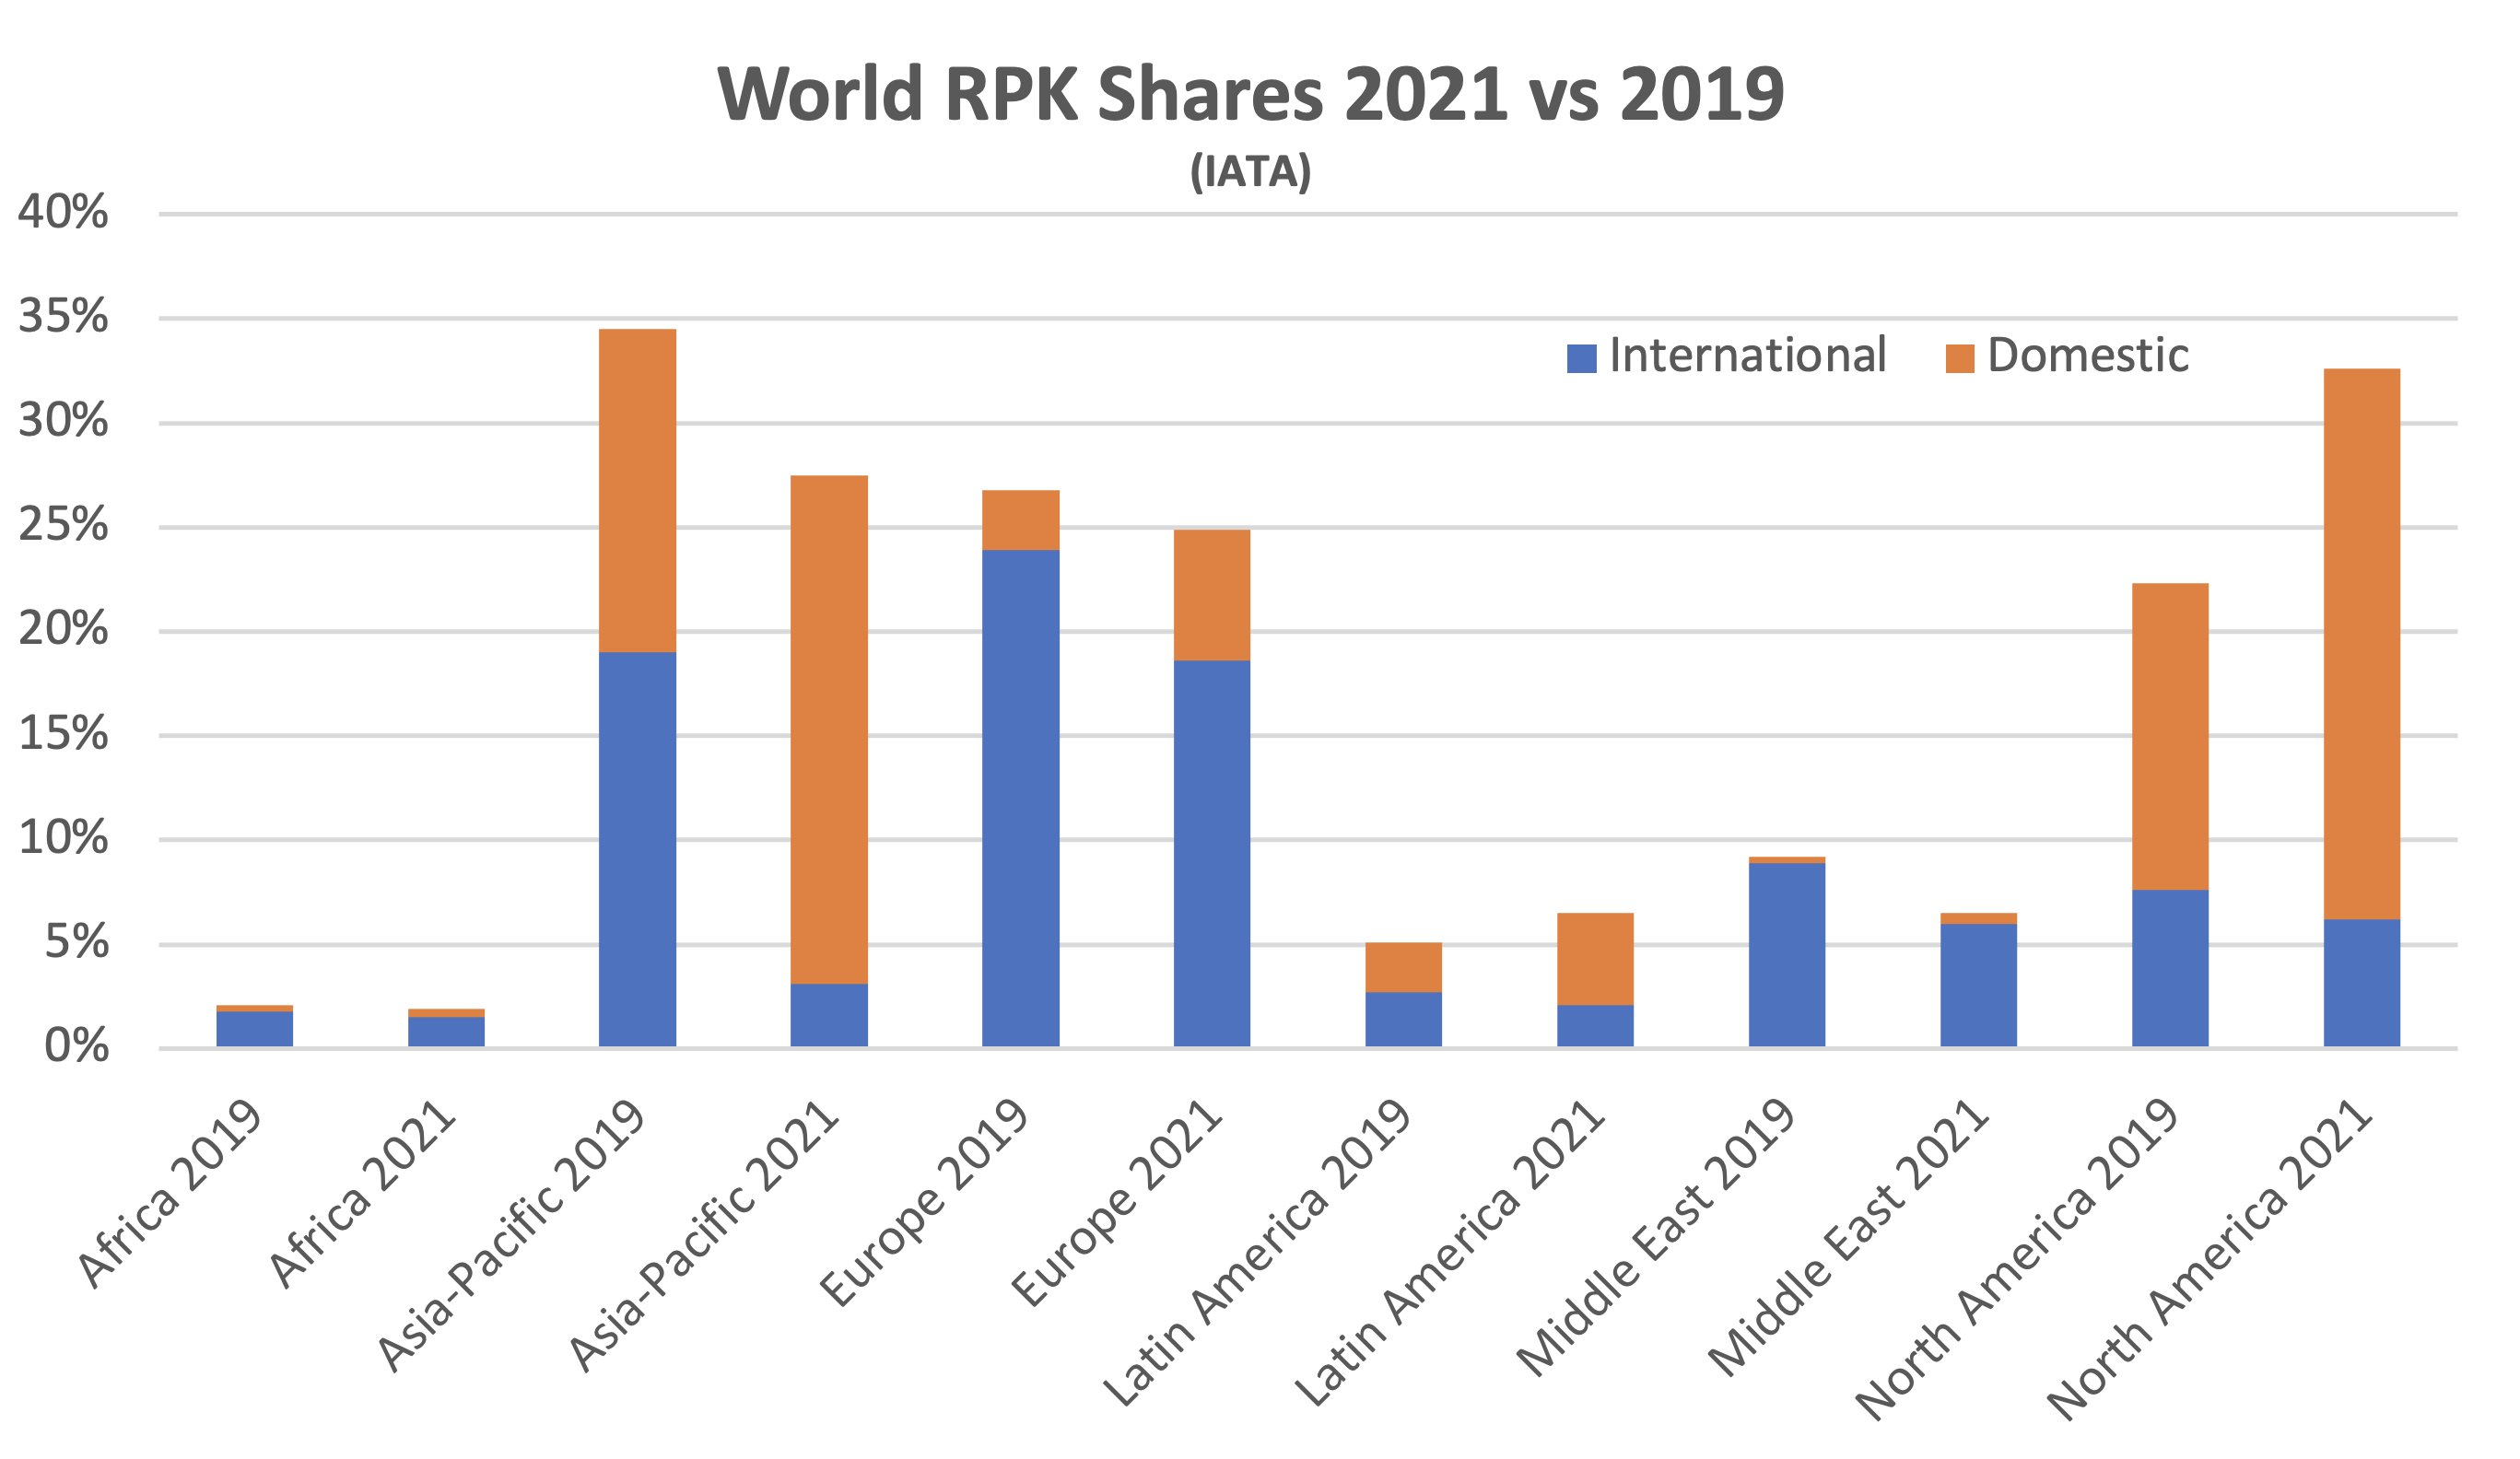
Although the breakdown of domestic traffic in 2021 looks similar to 2019, this is not true of the split between domestic and international traffic by region. Although domestic traffic has an increased share everywhere, the change is most dramatic in the Asia-Pacific region where international traffic has collapsed, and domestic Chinese traffic is most of what’s left.
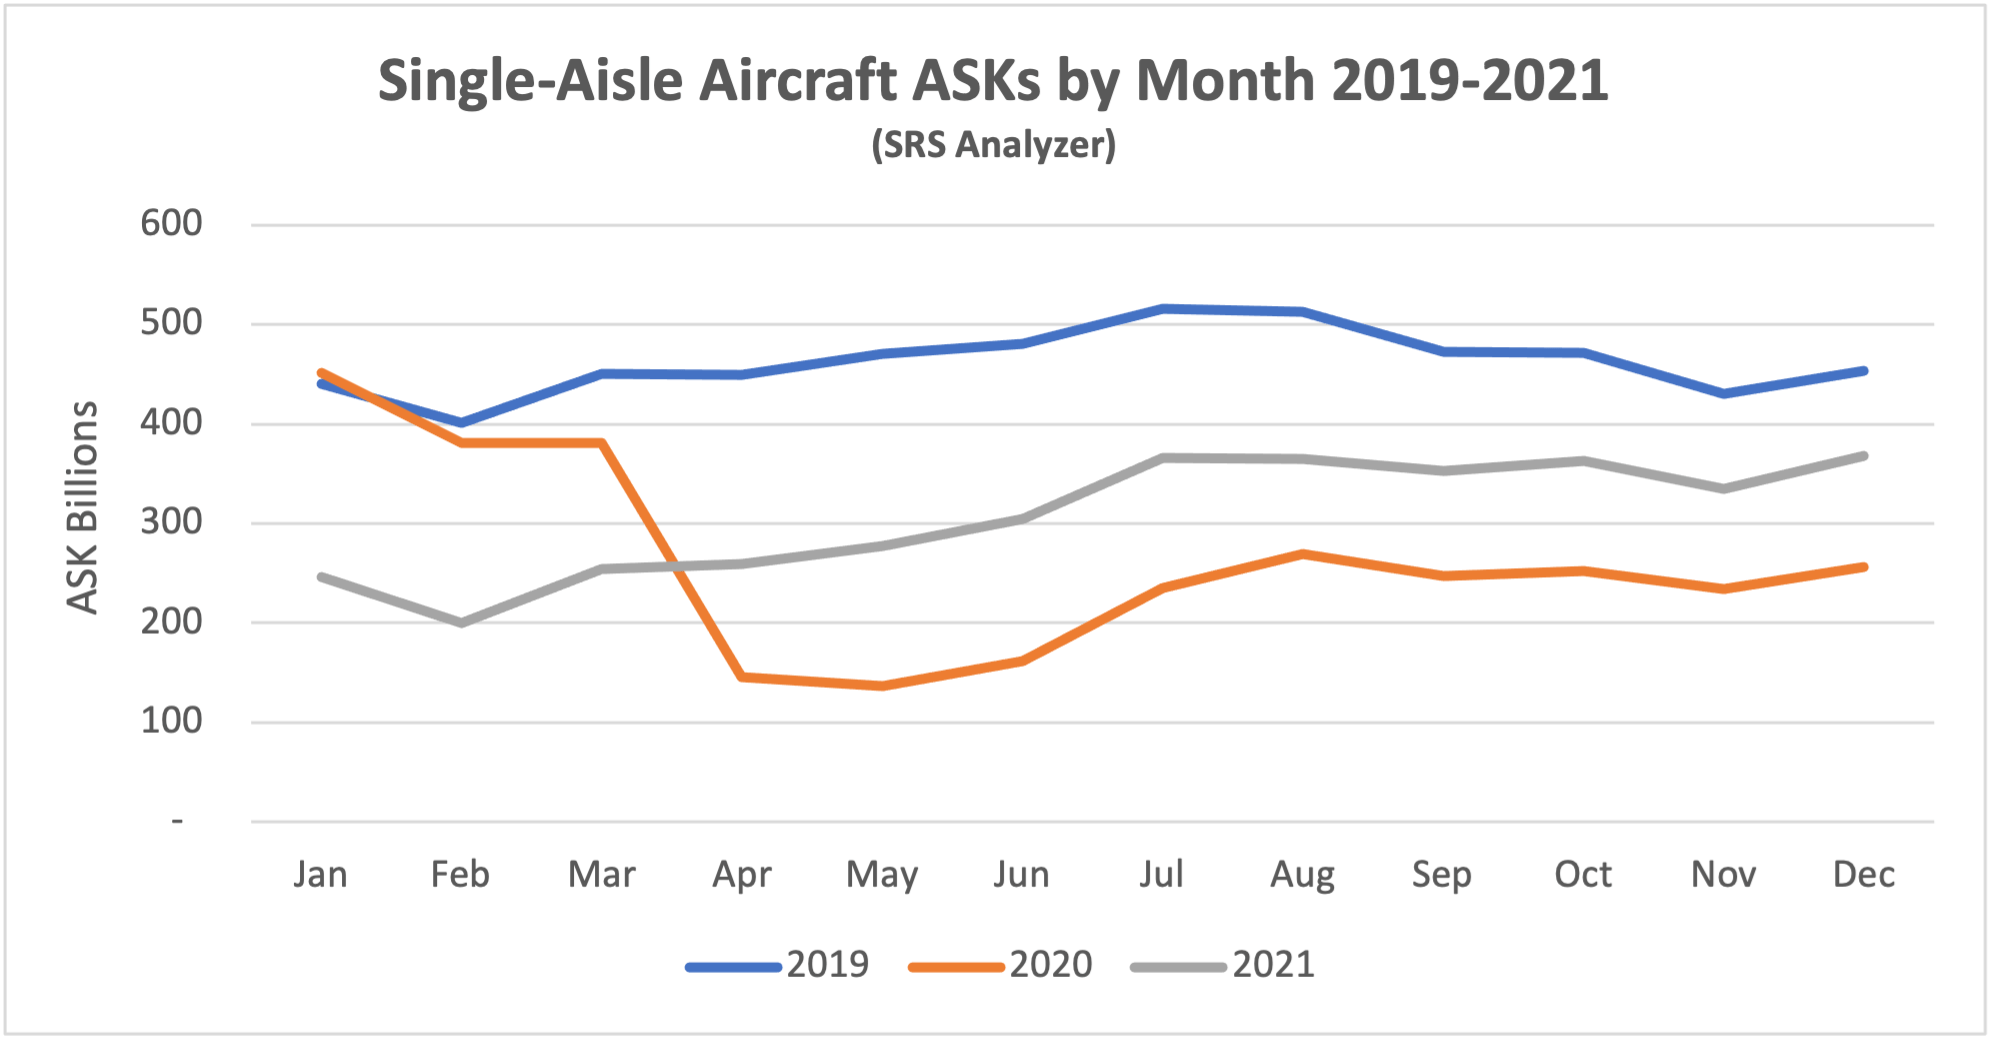
Although some short-haul aircraft serve international routes nearly all long-haul aircraft do so, and this is reflected in the relative demand for single-aisle (narrowbody) and twin-aisle (widebody) aircraft. Aircraft demand can be measured in terms of ASKs[3] and aircraft in service. ASKs have not declined as much as traffic because load factors have declined and aircraft in service have not declined as much as ASKs because aircraft utilization has declined. The airlines are clearly sweating their assets more since the middle of 2021 as the rates of growth in both ASKs and aircraft in service have both declined. This is probably due to a more stable market environment and the need to address rising fuel prices with greater asset productivity.
New Aircraft Supply
The latest status of Airbus’s production plans is:
Airbus is reported to have received objections from some of its major lessor customers after announcing that it is considering an increase in A320 family production to 75 aircraft per month in 2025. It is also believed that key members of its supply chain such as some engine manufacturers are not enthusiastic. One might speculate that Airbus is testing the waters with some of its key stakeholders and signalling that intends to maintain its lead in the single-aisle aircraft market.
The latest status of Boeing’s production plans is:
Boeing’s inventory of undelivered B737 Max aircraft fell from 425 at the end of 2020 to 335 in 2021. This lower inventory includes aircraft manufactured since Boeing resumed production in late 2020. This is probably due to a combination of delivery bottlenecks and delays in recertification in some jurisdictions, notably China. Inventory is expected to clear by 2023. Boeing is producing 26 aircraft per month and says it is on track to meet its target of 31 aircraft per month in early 2022. Management is considering further production increases but are wary of potential supply chain issues and expects to deliver 500 B737 Max aircraft in 2022.
Boeing has also had quality and production problems with the B787, its main passenger twin-aisle product (nearly all B747, B767 and B777 deliveries are freighters or tankers) and has suspended deliveries. At the end of 2021 Boeing had 110 B787s in inventory, up from 80 in 2020. Deliveries are expected to resume in 2022 but there is no firm guidance on timing.
There has been no significant change in production levels of other aircraft manufacturers apart from the winding down of the CRJ programme.
Airline Industry Financial Performance
IATA’s October 2021 forecast shows the airline industry returning to a near breakeven in 2022 after another very difficult year in 2021. North America is set to be the first region to move back into profit and Europe is forecast to be the next best performer on an EBIT Margin basis. Europe’s relative performance is much better than in 2021 due to positive impacts of its Covid passport scheme and the re-opening of North Atlantic travel.
In 2022 there is likely to be an increase in air fares. This is partly due to cost pressures such as fuel which will spike more than normal because airlines have found it harder to implement fuel hedging strategies during the pandemic. Also, there is likely to be significant pent-up demand due to the travel restrictions prevailing in 2020 and 2021 along with an increase in general inflation. Another factor in this anticipated recovery is the reduction in price competition caused by airlines going out of business.
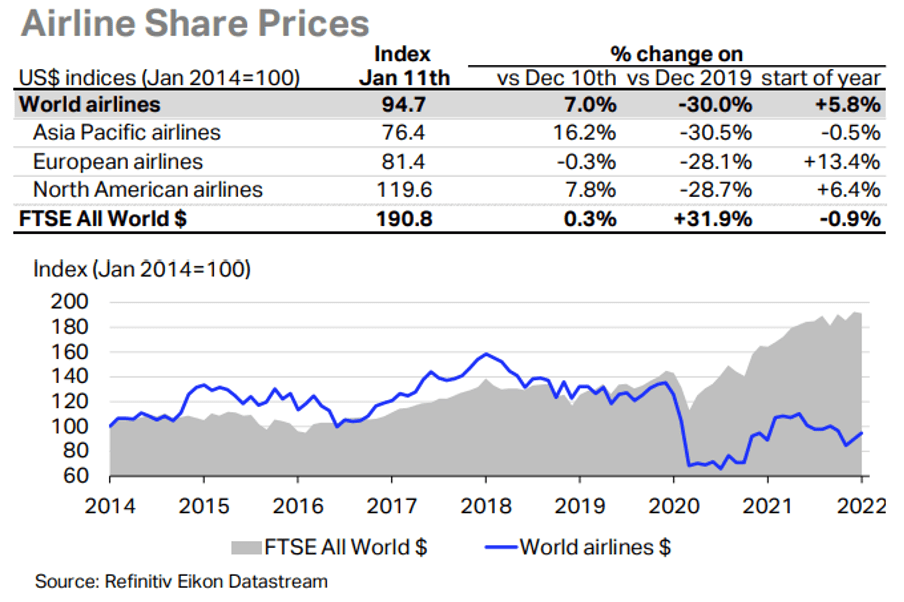
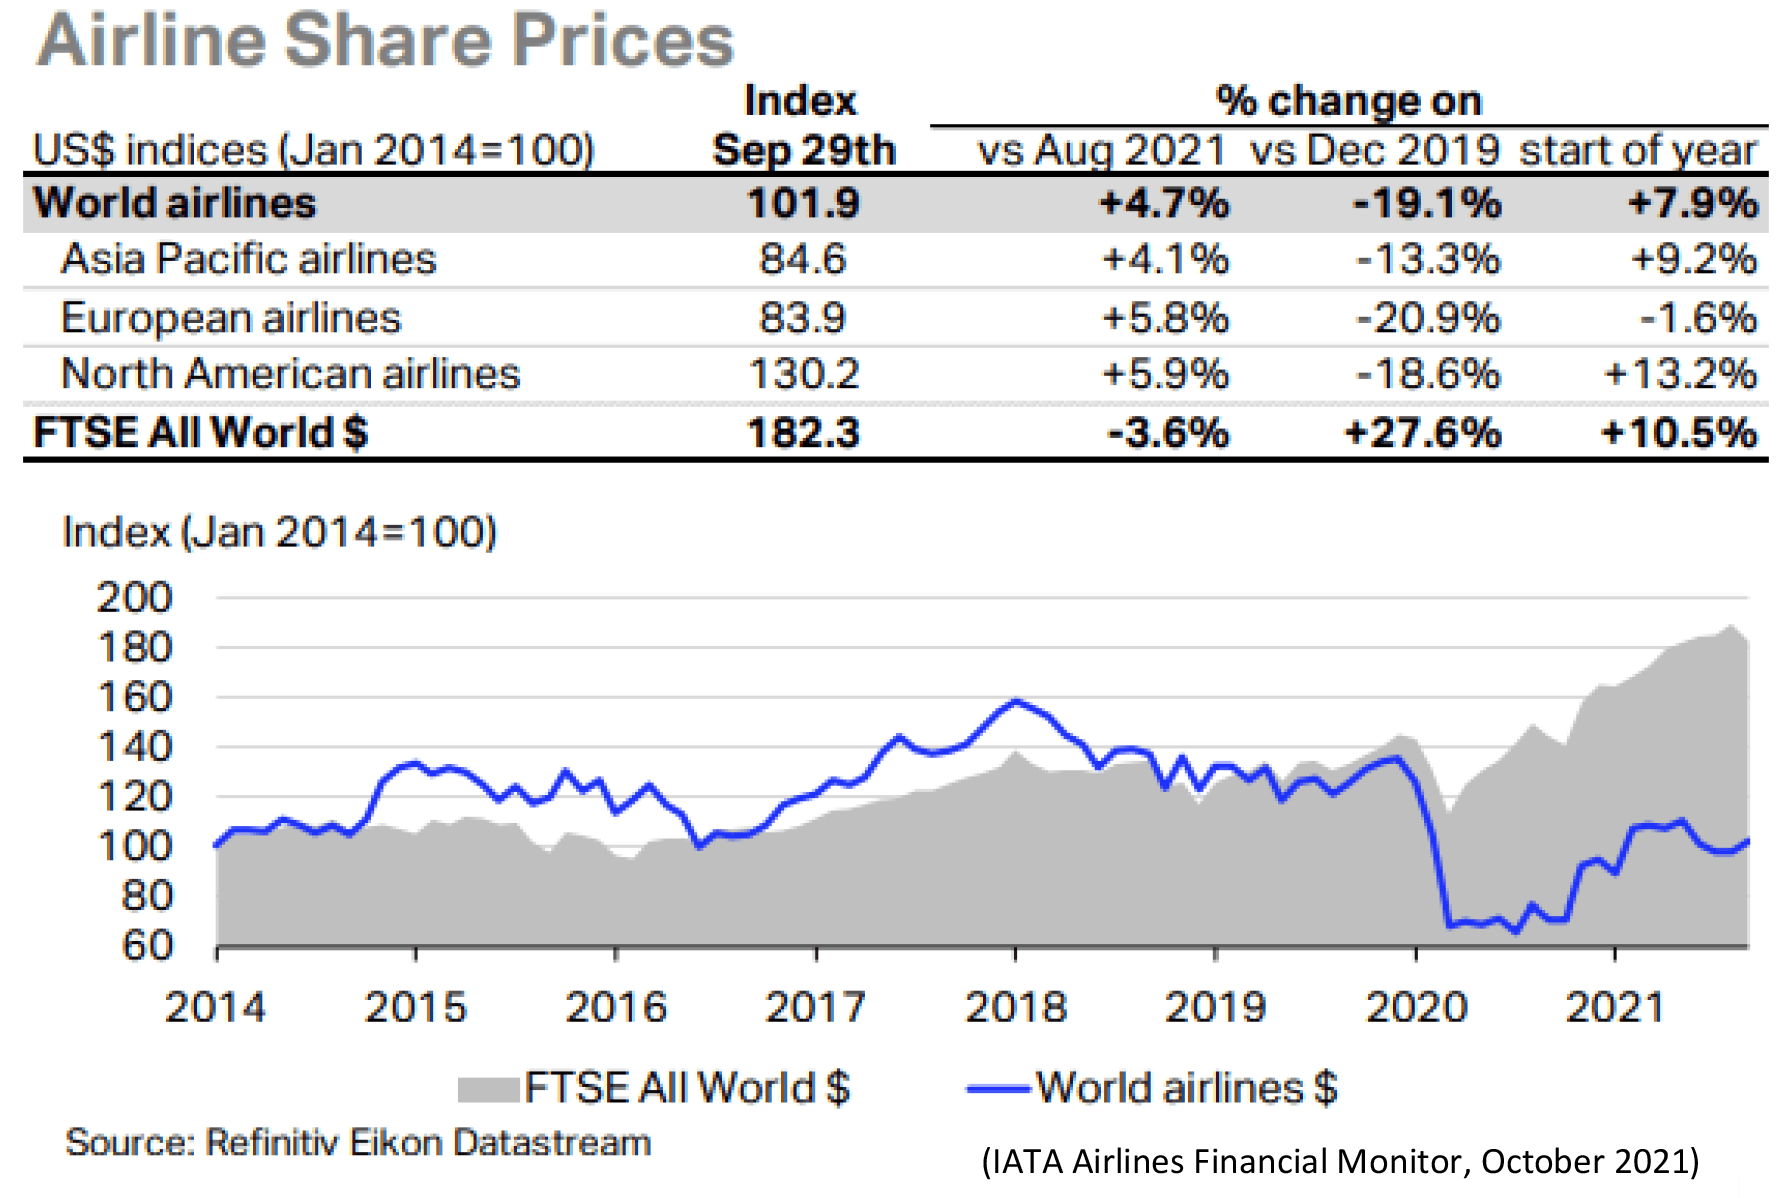
Airline share prices have recovered from their 2020 lows, but the chart below shows that they have underperformed the overall market. This is not surprising given the continued uncertainty over the timing of recovery and the probable requirement to strengthen balance sheets by issuing new equity at the cost of diluting existing shareholders.
Significant airline credit events in Q4 2021 were:
- Alitalia ceased operations and transferred most of its operations to its successor ITA (it should be emphasised that this was an orderly process and cannot really be characterised as a default)
- Blue Panorama (Italy) suspended operations
- Great Dane Airlines (Denmark) ceased operations and filed for bankruptcy
- ITA (Brazil) suspended operations
- Tayaran Jet (Bulgaria) ceased operations
According to the aviation consultancy Ishka 17 airlines with 1,557 aircraft were under formal restructuring in in January, a decrease from October.
Aircraft Leasing Industry Consolidation
Q4 2021 saw the closing of the largest aircraft leasing merger in the history of the industry, AerCap’s acquisition of GECAS. Given this important event and the popularity of industry consolidation as a topic of conversation amongst those who work for aircraft lessors, it seems opportune to review consolidation’s history and consequences.
The table below tracks all aircraft leasing M&A activity since 2000 that we are aware of. We have classified transactions under the headings of either “Consolidation” or “New Entrant”. In a Consolidation transaction both buyer and target are already industry participants whereas a New Entrant Transaction involves a buyer that is not. We have also included a rough transaction value based on the target’s fleet at the year-end before the transaction.
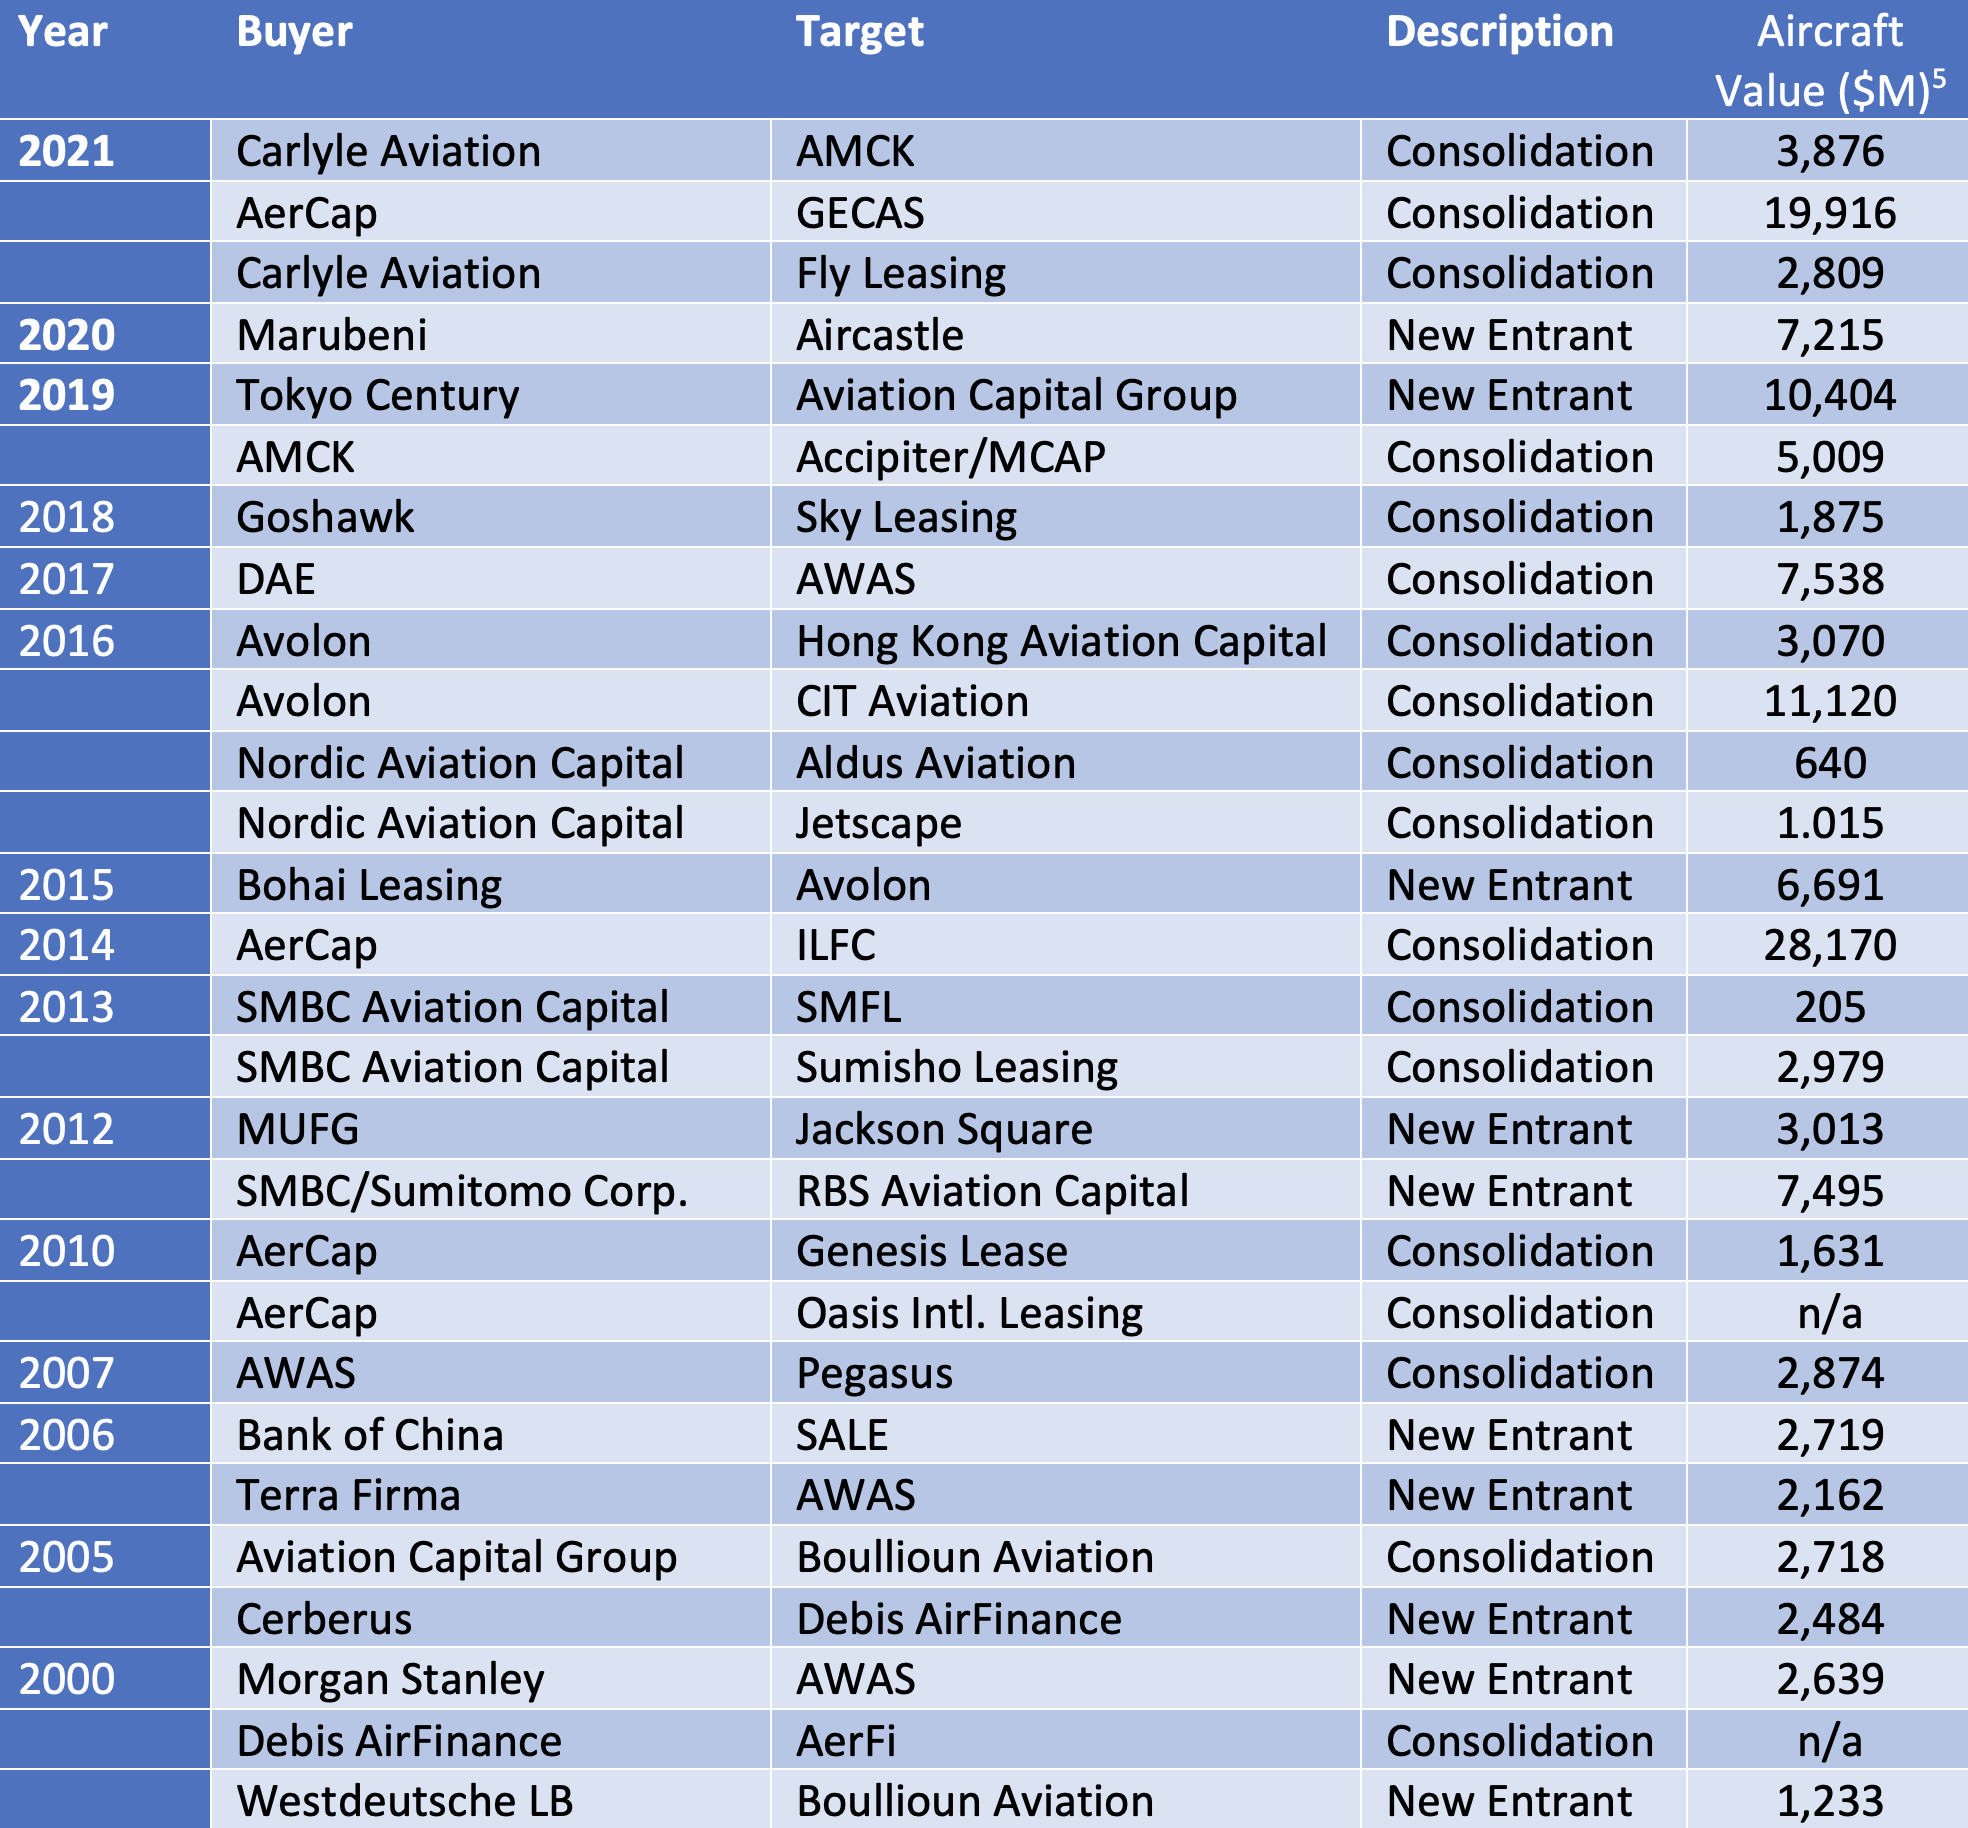
Buyer motivation varies depending on the whether they are already an industry participant. New entrants are looking to avoid the challenges of establishing a business from scratch and put a value on the asset management platform as well as the aircraft portfolio. Transactions driven by consolidation tend to be about scaling up an existing business and can involve significant attrition for employees of the target company.
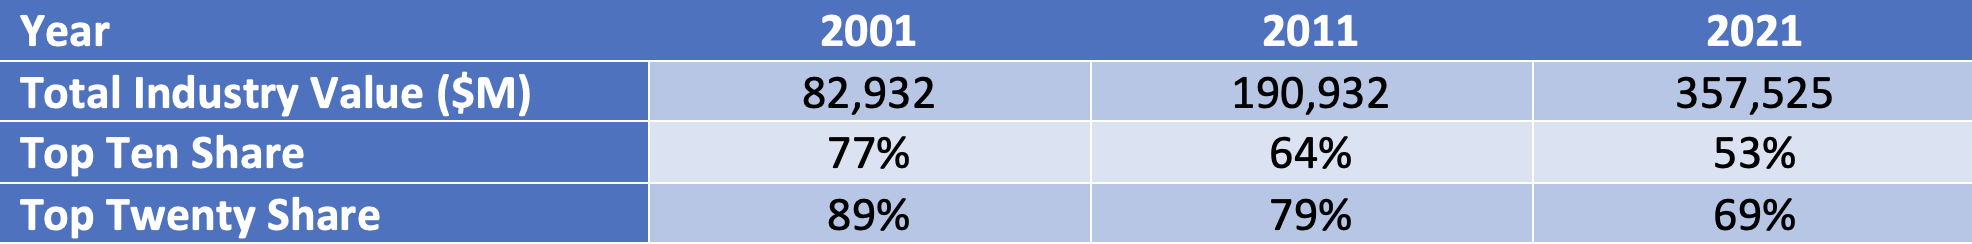
The number and scale of transactions has clearly increased since 2010 but this does not necessarily mean the industry has become more concentrated as the total value of the industry has increased as well. The table below shows shares of total industry value for the top ten and top twenty lessors since 2001. The industry has become more fragmented with the share of the top ten dropping by 24% and the top twenty by 20%, slightly less[6].
A big part of the recent history of aircraft leasing industry structure is the impact of new entrants from China, starting with Bank of China’s acquisition of SALE in 2006. There have been a significant number of these new entrants and they comprise ten of the top twenty and 35% of total industry assets at December 2021. Apart from Bank of China the only other Chinese new entrant to acquire an existing platform has been Bohai Leasing, which bought Avolon in 2015. The other new entrants have been highly price-competitive, particularly for sale-leasebacks of new aircraft, which has limited the ability of industry incumbents to grow as much as they might have anticipated.
Consolidation can be a very sensible reaction to this kind of aggressive competition. It does not necessarily improve profitability – the chart below shows profitability vs size for a broad range of aircraft lessors from 2010 to 2020 and there is only a modest upward trend. This should not be a surprise because the aircraft leasing market is efficient, and scale does not confer pricing power.
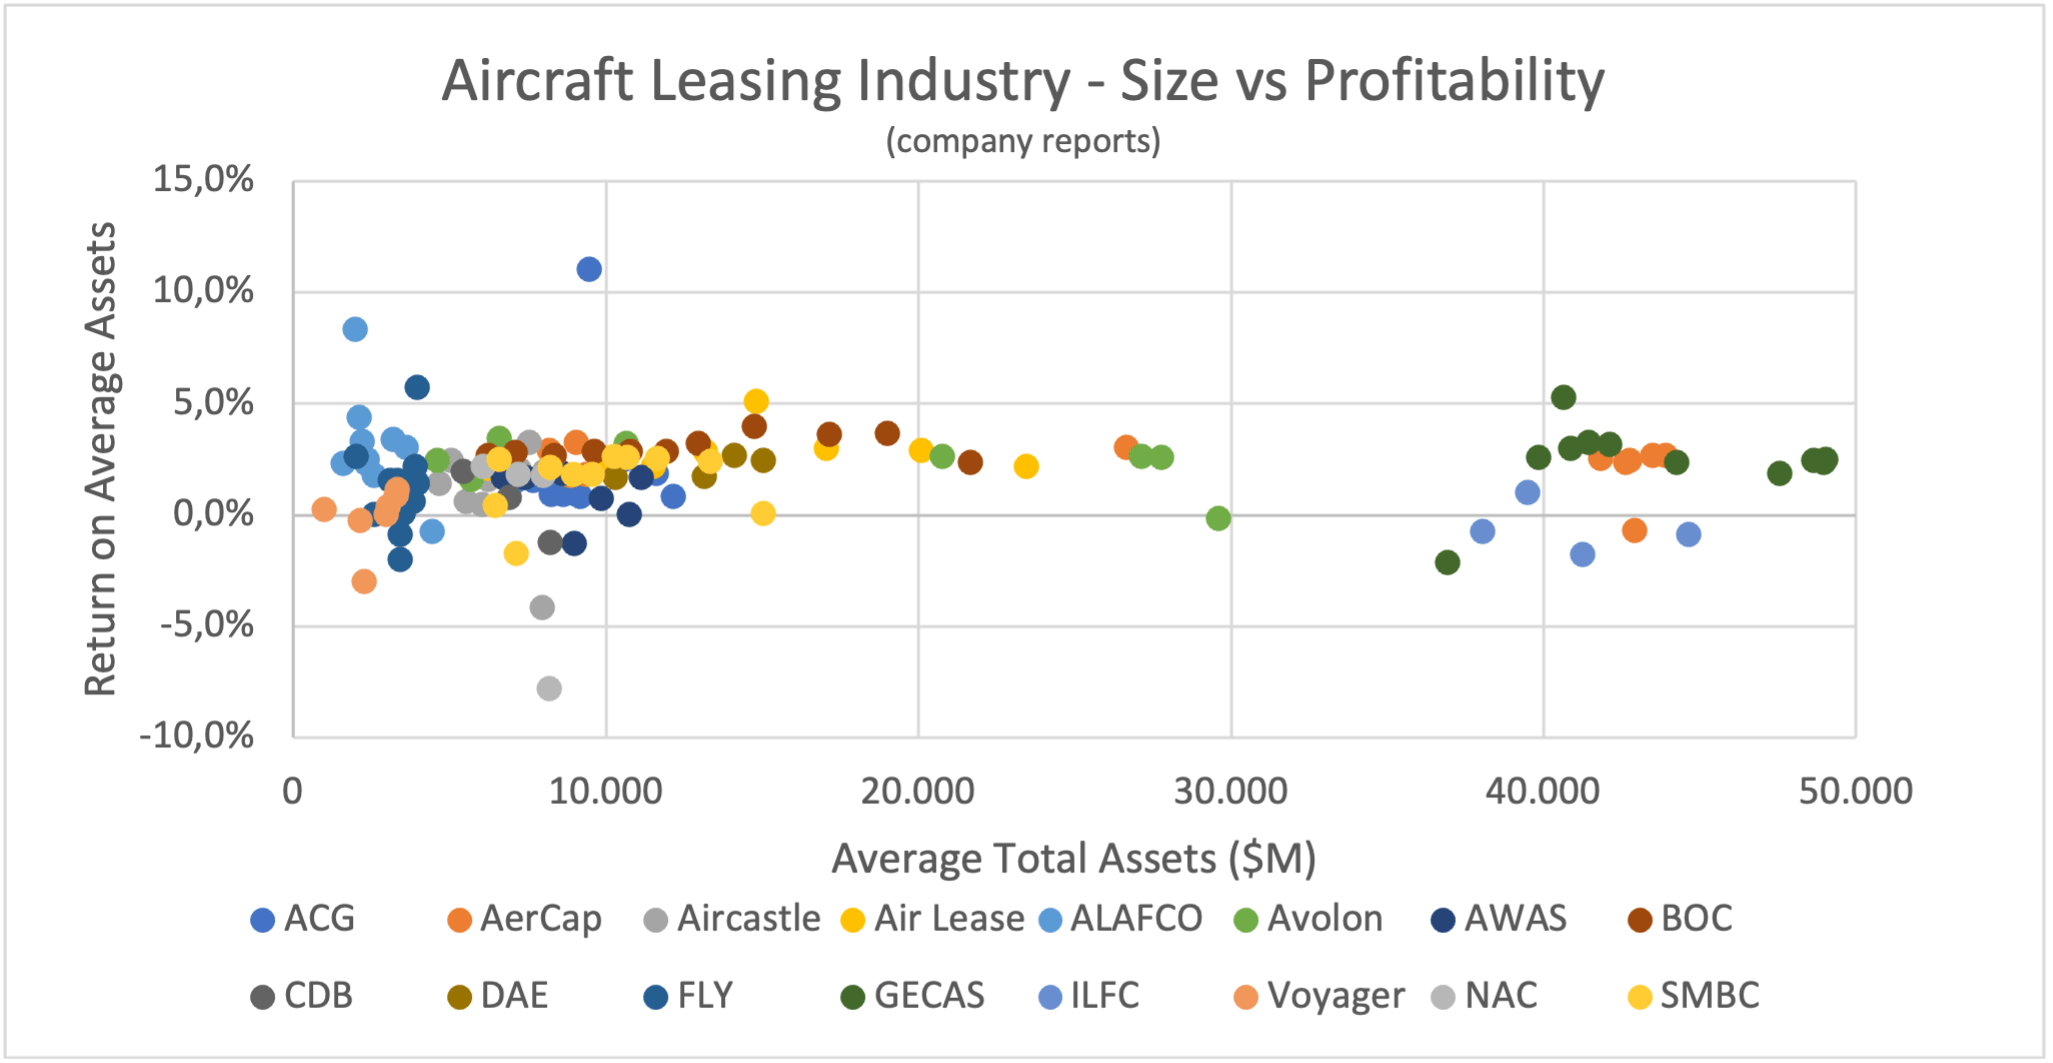
However, growth through acquisition can avoid some of the disadvantages of “organic” growth, particularly the acquisition of aircraft types that are not well suited to leasing, such as those with a limited airline customer base. Most of the outliers in the chart on the upside are US lessors that benefitted from President Trump’s one-off changes to corporate taxation in 2017 (we use after-tax profits so we can include GECAS on an apples-to-apples basis). The big outlier in terms of ROA on the downside is Nordic Aviation Capital, a specialised regional aircraft lessor, in 2020.
When one looks at the scatter plot for the largest lessors there are single loss-making years for AerCap and GECAS, both in 2020 as a result of COVID-19. However, there is consistent weak performance from ILFC in the period 2010-2013, mainly caused by asset impairments. ILFC did not make any material acquisitions and had a very high concentration on twin-aisle aircraft.
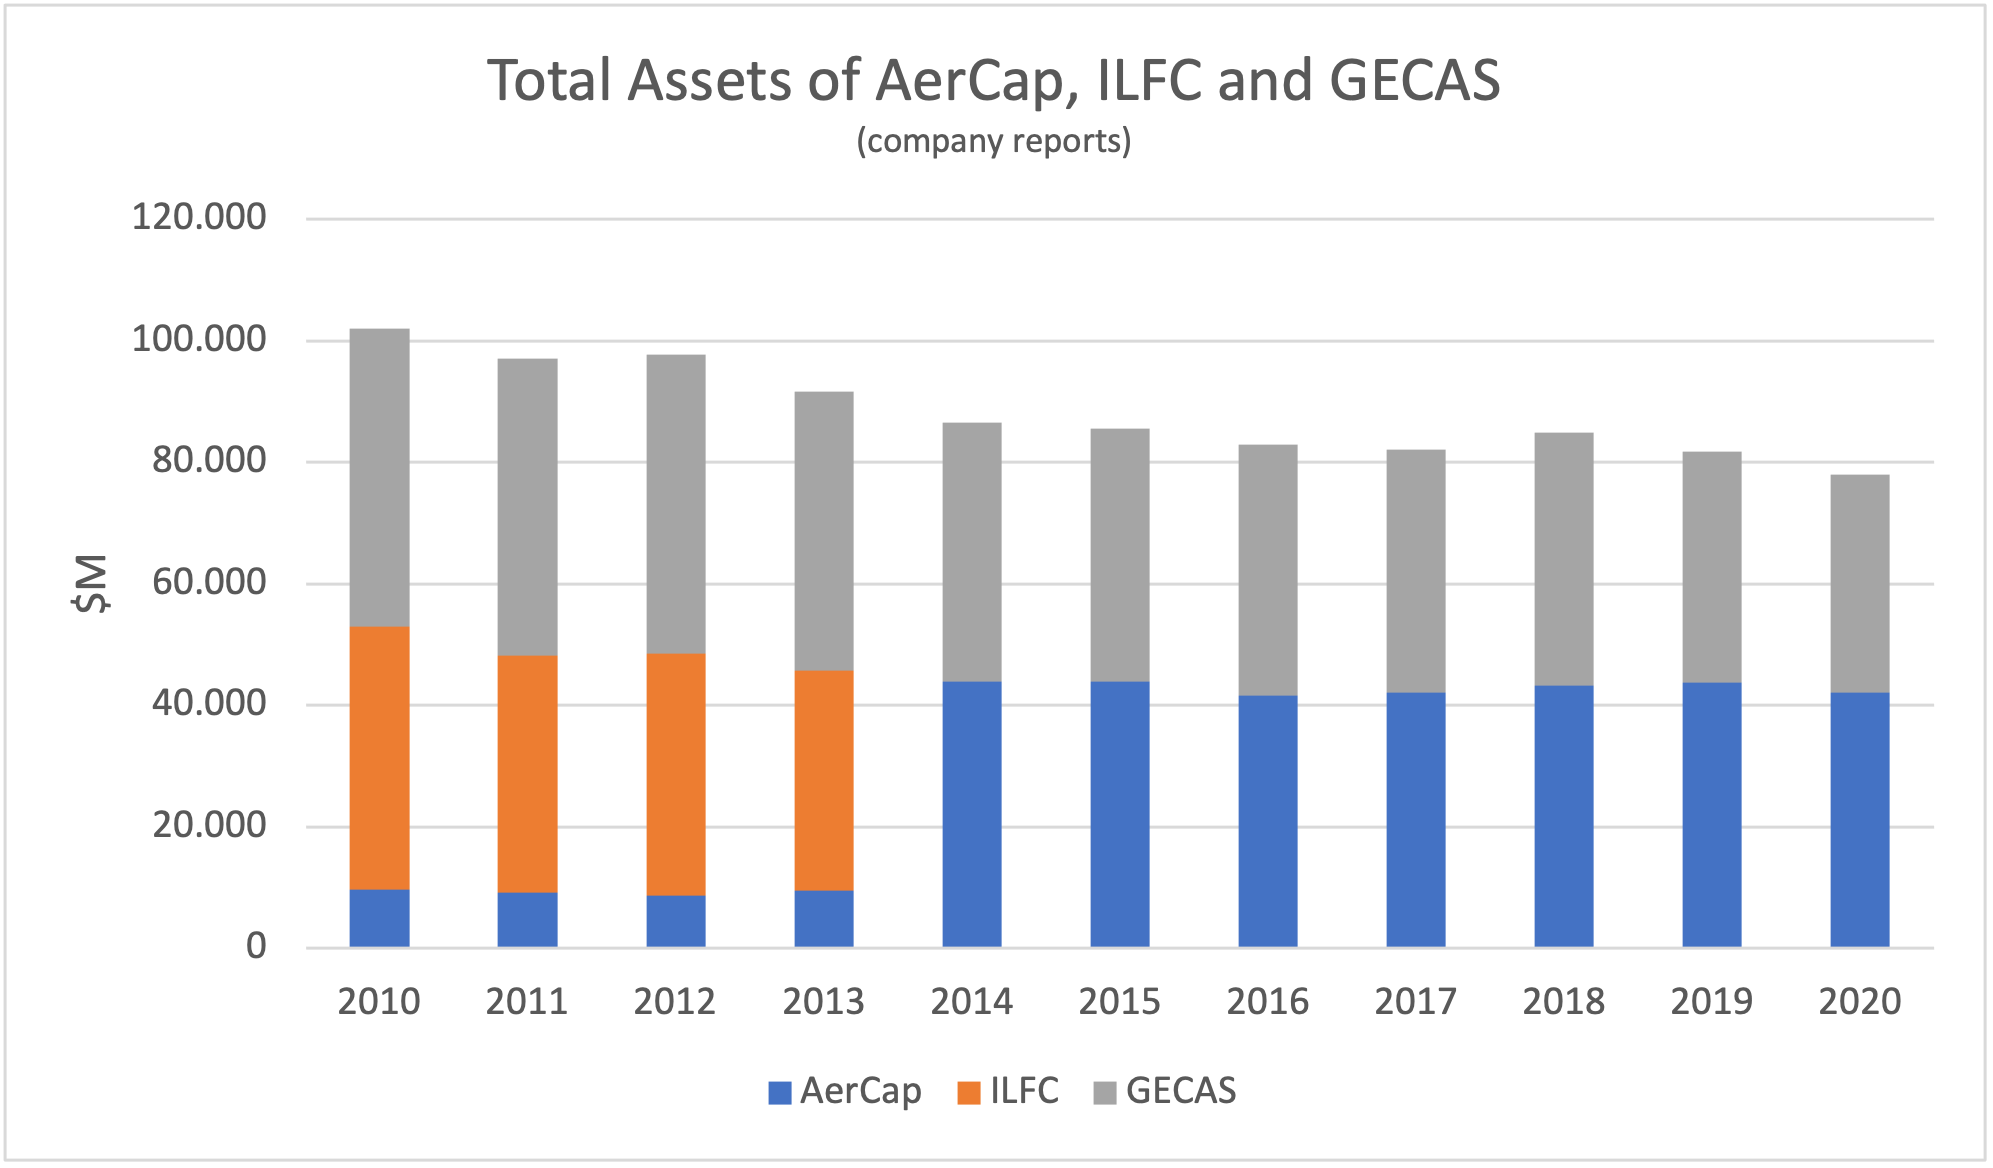
AerCap’s acquisition of GECAS means that it now owns both of the traditional industry “big two” (it acquired ILFC in 2014). From 2010 to 2020 the aggregate total assets of these three companies declined by over 20% while the overall value of the aircraft leasing industry more than doubled. This absolute and relative decline shows the growth challenges faced by well-established lessors when faced with unprecedented price competition.
However, there are number of good reasons to do this transaction apart from growth. AerCap will remain the industry leader in terms of scale for the foreseeable future which should help it when negotiating new aircraft acquisitions from Airbus and Boeing, and It also has the opportunity to reduce its S, G & A costs relative to assets. Although it may be hard to grow the business in absolute terms AerCap has demonstrated its ability to grow shareholder value in recent years by selling aircraft at a healthy profit and buying back shares at a discount to book value. It can keep doing this and will retain the option to increase its new aircraft purchases through sale-leasebacks if that market tips in favour of the buyer.
Disclaimer
This document is for informational purposes only. It is not intended as advice or a recommendation with respect to any transaction. The recipient of this document shall be solely responsible for making its own independent investigation and appraisal of any transaction. No market or company data or other information is warranted or guaranteed by Sirius Aviation Capital as to its completeness, accuracy, or fitness for a particular purpose, express or implied, and such data and information are subject to change without notice. Any comments or statements made herein reflect the assumptions, views, and analytical methods of the persons that prepared this document as of its date of preparation, and do not necessarily reflect the views of Sirius Aviation Capital. Sirius Aviation Capital may have issued, and may in the future issue, other communications that are inconsistent with, and reach different conclusions from, the information presented herein. Sirius Aviation Capital specifically disclaims any obligation to update this document, or any comments or statements contained herein.
[1] The crack spread is the difference between the price of crude oil and the fuel products extracted from it.
[2] RPKs is the acronym for revenue passenger kilometres which is the product of the number of passengers flown and distance flown.
[3] ASKs is the acronym for available seat kilometres, which is the product of the number of seats flown and distance flown. This is the basic measure of airline industry capacity.
[4] Airbus normally quotes its production rates based on an 11.5-month year for single-aisle aircraft and an 11-month year for twin-aisle aircraft.
[5] Aircraft value figures are determined by using historic Avitas CMVs for all aircraft under management per Cirium at the year-end before acquisition. Some lessors such as FLY had outsourced aircraft management so no meaningful numbers are available on this basis. For Fly Leasing and Genesis Lease we have used aircraft net book value at the year-end prior to acquisition. Aircraft value as calculated here will tend to understate total transactions value because aircraft lessors have significant other assets including cash and predelivery payments.
[6] Lessor fleet statistics include all managed aircraft per Cirium Fleets Analyser and values are historic Avitas CMVs.

Industry Review Q3 2021
Macro-Economic Background
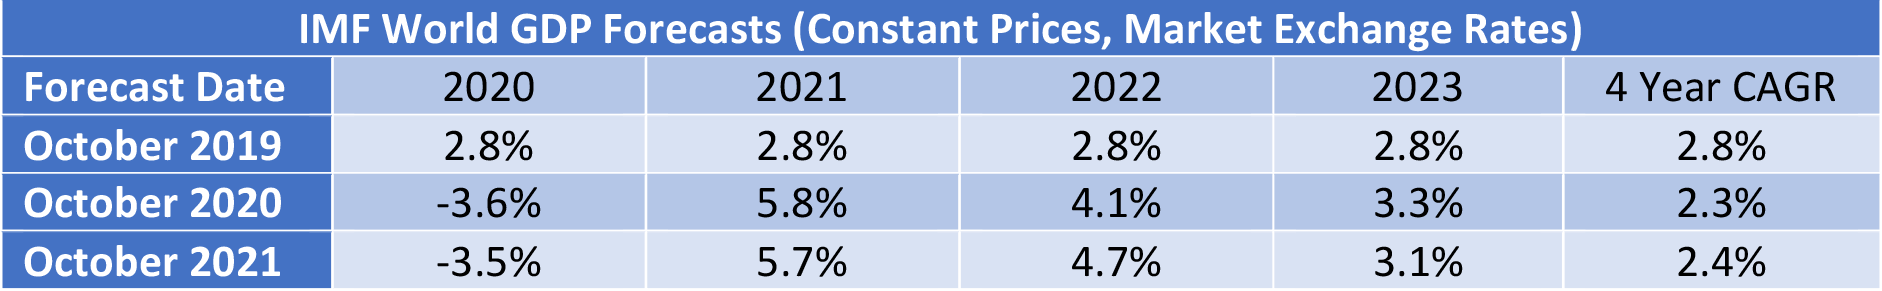
For this report we have looked at the IMF’s World GDP forecasts in a slightly longer-term context. October 2019 lends itself to the role of base case showing a steady 2.8% growth every year through 2023. This and subsequent forecasts show growth around this level from 2024 onwards, so the real variability is in the years 2020-2023. Both the 2020 and 2021 forecasts show a modest drop in CAGR relative to 2019, but with the recovery in the 2021 forecast more concentrated in 2022. The good news is that the anticipated 2021 recovery has happened despite the continuing impact of the pandemic and global supply chain problems.
The price of jet fuel continued to increase in Q3 2021, driven by the increase in the price of crude oil and by the return of the “crack spread” to more normal historical levels. Today’s price is at levels last seen in 2018, which was a good year for the airline industry so one would not expect very negative consequences. However, it will reduce the airlines’ financial flexibility and at the margin will encourage them to prioritize profit margins over traffic growth as it will increase their break-even load factor.
For airlines outside of the US this negative continues to be offset by a weaker US Dollar. This is a very important factor in airline financial performance because so many airline costs are typically US Dollar-denominated – not just fuel but also aircraft rents, debt service, aircraft, and spare parts.
Another indicator that is potentially important to aircraft investors is the breakeven inflation rate on US Treasury Inflation-Protected Securities (TIPS). This indicator measures inflation expectations and it matters because used aircraft values are strongly influenced by the cost of new aircraft and over time this cost is linked to US Dollar inflation. In the short term this linkage is driven by escalation clauses in aircraft purchase contracts and in the long term by the general input cost environment for the aircraft manufacturers. There has been a sharp and sustained increase in inflation expectations on a ten-year time horizon in the last twelve months.
Traffic and Aircraft Demand
Recovering from the impact of COVID-19 remains slow and patchy. Global RPKs for the nine months to September 2021 were down 60% vs 2019 compared to a 67% drop for the six months to June. As the tables below make clear domestic traffic continues to outperform international by a large margin due to the greater impact of government restrictions on the latter. The US have just reopened their market to non-essential travel which is a significant positive, but this development will be more relevant to 2022 than 2021
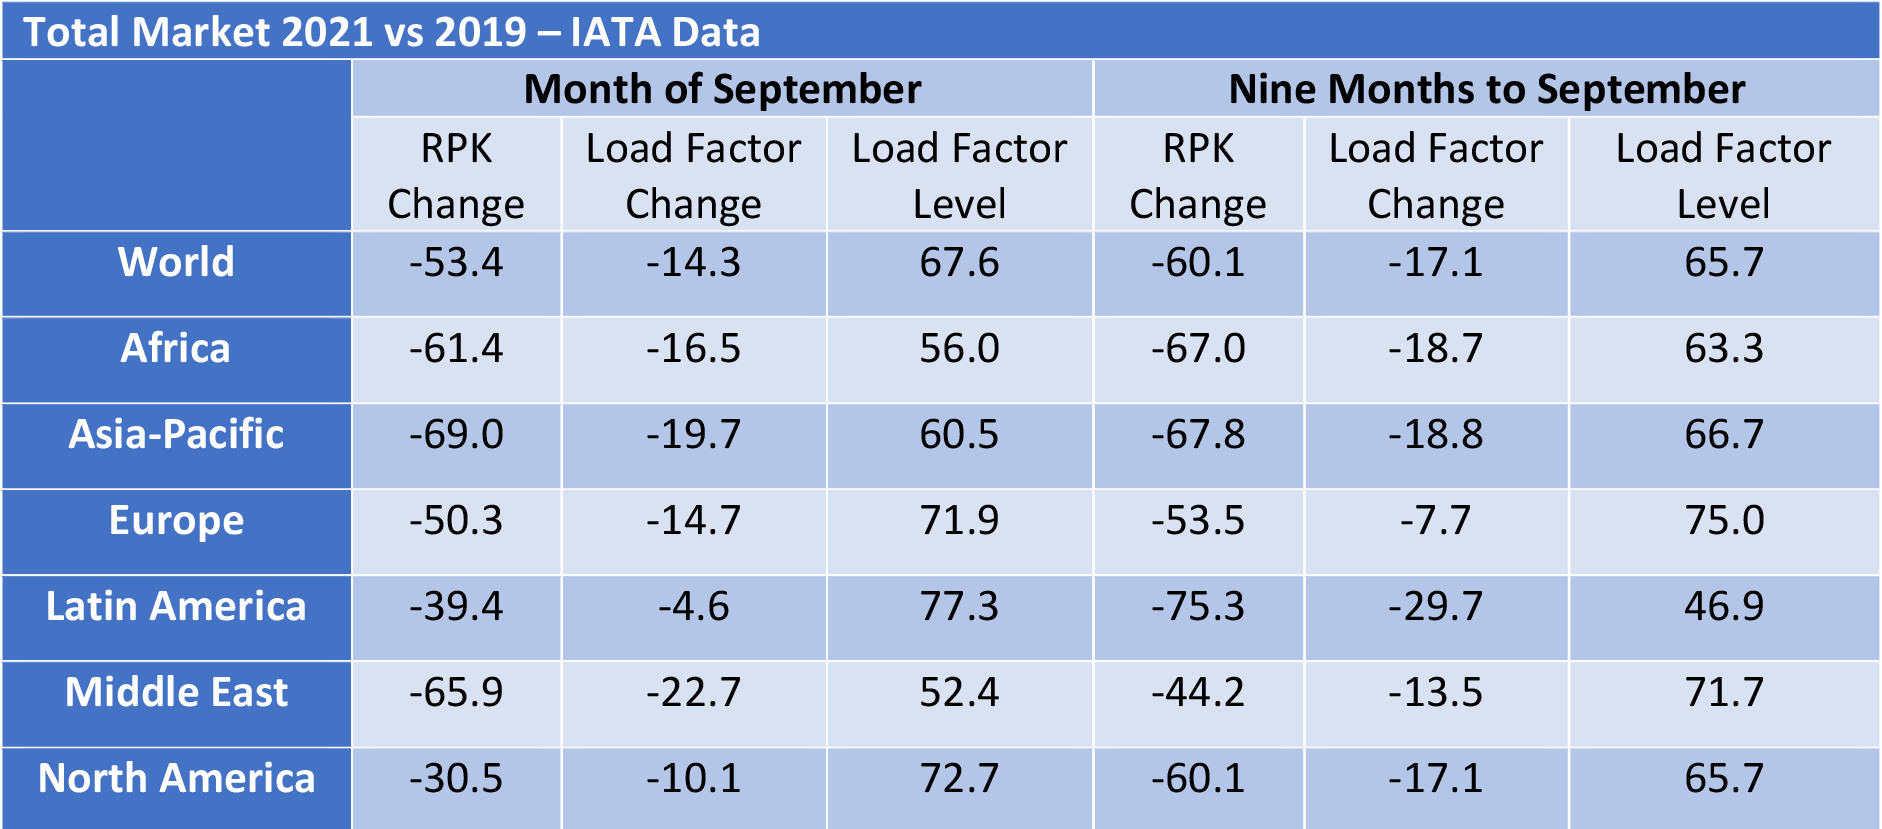

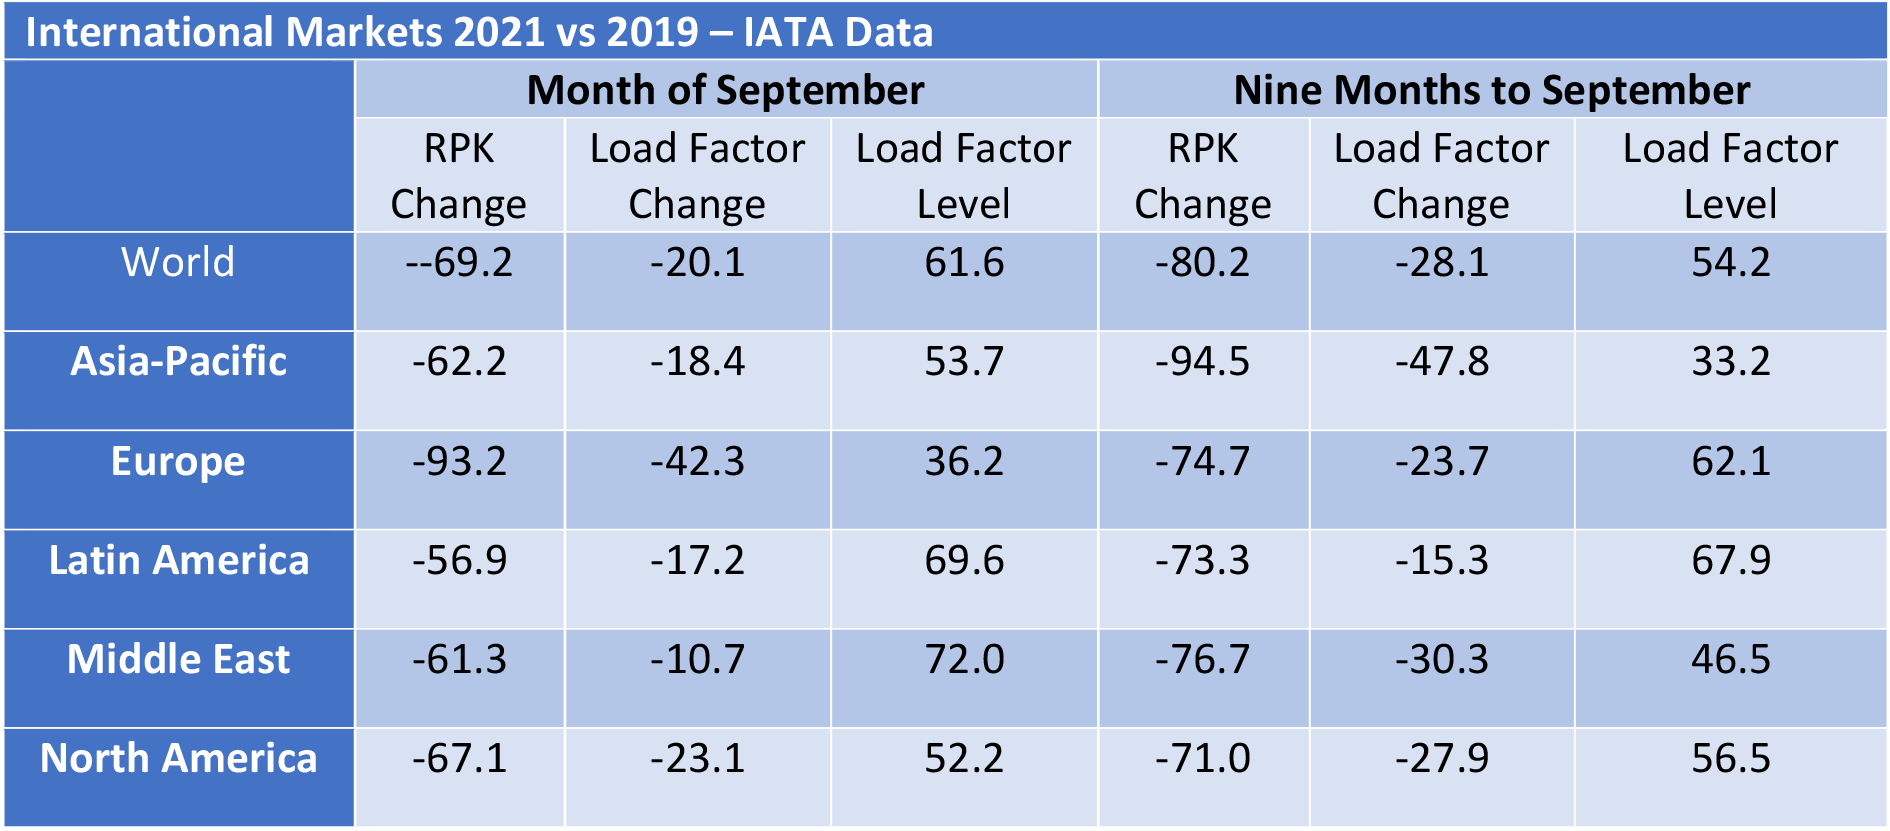
IATA reports changes in traffic and global market shares rather than actual values and reports domestic traffic on a different basis to international traffic by focusing on country rather than regional markets. The country focus becomes more understandable when one considers the large share of total domestic traffic accounted for by the seven countries listed whose combined share of domestic traffic is over 80%.
Although the breakdown of domestic traffic in 2021 looks similar to 2019, this is not true of the breakdown of domestic and international traffic by region. Although domestic traffic has an increased share everywhere, the change is most dramatic in the Asia-Pacific region where international traffic has collapsed, and domestic Chinese traffic is most of what’s left.

Although some short-haul aircraft serve international routes nearly all long-haul aircraft do so, and this is reflected in the relative demand for single-aisle (narrowbody) and twin-aisle (widebody) aircraft. Aircraft demand can be measured in terms of ASKs and aircraft in service. ASKs have not declined as much as traffic because load factors have declined and aircraft in service have not declined as much as ASKs because aircraft utilization has declined. The airlines are clearly sweating their assets more since the middle of 2021 as the rates of growth in both ASKs and aircraft in service have both declined. This is probably due to a more stable market environment and the need to address rising fuel prices with greater asset productivity.


New Aircraft Supply
Airbus announced the following changes in production plans:
- • A320 family production rate to increase from 64 aircraft per month to 65 in mid-2023
- • A350 family production rate to increase from 5 to 6 per month in early 2023 rather than late 2022
Airbus is reported to have received written objections from some of its major lessor customers after announcing that it is considering an increase in A320 family production to 75 aircraft per month in 2025. It is also believed that key members of its supply chain such as engine manufacturers are not enthusiastic either. One might speculate that Airbus is testing the waters with some of its key stakeholders and signalling that intends to maintain its lead in the single-aisle aircraft market.
Boeing has delivered roughly 150 of the 450 B737 Max aircraft held in inventory before the type was recertified in November 2020. However, the B737 Max inventory was still around 370 at the end of September, implying that 70 new units have been manufactured but not yet delivered. This is probably due to a combination of delivery bottlenecks and delays in recertification in some jurisdictions, notably China. Inventory is expected to clear by 2023. Boeing is producing 19 aircraft per month and says it is on track to meet its target of 31 aircraft per month in early 2022. Management is considering further production increases but are wary of potential supply chain issues.
Boeing has also had quality and production problems with the B787, its main passenger twin-aisle product (nearly all B747, B767 and B777 deliveries are freighters or tankers) and has suspended deliveries. There are 105 B787s in inventory.
There has been an increase in the production of the ARJ 21 regional jet by COMAC and some degree of recovery in deliveries by Embraer and Sukhoi.
Airline Industry Financial Performance
IATA’s new industry forecast shows the airline industry returning to a near breakeven in 2022 after another very difficult year in 2021. North America is set to be the first region to move back into profit and Europe is forecast to be the next best performer on an EBIT Margin basis. Europe’s relative performance is much better than in 2021 due to positive impacts of its Covid passport scheme and the re-opening of North Atlantic travel. Another factor in the global recovery is the reduction in price competition caused by airlines going out of business.
Airline share prices have recovered from their 2020 lows, but the chart below shows that they have underperformed the overall market. This is not surprising given the continued uncertainty over the timing of recovery and the probable requirement to strengthen balance sheets by issuing new equity at the cost of diluting existing shareholders.
There were no additional major airline bankruptcies in Q3 2021. Although there were reports in October that Air Madagascar will file for court protection according to Cirium Fleets Analyzer it only has one aircraft in its fleet. According to the aviation consultancy Ishka 23 airlines with 1,586 aircraft were under formal restructuring in October 2021, a small increase from July.
Aircraft Trading Update
Most aircraft trades take place between lessors and/or investors and involve aircraft subject to lease. Airline to airline trades are much less common and most aircraft sales without a lease in place are for freighter conversion or part-out.
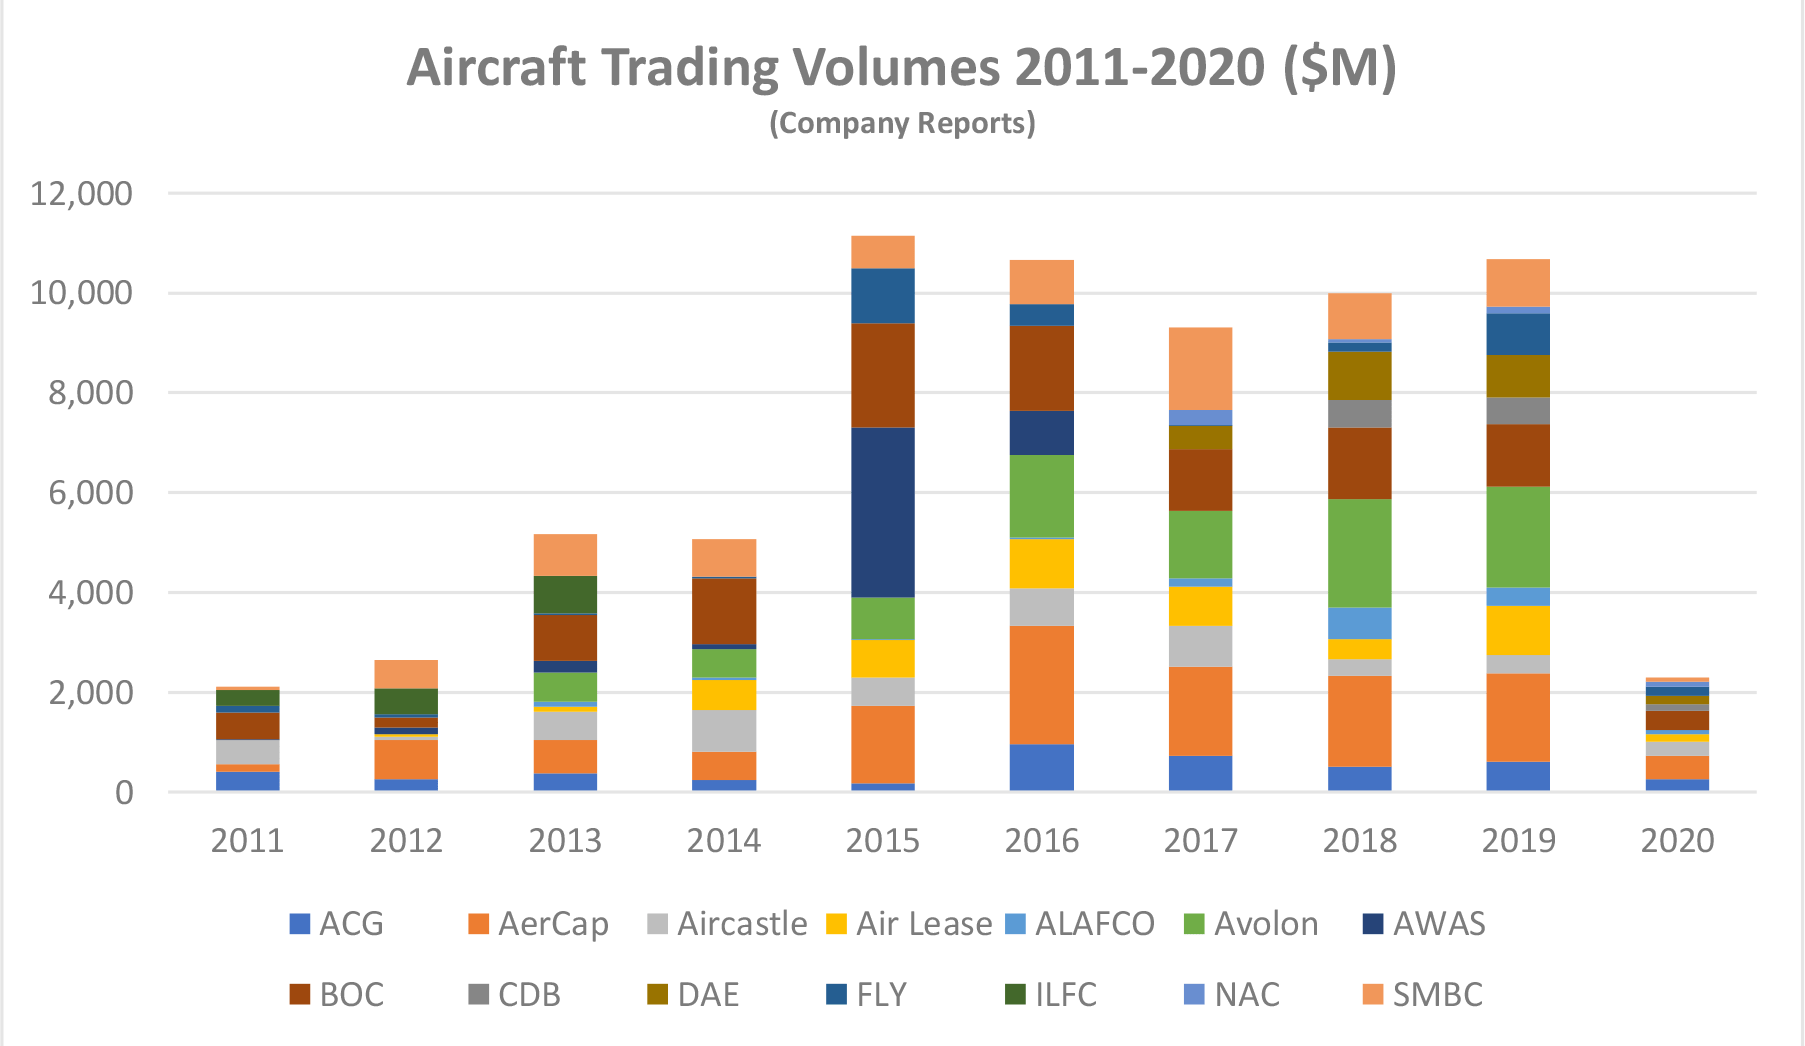
The most important sellers of aircraft subject to lease are the major lessors. The chart above shows us Dollar sales volumes for 14 major lessors over the last ten years where public financial information is available. The most important market participant where we lack data is GECAS, and if we make a reasonable estimate of their activity, it is likely that average annual aircraft sales volume from 2015 to 2019 was around $12 Billion.
Part of the reason for the increase in aircraft sales before 2020 is a change in the lessors’ approach to portfolio management. Before the financial crisis only ILFC had a stand-alone public credit rating and other lessors relied on a combination of shareholder funding, bank loans and aircraft ABS issues in the capital markets for their debt requirements.
Access to unsecured corporate debt has become increasingly attractive from a cost and operational point of view and most large lessors now have public credit ratings, even where they are majority owned by a major financial institution (examples include BOC Aviation, CDB Aviation and SMBC Aviation Capital). The rating agencies focus on fleet age as a key metric for business risk, and this means that lessors now sell aircraft to manage their fleet age as well as to generate trading profits.
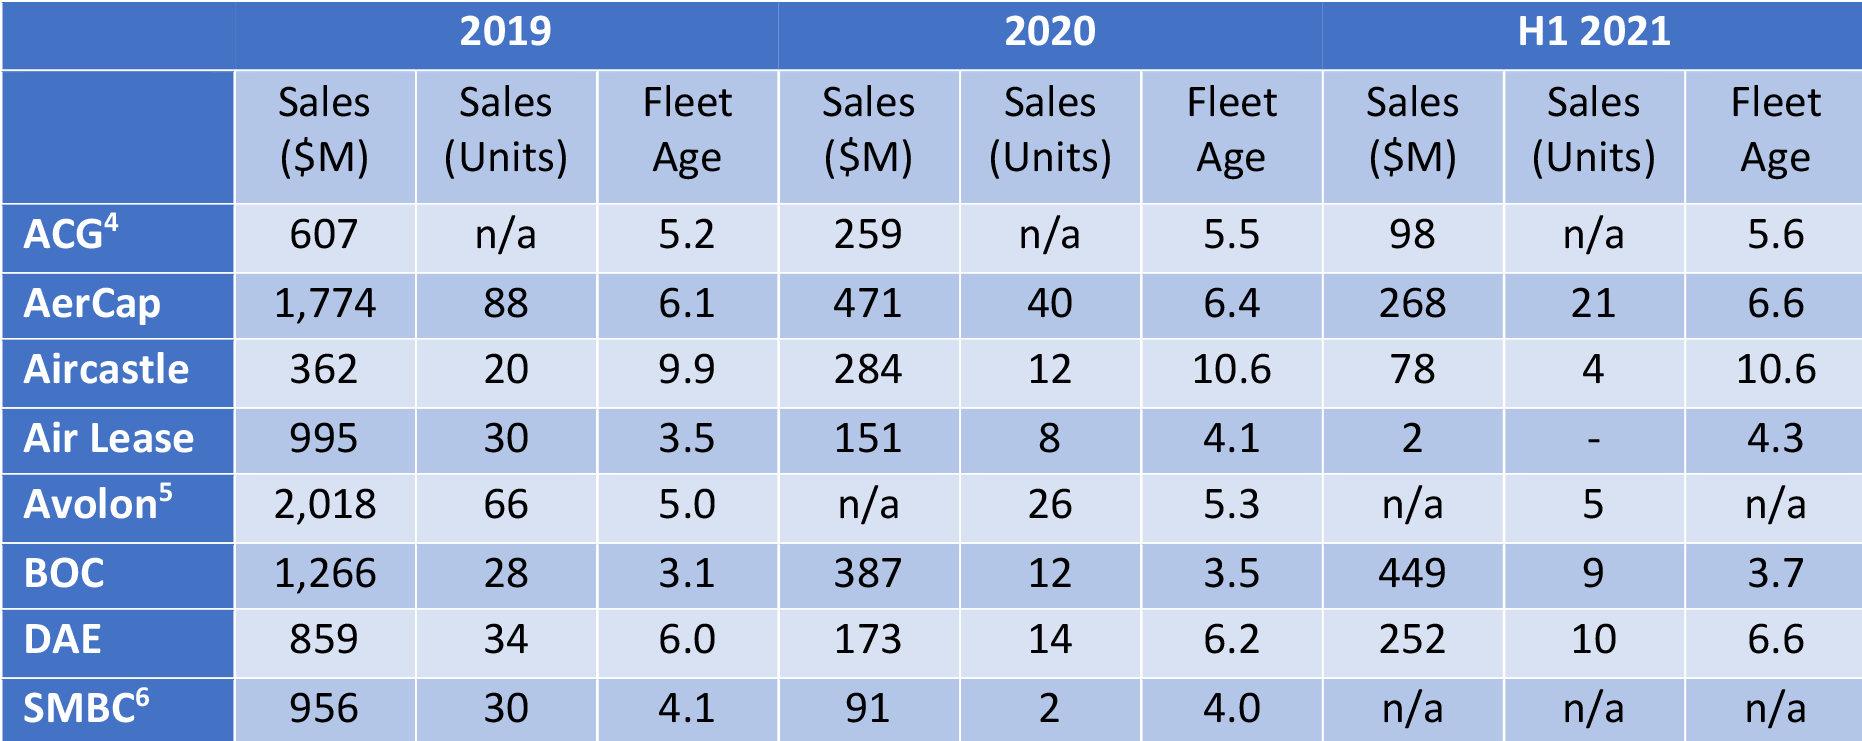
The table above provides more detail on the lessors most active as sellers of aircraft. We do not have full data due to differences in disclosure policies, but one can make some observations all the same:
- Aggregate sales activity dropped significantly in 2020 and H1 2021, both in terms of US Dollar volumes and units.
- In all but one case fleet age (average age weighted by net book value) has increased. The impact of the ageing of existing aircraft has been partly offset by the impact of new purchases.
- The reaction of different lessors to the impact of the pandemic has varied. Some have maintained a relatively high level of sales activity whereas others have virtually sat out the downturn. It should be emphasised that all the large lessors have high levels of liquidity and do not sell aircraft at a loss, although they do suffer non-cash asset impairments.
We believe that another reason for the decline in sales activity is the widespread granting of rental deferrals to airlines to improve their cash flow during the pandemic. This has an impact because it is a standard term of aircraft sales agreements that where an aircraft is subject to lease the payments on the lease must be up to date. Even if a potential buyer were willing to waive this requirement the transaction would require the airline to agree a novation agreement and this process would be much more challenging in the context of negotiating a deferral. This has limited the number of aircraft available for sale and has meant that there has been more competition amongst buyers in 2021 vs 2020.
As the airline industry recovers, we believe that the major lessors will seek to catch up with the level of sales they were contemplating before the pandemic and will offer aircraft portfolios to the market with a broader range of airline credits and aircraft types than in the last 18 months.
Disclaimer
This document is for informational purposes only. It is not intended as advice or a recommendation with respect to any transaction. The recipient of this document shall be solely responsible for making its own independent investigation and appraisal of any transaction. No market or company data or other information is warranted or guaranteed by Sirius Aviation Capital as to its completeness, accuracy, or fitness for a particular purpose, express or implied, and such data and information are subject to change without notice. Any comments or statements made herein reflect the assumptions, views, and analytical methods of the persons that prepared this document as of its date of preparation, and do not necessarily reflect the views of Sirius Aviation Capital. Sirius Aviation Capital may have issued, and may in the future issue, other communications that are inconsistent with, and reach different conclusions from, the information presented herein. Sirius Aviation Capital specifically disclaims any obligation to update this document, or any comments or statements contained herein.

Industry Review Q2 2021
Macro-Economic Background
In its latest World Economic Outlook (July 2021) the IMF has produced a significantly more optimistic GDP forecast than in October 2020. Given the well-established correlation between world GDP and air traffic growth this upgrade is a significant positive for industry recovery.

There has been an increase in the price of jet fuel since early 2020. Although this will not stop airlines’ return to profitability it decreases the industry’s financial flexibility.
For airlines outside of the US this negative had been partly offset by a weakening of the US Dollar. This is a very important factor in airline financial performance because so many airline costs are typically US Dollar-denominated – not just fuel but also aircraft rents, debt service, aircraft, and spare parts.
Another indicator that is potentially important to aircraft investors is the breakeven inflation rate on US Treasury Inflation-Protected Securities (TIPS). This indicator measures inflation expectations and it matters because used aircraft values are strongly influenced by the cost of new aircraft and over time this cost is linked to US Dollar inflation. There has been a sharp increase in inflation expectations relative to recent years.
Traffic and Aircraft Demand
Recovering from the impact of COVID-19 is proving a painfully slow process for the airlines. IATA’s June traffic figures show an improvement relative to 2019 compared to the first half of 2021 overall, but the situation remains much more difficult than any downturn before 2020.
There remains a major difference between trends in domestic and international traffic. Large domestic markets such as the US and China have shown a much stronger recovery than the total market with June 2021 RPKs down only 15% and 11% respectively vs 2019. The biggest challenge for international travel remains a complex and ever-changing web of government regulations. There are some signs of a more constructive approach such as the EU Vaccine Passport scheme which should facilitate a recovery on short-haul international routes in Europe.
Although some short-haul aircraft serve international routes nearly all long-haul aircraft do so, and this is reflected in the relative demand for single-aisle (narrowbody) and twin-aisle (widebody) aircraft. Aircraft demand can be measured in terms of ASKs and aircraft in service. ASKs have not declined as much as traffic because load factors have declined and aircraft in service have not declined as much as ASKs because aircraft utilization has declined. Airlines have been able to live with the resultant decline in asset productivity to a certain extent because lower fuel prices and a weaker US Dollar have reduced their unit costs.
New Aircraft Supply
Airbus announced detailed guidance on its future production plans in May 2021 as follows:
• A220 currently at 5/mo rising to 6/mo in early 2022
• A320 currently at 40/mo rising to 45/mo in Q4 2021 and 64/mo by Q2 2023
• A330 currently at 2/mo and no planned changes
• A350 currently at 5/mo increasing to 6/mo in autumn 2022
We do not believe that Airbus has a material number of aircraft in inventory. All planned increases in production are very modest except for the A320 family which is likely to maintain a high market share in the single-aisle market. Boeing does not have a strong competitor to the A321Neo, the largest aircraft in the A320 family which accounts for nearly half its deliveries.
Airbus also recently announced that it is considering the development of a freighter version of the A350.
Boeing has delivered 130 B737 Max aircraft since the type was recertified in November 2020. Most of these deliveries came from inventory and new production is at 16/mo with a target increase to 31/mo in early 2022. Of the 387 aircraft already delivered that were grounded in March 2019 190 have returned to service. This shortfall compared to planned production has helped offset the impact of COVID-19 – if Boeing had kept delivering Maxes at 50/mo there would be roughly 1,750 aircraft in service vs the actual 320 as of June 2021. There are still c. 400 Maxes in inventory.
Boeing has also had quality and production problems with the B787, its main passenger twin-aisle product (nearly all B747, B767 and B777 deliveries are freighters or tankers). There are nearly 100 B787s in inventory and its production will temporarily drop from 5/mo to as low as 2/mo. Boeing have not announced any plans to increase the production rate in the future.
Airline Industry Financial Performance
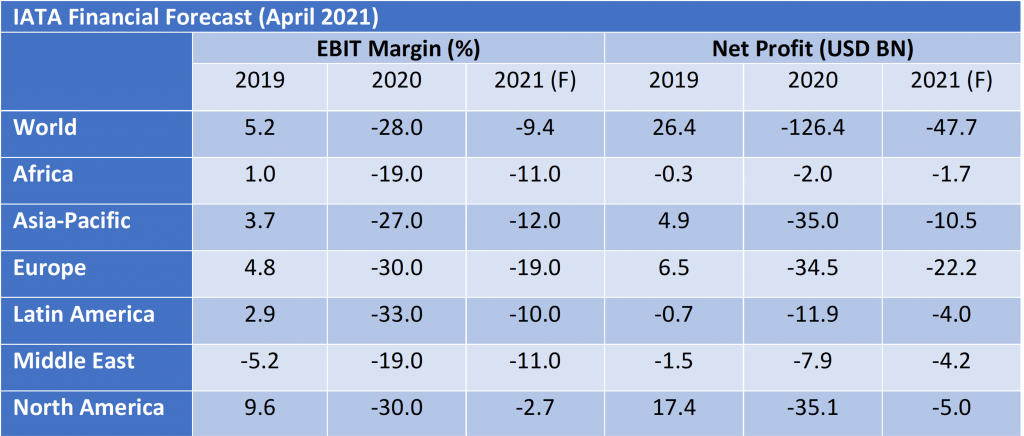
Although IATA’s industry forecast shows a significant year on year improvement in 2021 it will still be the second worst year ever by a considerable margin. Average industry EBIT margin is set to improve from -28% to -9%: the main outliers are North America which is close to break-even at -2.7% and Europe, which is lagging badly at -19.0%. This reflects the relative importance of domestic vs international traffic in these regions, with European short-haul traffic being held back by the lack of a unified approach to safe travel by governments in the first half of 2021.
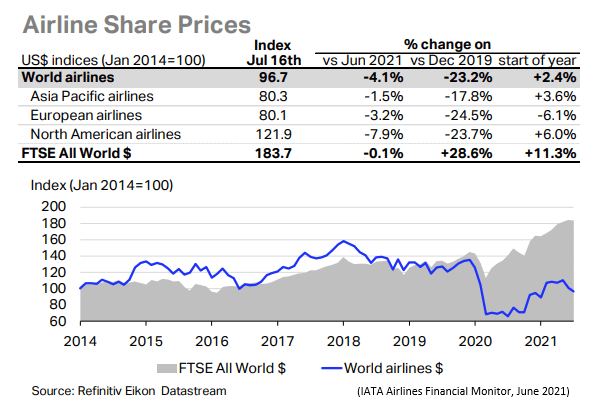
Airline share prices have recovered from their 2020 lows, but the chart below shows that they have underperformed the overall market. This is not surprising given the continued uncertainty over the timing of recovery and the probable requirement to strengthen balance sheets by issuing new equity at the cost of diluting existing shareholders.
Several major airlines have sought court protection in 2021, particularly in the Asia-Pacific region. In February HNA Group filed for bankruptcy and Malaysian Airlines entered a scheme of arrangement in the English courts. In March AirAsia X secured a restraining order with respect to its creditors and Garuda has defaulted on a sukuk financing and is in dispute with some of its aircraft lessors. In Europe the Smartwings Group including Czech Airlines was declared bankrupt in March. Other airlines that remain in restructuring include LATAM, Avianca, Aeromexico, Thai Airways and South African Airways. According to the aviation consultancy Ishka 22 airlines with 1,497 aircraft were under formal restructuring in July 2021.
Aircraft Leasing Industry Financial Performance in 2020
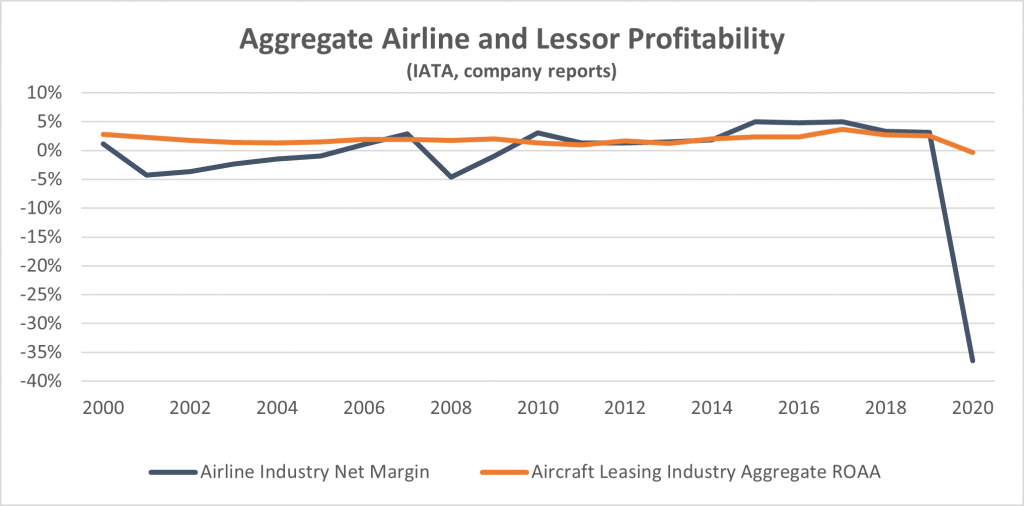
2020 demonstrated the very strong defensive qualities of the aircraft leasing industry compared to the airlines. Sirius tracks the results of all significant lessors with public financial information. The twelve that have reported 2020 results had an aggregate net loss of USD 813M on total average assets of c. USD 220BN, a negative ROAA of 0.4%. Once again, the value of contracted income streams has been clear, and although the initial global impact of the pandemic made geographical credit diversification less valuable, regional airline performance is already showing its historic pattern of significant divergence.
Although credit losses in 2020 were significant, they were less important than asset impairments, particularly impairments relating to twin-aisle aircraft (the market for these aircraft was already suffering from over-supply in 2019). There will undoubtedly be more credit losses in 2021, but it is important not to exaggerate the scale of exposure created by the widespread granting of rental deferrals to assist airlines facing liquidity problems. Total overdue receivables disclosed were USD 1.54BN, 1.2% of total assets for the relevant companies.
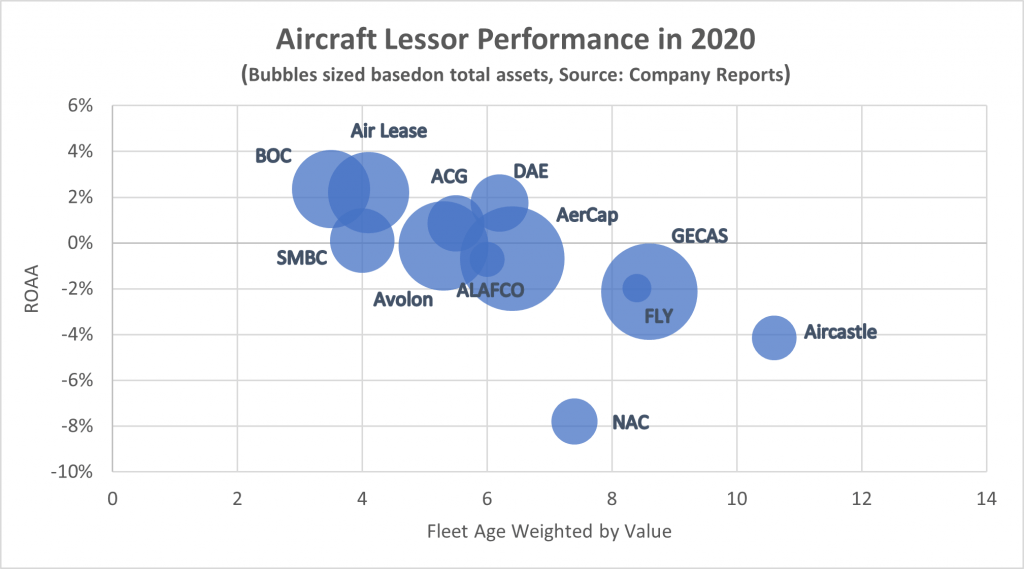
Although lessors with younger fleets have done better in terms of profitability it is too early to be definitive about relative performance through the pandemic. The one real outlier is Nordic Aviation Capital (NAC) which has had a very differentiated asset strategy based almost entirely on regional jets and turboprops. NAC had to seek court protection in 2020, as did another lessor, Voyager. Voyager also has a differentiated asset strategy based on twin-aisle aircraft.
There has been minimal evidence of financial distress with other lessors because their assets have included a large percentage of single-aisle aircraft and because they have had a policy of maintaining strong liquidity: AerCap in early 2020 was typical with liquidity equal to twelve months capex and debt repayments.
Major aircraft lessor share prices have performed better than those of the airlines, having briefly regained their pre-pandemic levels in early 2021 despite a more recent sell-off. In March AerCap announced that it had agreed to acquire GECAS thus combining the two biggest industry participants, and another important acquisition was announced with Carlyle Aviation acquiring Fly Leasing.
Disclaimer
This document is for informational purposes only. It is not intended as advice or a recommendation with respect to any transaction. The recipient of this document shall be solely responsible for making its own independent investigation and appraisal of any transaction. No market or company data or other information is warranted or guaranteed by Sirius Aviation Capital as to its completeness, accuracy, or fitness for a particular purpose, express or implied, and such data and information are subject to change without notice. Any comments or statements made herein reflect the assumptions, views, and analytical methods of the persons that prepared this document as of its date of preparation, and do not necessarily reflect the views of Sirius Aviation Capital. Sirius Aviation Capital may have issued, and may in the future issue, other communications that are inconsistent with, and reach different conclusions from, the information presented herein. Sirius Aviation Capital specifically disclaims any obligation to update this document or any comments or statements contained herein.

Understanding the Aircraft Market
Disclaimer: This document and any other materials contained in or accompanying this document (collectively, the “Materials”) are provided for general information purposes only. The Materials are provided without any guarantee, condition, representation or warranty (express or implied) as to their adequacy, correctness or completeness. Any opinions, estimates, commentary or conclusions contained in the Materials represent the judgement of Sirius Aviation Capital Holdings Ltd ( “Sirius”) as at the date of the Materials and are subject to change without notice. The Materials are not intended to amount to advice on which any reliance should be placed and Sirius disclaims all liability and responsibility arising from any reliance placed on the Materials.
Although people who work in aviation acknowledge it is a cyclical industry, we are often vague about what we mean by the term “cyclical”. This presentation introduces proprietary Sirius research that directly measures aircraft supply and demand and how this relates to key macro-economic indicators.
How Do We Measure Aircraft Supply and Demand?
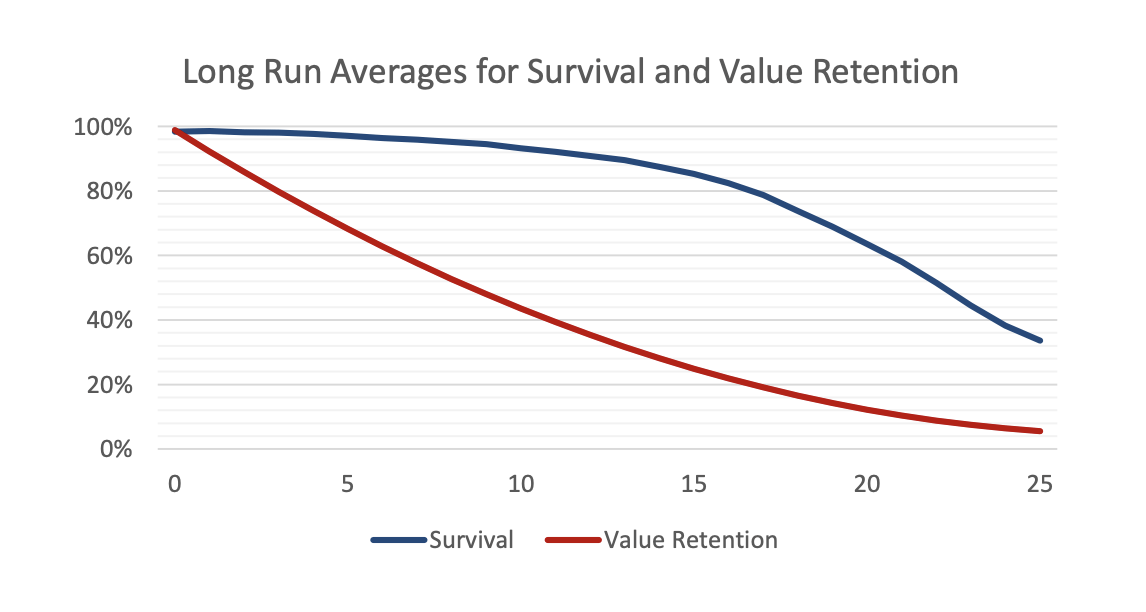
- Two key measures or aircraft economic utility
- Survival – how many passenger aircraft remain in passenger service by age
- Value retention – used aircraft values as %age of replacement cost
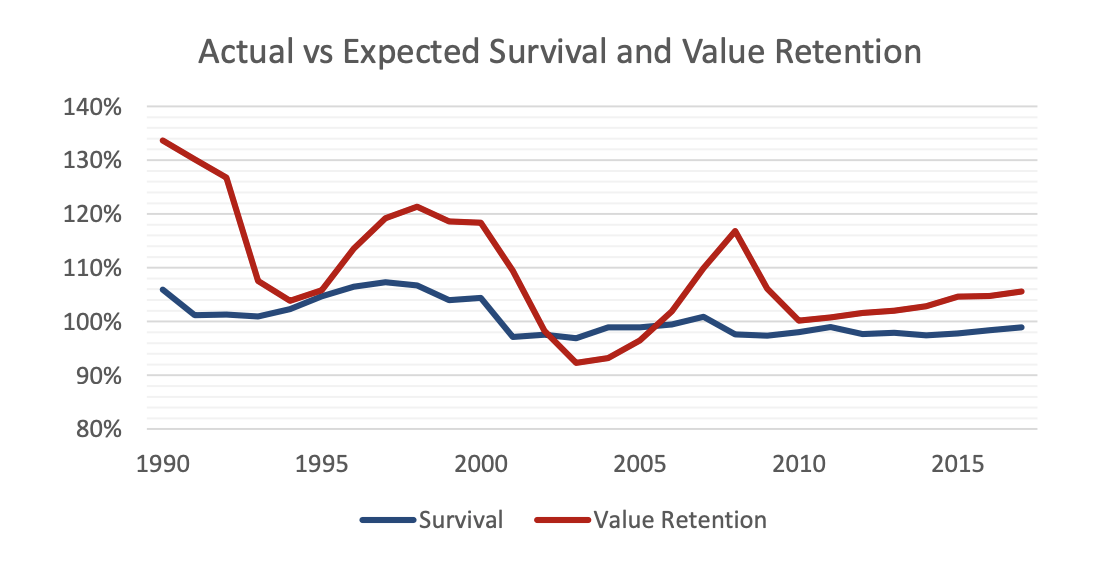
- We can track changes in supply and demand by comparing actual survival and value retention with expected values based on long-run averages
- Correlation analysis suggests that both measures are reflecting the same market dynamics
- Measures of aircraft supply and demand are highly correlated – 81% with a one year lag on value measure
- Correlation holds up at aircraft class level despite distinct cycles – 83% for single-aisle, 72% for twin-aisle
Sources: Avitas, Flight Fleets Analyzer, In-house Estimates Data excludes early technology aircraft e.g. B707/DC8 and 50 seat regional jets
The Aircraft Cycle is Not the Same as the Airline Cycle
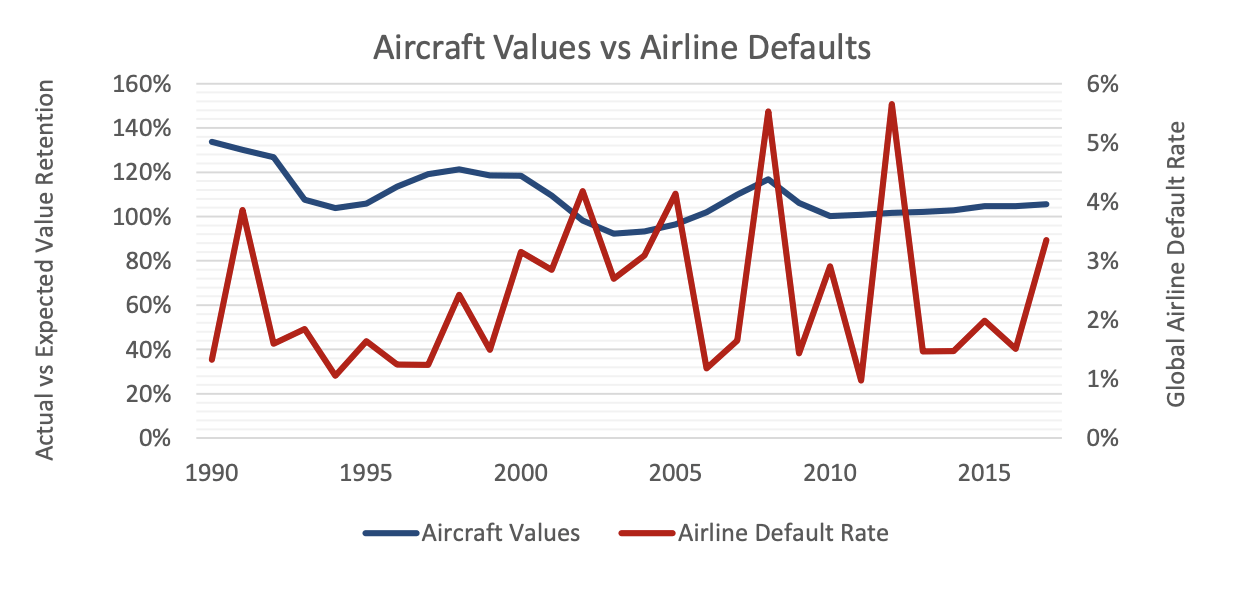
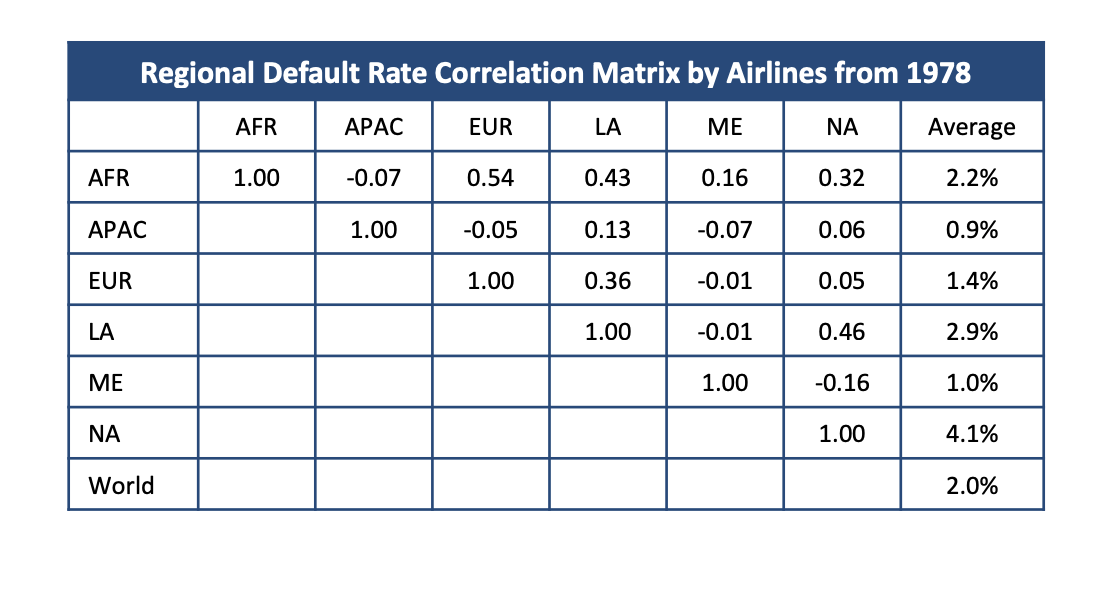
- Conventional wisdom is that airlines always default when aircraft values are weak, and is the result of assuming North America is good proxy for the global airline industry
- Actual correlation between aircraft values and airline defaults is the right way round but not meaningful at -0.11
- Aircraft values are the function of a global market and are influenced by deliveries as well as traffic growth
- Airline default rates are sensitive to local economic conditions and idiosyncratic factors and are not strongly correlated by region
Sources: Avitas, Flight Fleets Analyzer (aircraft fleet statistics for passenger aircraft only). Default statistics based on in-house industry study.
Impact of Macro Economic Factors
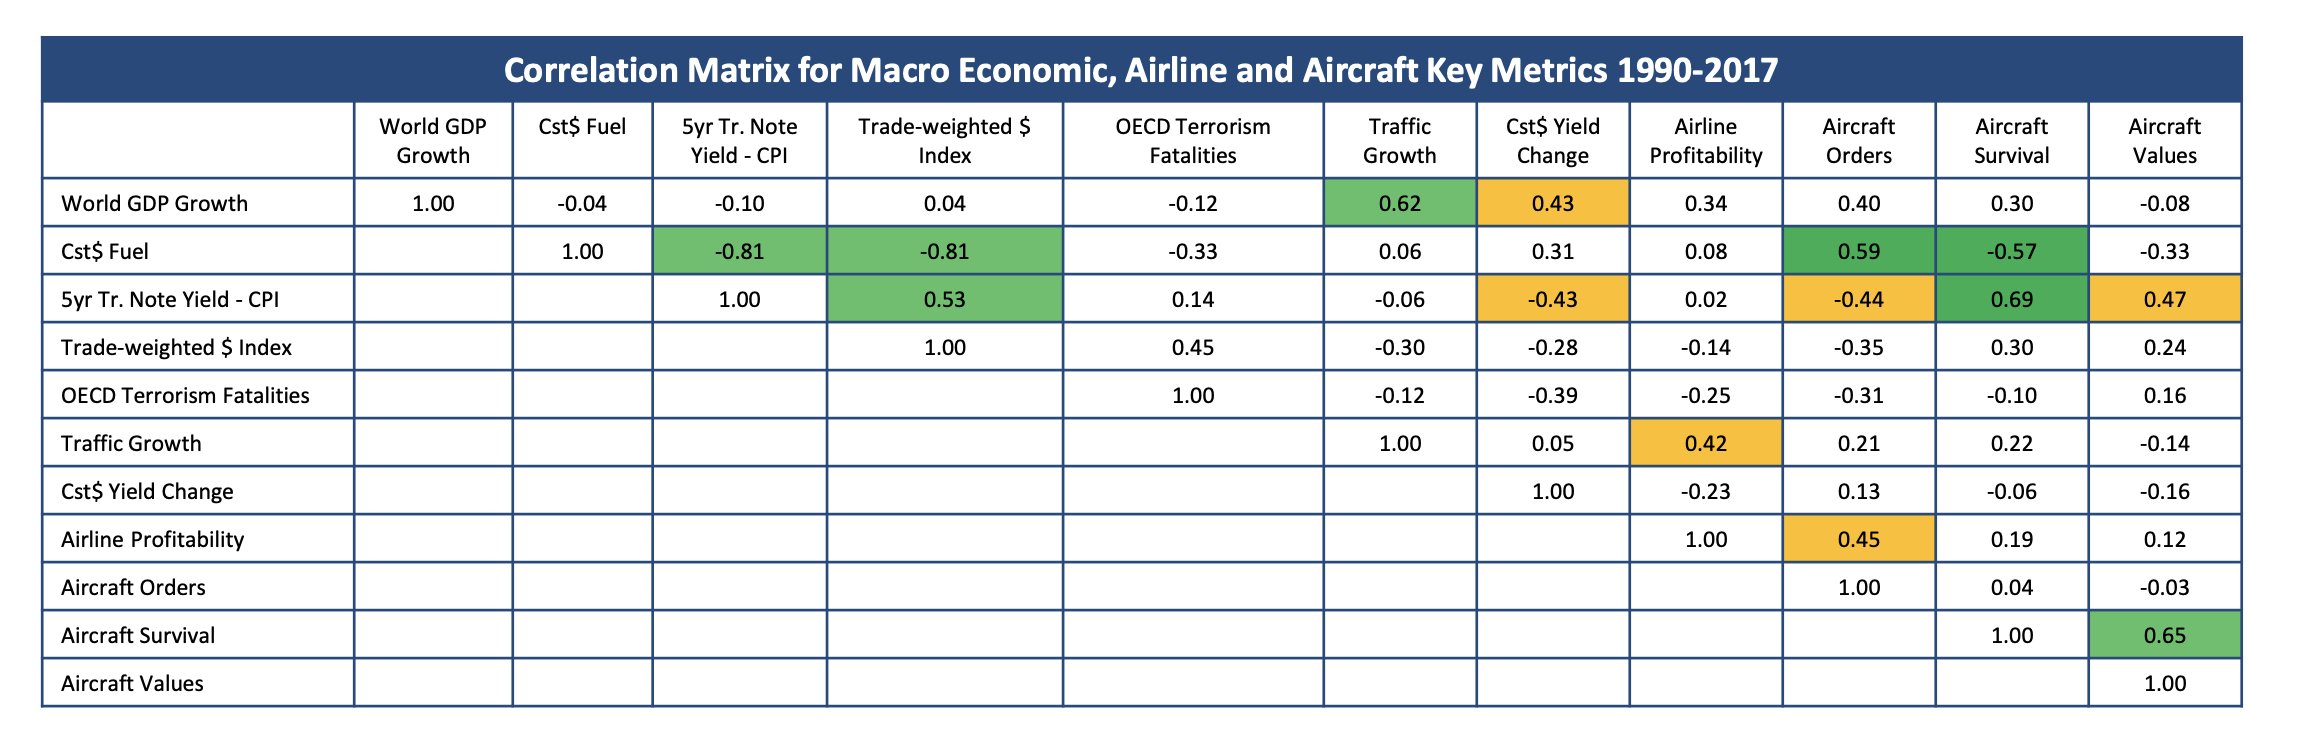
- Fuel prices and interest rates have an impact on aircraft orders and values
- Low fuel prices are good for used aircraft values as they reduce the benefit of new technology and discourage new aircraft orders
- High-interest rates are good for used aircraft as they increase ownership costs which are more interest rate sensitive for new aircraft
Correlation of greater than 0.5/-0.5
Correlation of greater than 0.4/-0.4
Sources: Airline Monitor, Avitas, Flight Fleets Analyzer, various US government statistical bodies, University of Maryland Global Terrorism Database