• Macro-Economic Background
• Traffic and Aircraft Demand
• New Aircraft Supply
• Airline Industry Financial Performance
• Special Topic – Why are Twin Aisle Aircraft Production Rates So Low?
Macro-Economic Background
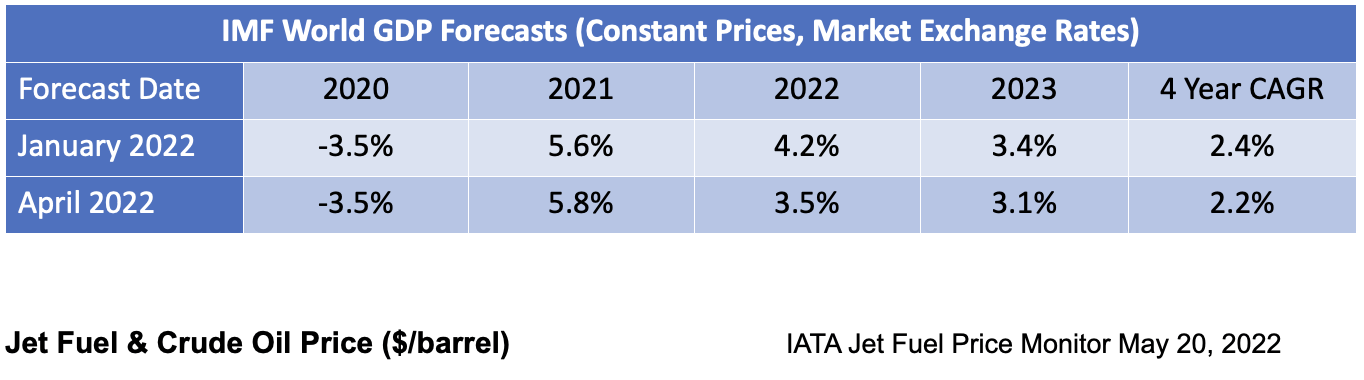
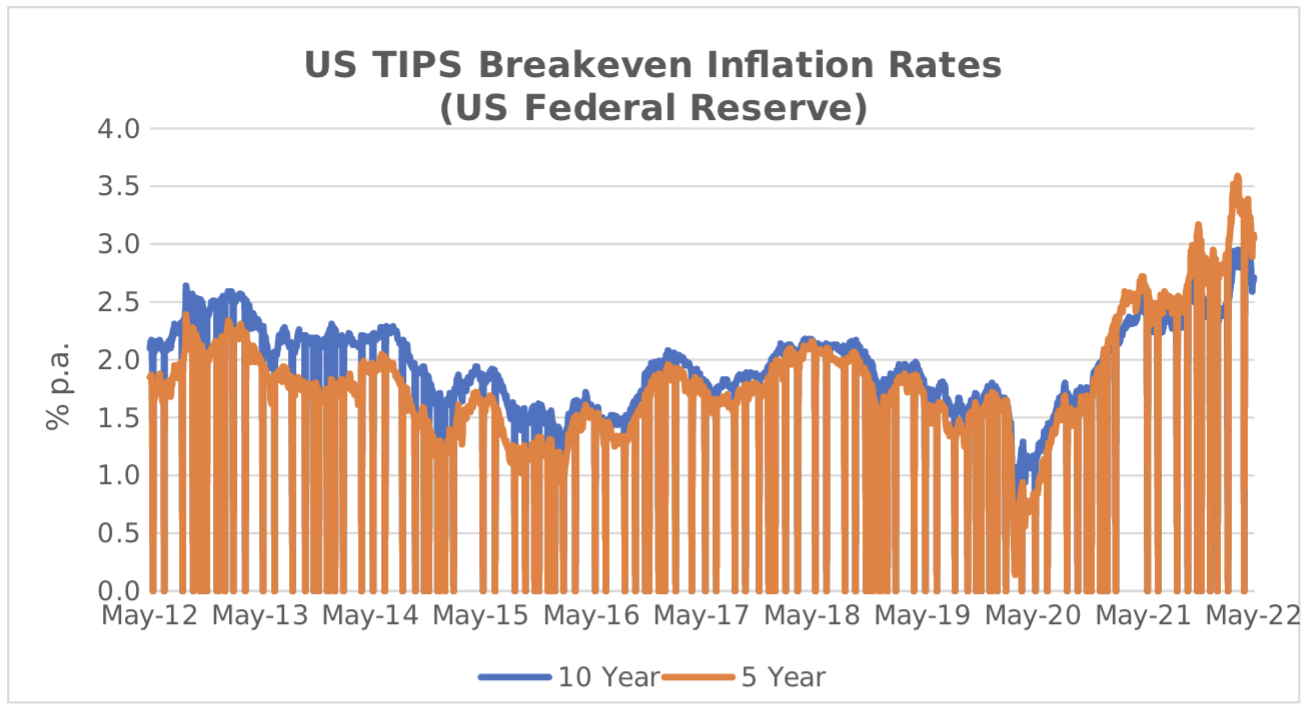
The IMF has continued to downgrade its forecast for world economic growth with significantly lower numbers for 2022 and 2023 only partly offset by an upward historic revision for 2021. The main change since January has been economic impact of the Russian invasion of the Ukraine. This has worsened the problems in global supply chains that were already leading to increased inflation. Global economic growth is vital to the long-term growth of air travel. However, in the next few years the key drivers of growth will likely be very specific to the airline industry, especially the recovery from the industry downturn caused by
the Covid 19 pandemic.
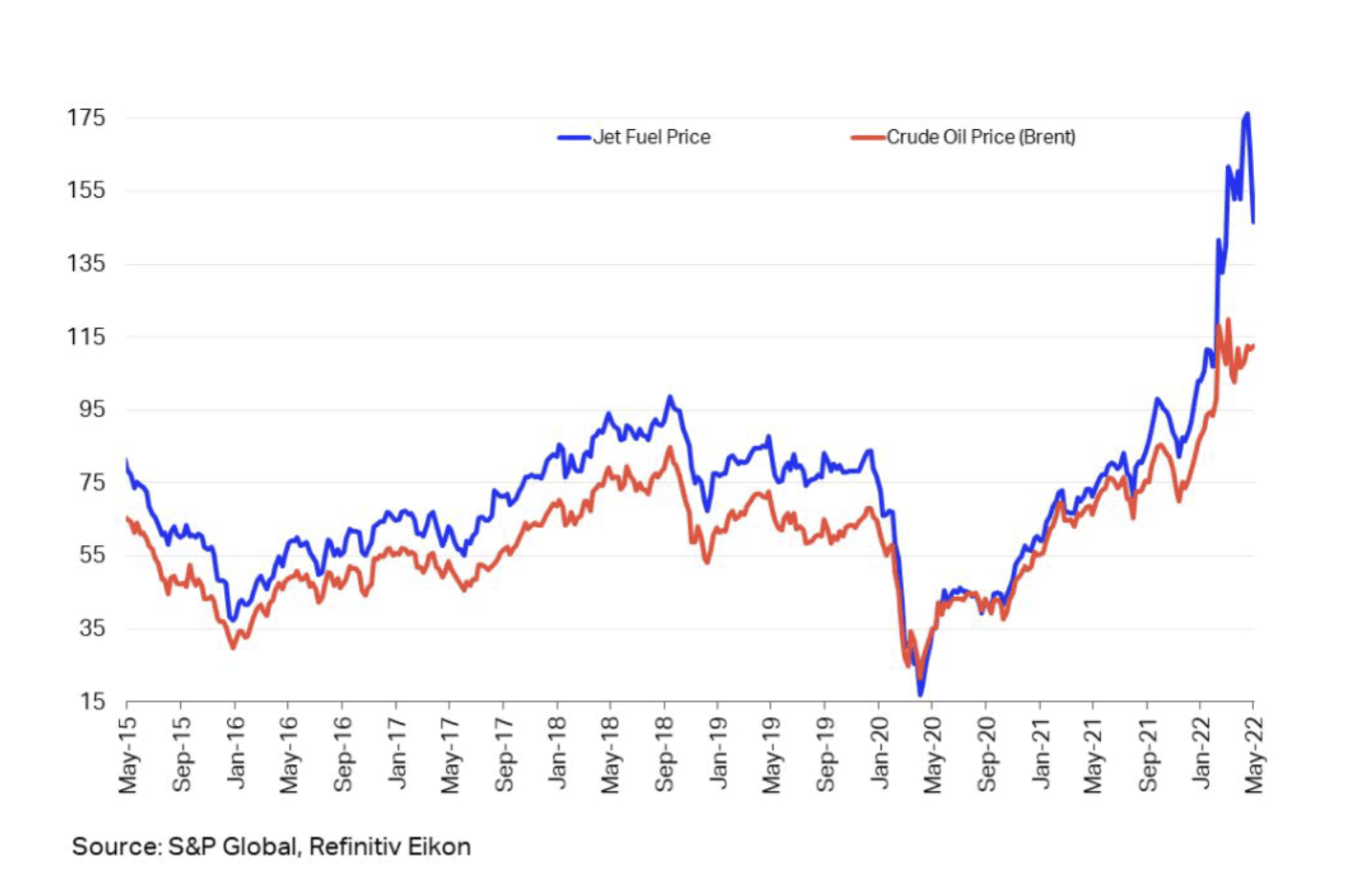
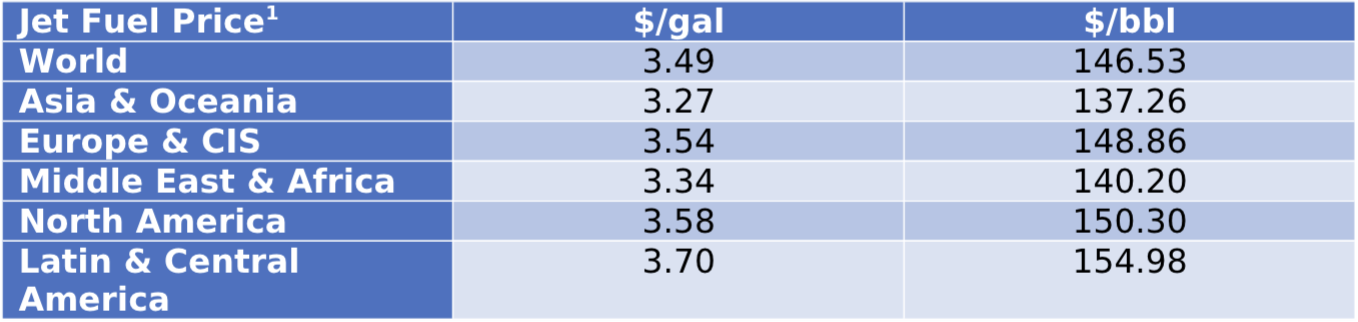
Fuel prices have spiked since February mainly due to an increase in the “crack spread” to record levels, rather than an increase in the price of crude oil. The crack spread is a function of the market for oil refining capacity which has clearly been disrupted by the economic shocks described above. Another symptom of this disruption is the wide divergence in jet fuel prices in different geographies.
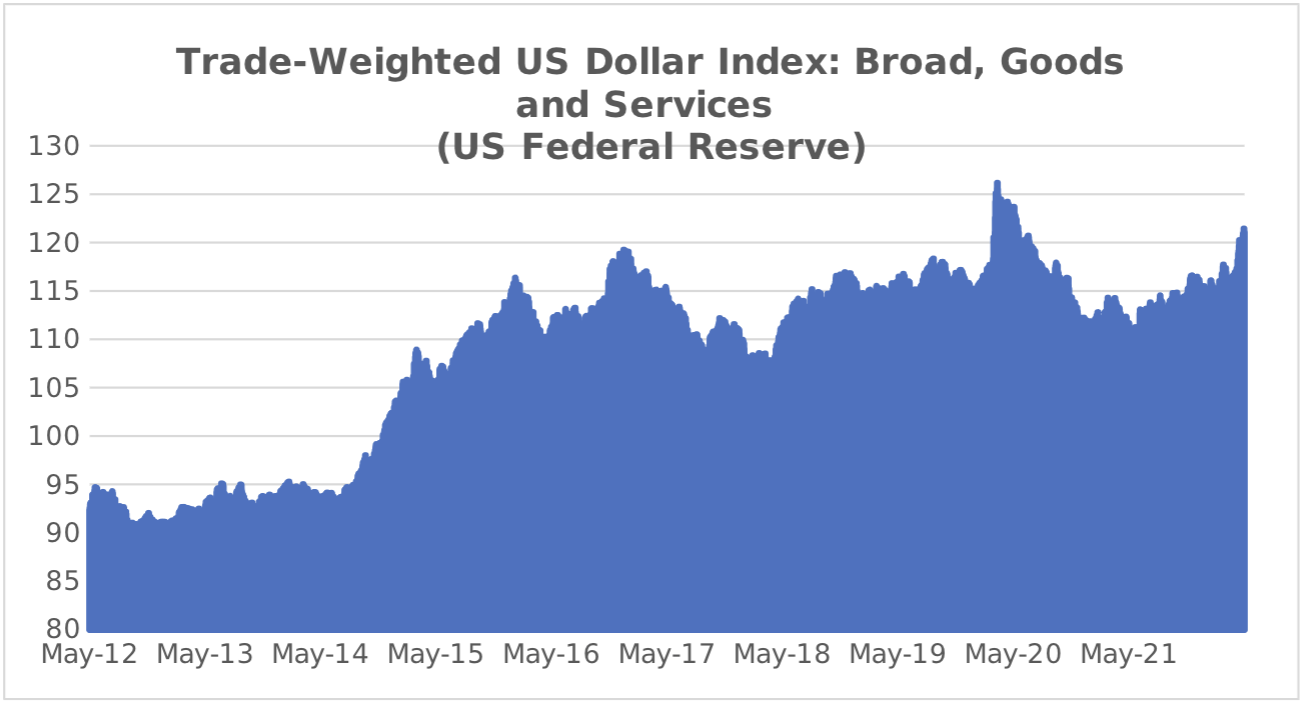
For airlines outside of the US this cost increase has been compounded by a strengthening US Dollar. This is a very important factor in airline financial performance because so many airline costs are typically US Dollar-denominated – not just fuel but also aircraft rents, debt service, aircraft, and spare parts.
Traffic and Aircraft Demand
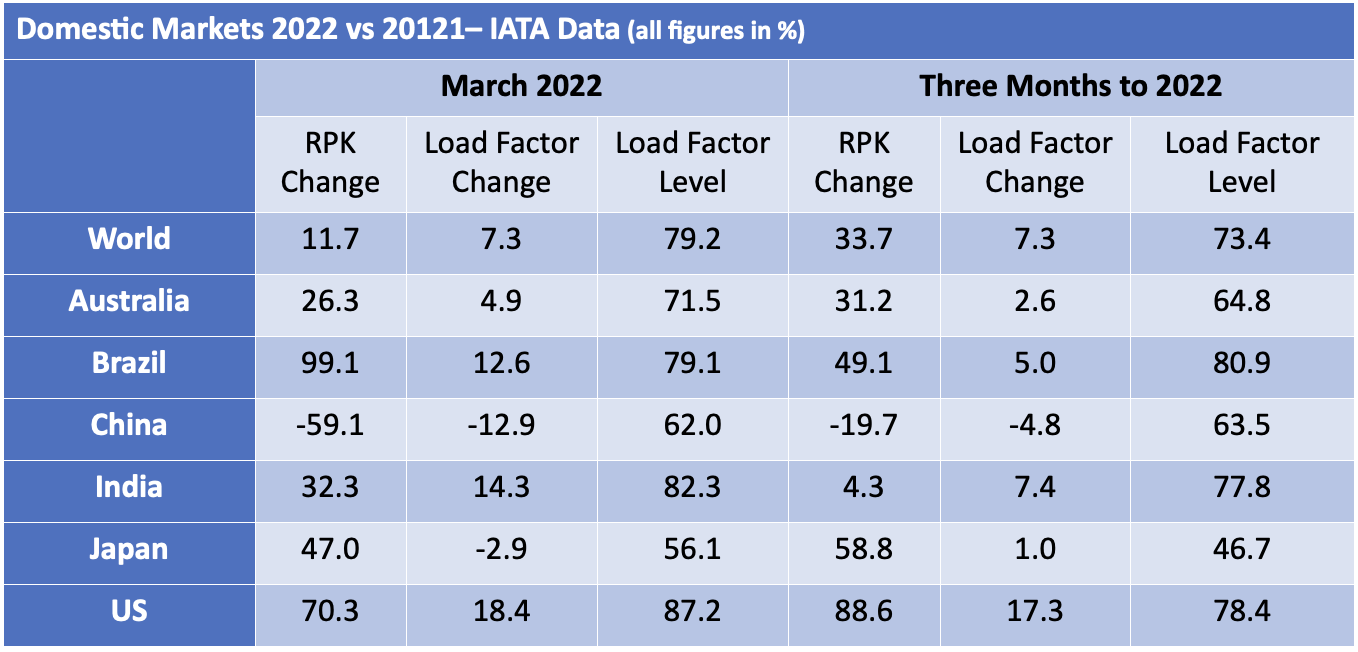
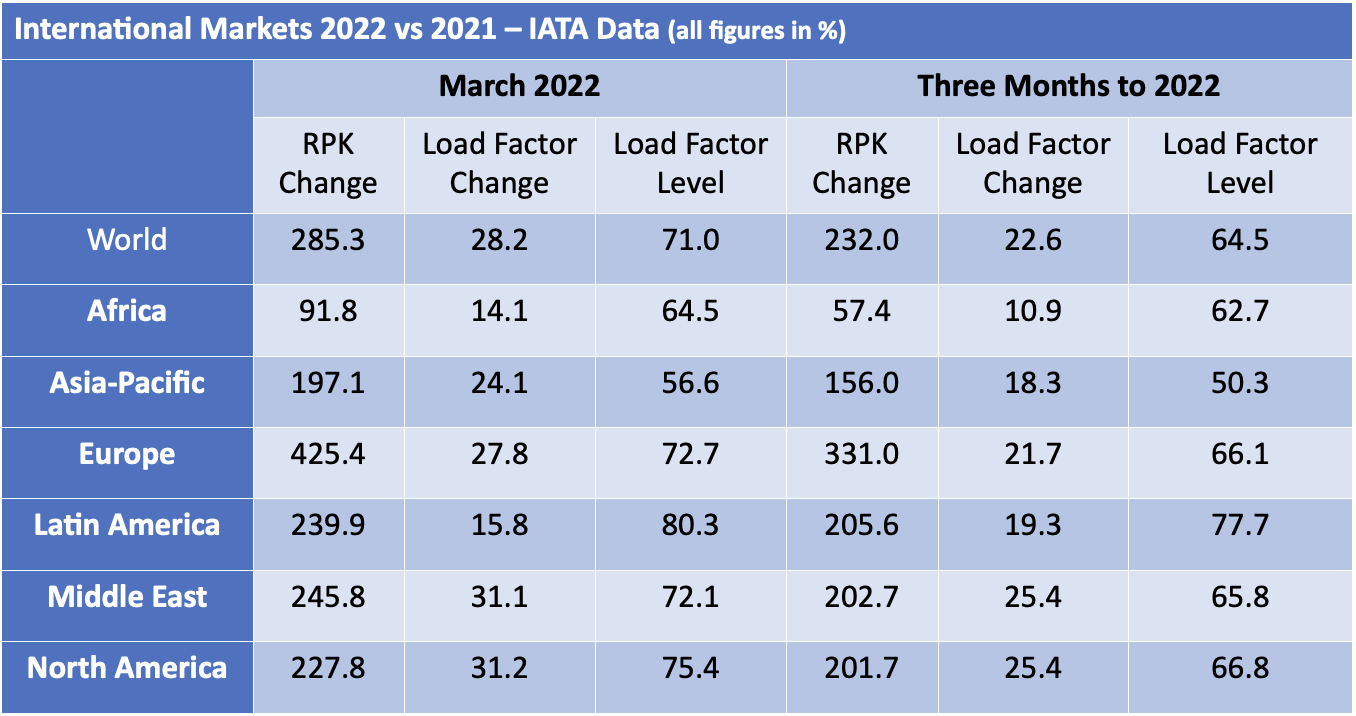
The first quarter of 2022 experienced what looks like the beginning of the long-awaited recovery in global airline traffic – there were particularly sharp traffic increases in Europe and the Middle East. However, traffic growth in Asia Pacific was very weak and actually declined year on year in March, mainly due to the disruptive effect of lockdowns on domestic Chinese RPKs. As the chart below shows global traffic remains well below 2019 levels, and a full recovery will require much greater relaxation of government interventions to combat the spread of Covid 19.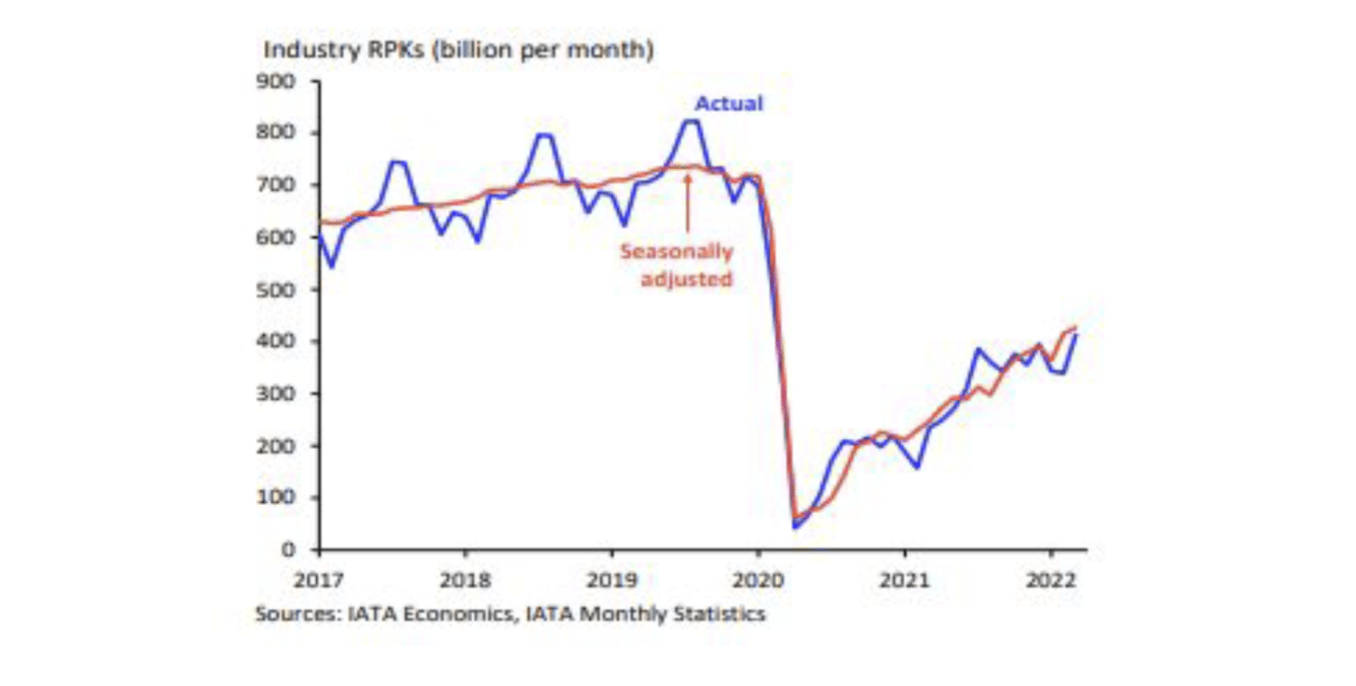
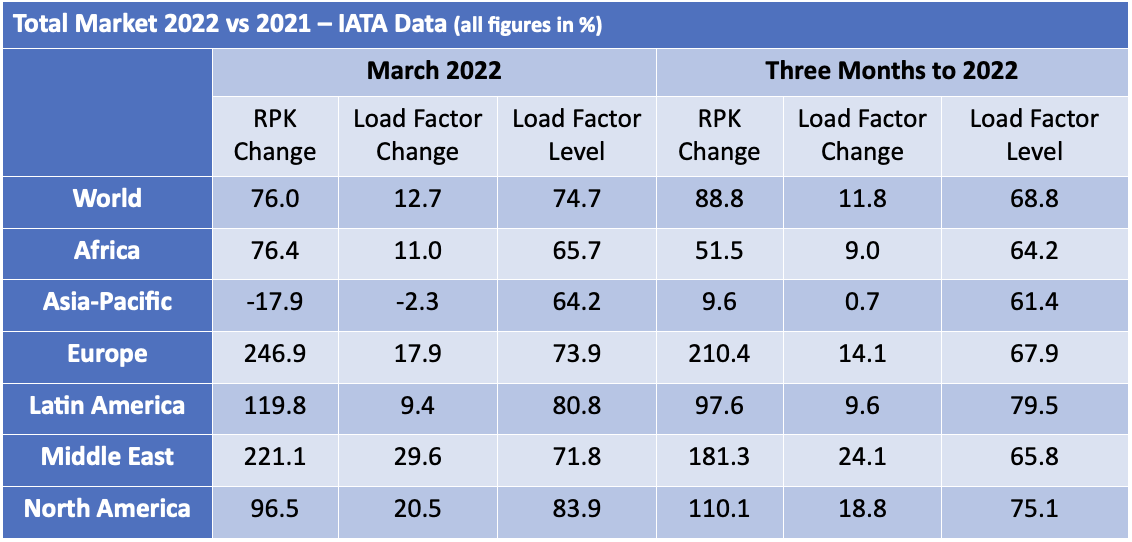
There was a much bigger increase in international traffic vs domestic traffic, mainly because the former was coming off a much lower base. The strongest international recovery was in Europe and barring further unexpected geopolitical events there is a very strong summer in prospect. It should be borne in mind that European international air travel includes much more short haul than other regions because geography limits the demand for domestic air travel outside of Russia.
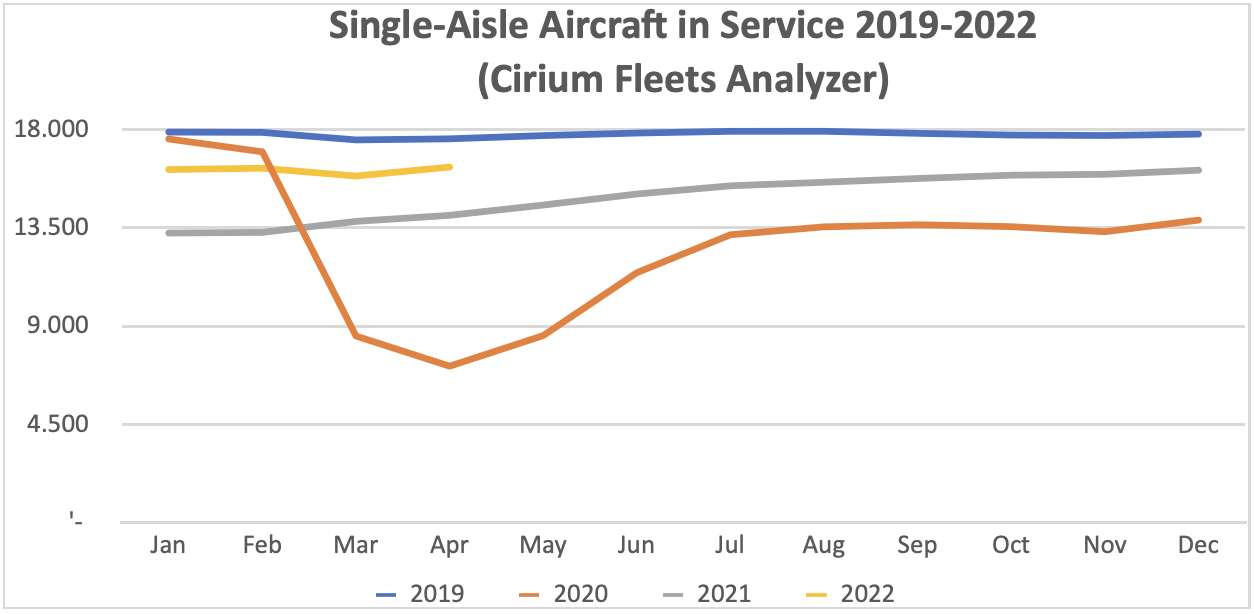
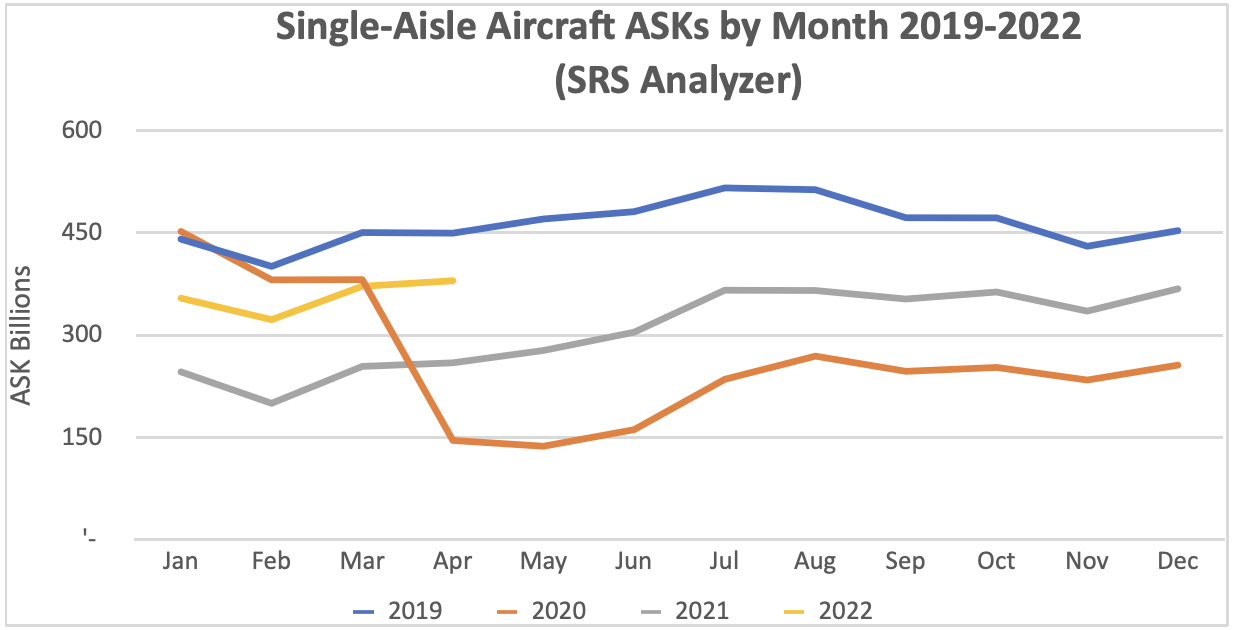
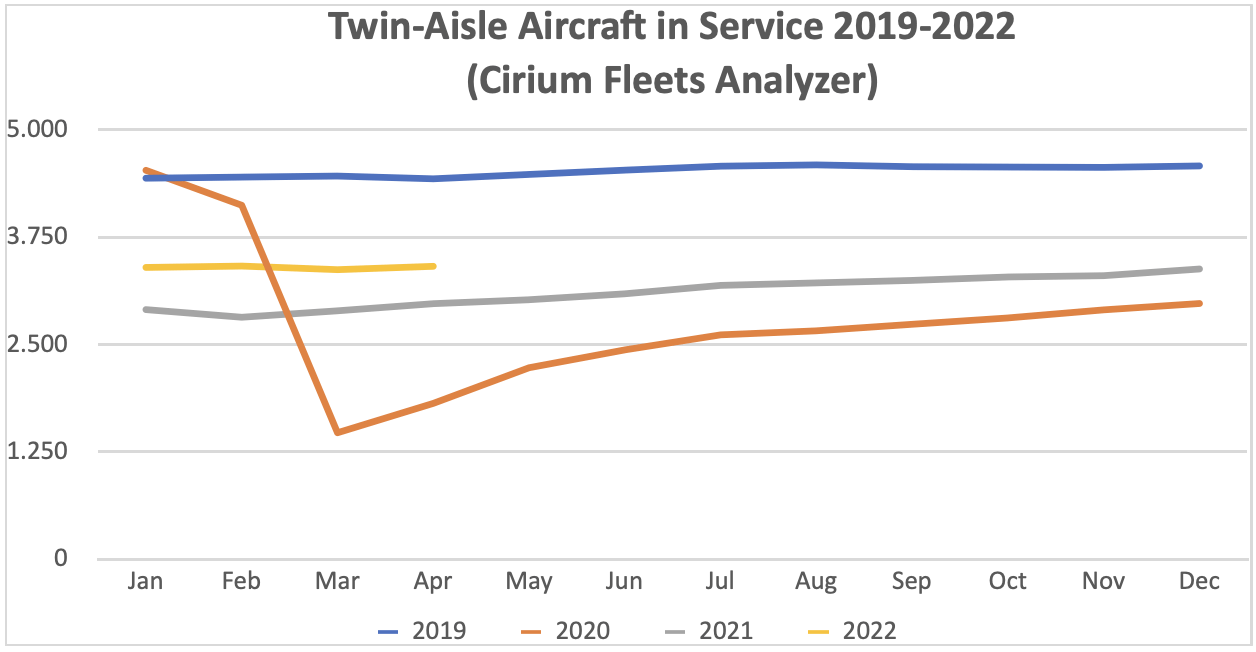
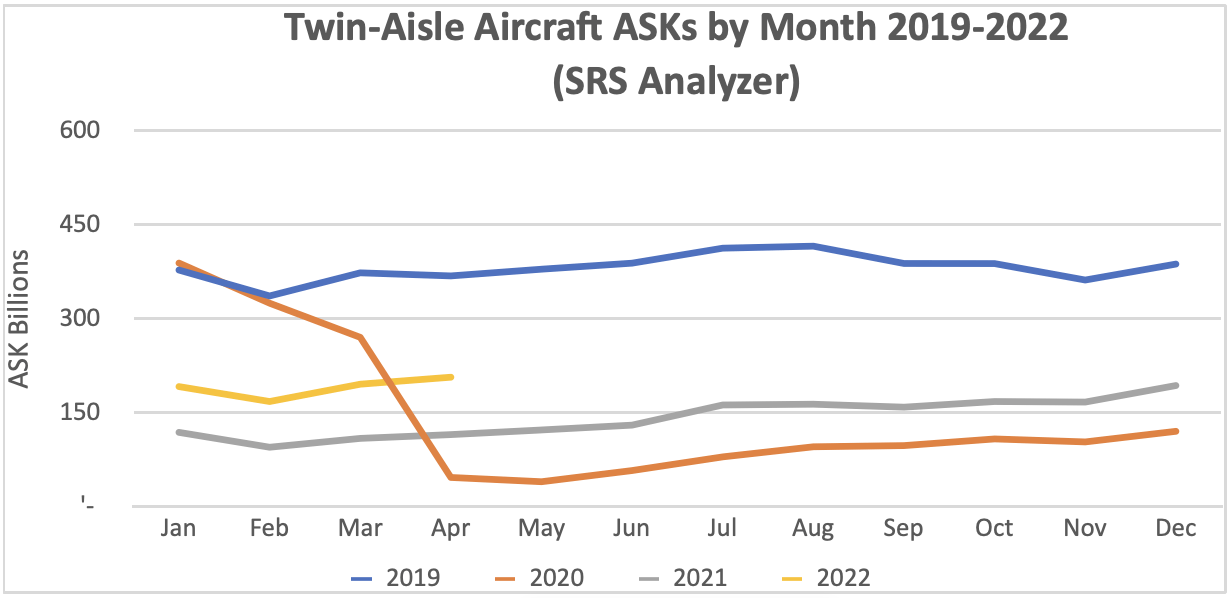
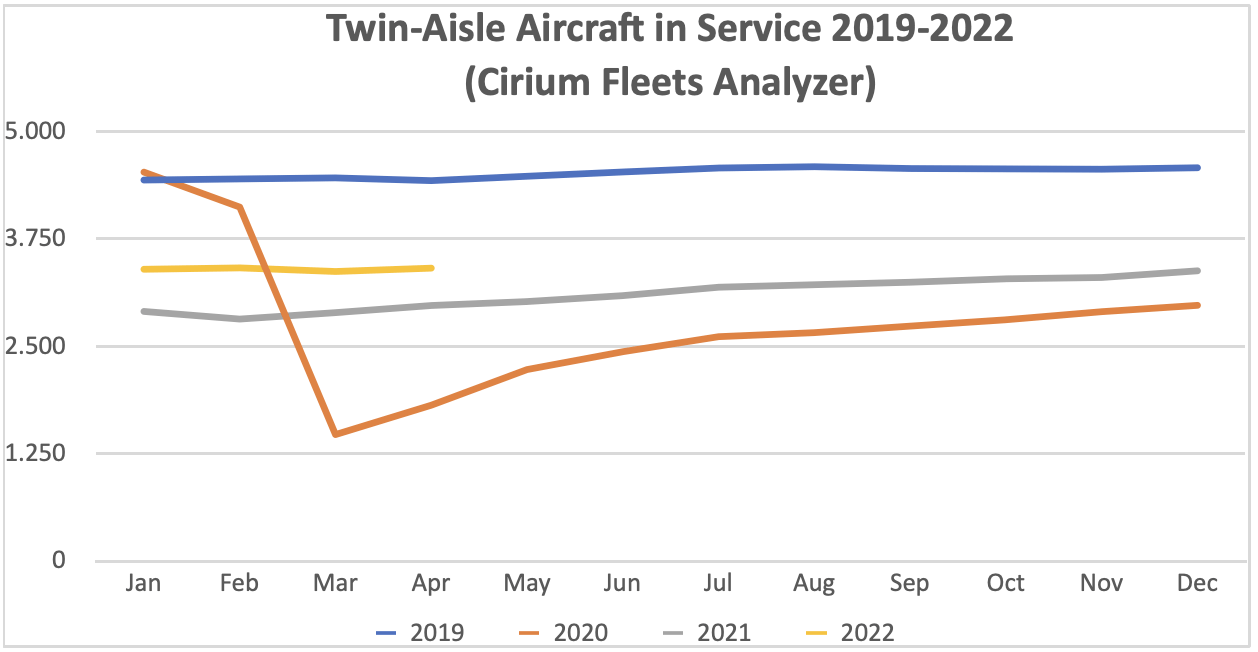
Although some short-haul aircraft serve international routes nearly all long-haul aircraft do so, and this is reflected in the relative demand for single-aisle (narrowbody) and twin-aisle (widebody) aircraft. Aircraft demand can be measured in terms aircraft in service and ASKs[1], the standard measure of aircraft capacity deployed by airlines which indicates how intensively aircraft are being flown. Single aisle aircraft in service levels are now very close to where they were in 2019 with a slightly weaker recovery in ASKs due to lower utilization. The comparable figures for twin aisle aircraft are much weaker.
New Aircraft Supply

The latest status of Airbus’s production plans is:
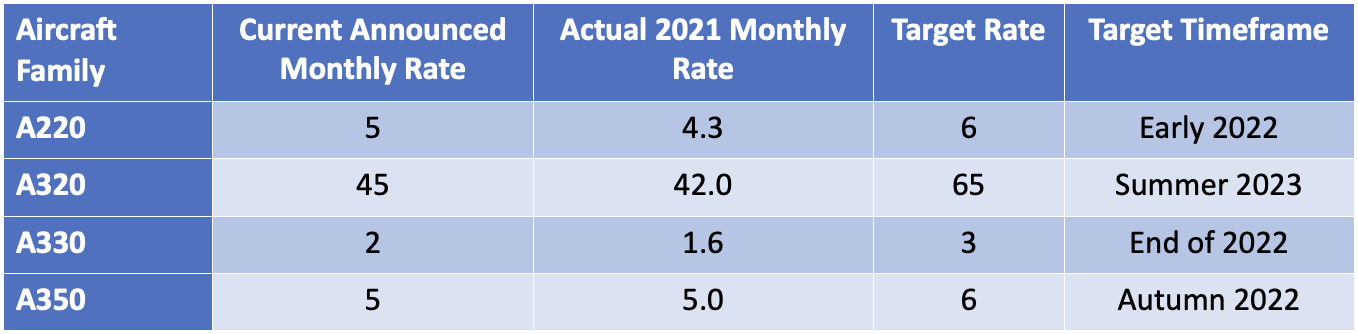
Airbus has recently announced that it will decide about future increases in A320 family production after 2023 by the middle of 2022. It is considering production rates of up to 75 per month by the middle of the decade but has to deal with significant supply chain problems and scepticism from some of its major lessor customers about the ability of the market to absorb this level of supply.
The A321 Neo now accounts for a majority of A320 family backlog – this is a very significant development because it suggests the trend for single-aisle aircraft to take market share from twin-aisle aircraft retains a lot of momentum and because Boeing has yet to develop a strong competitor to this aircraft type.
Although Airbus is in a much better position than Boeing (see below), it is reported that its deliveries are subject to widespread and significant delays.
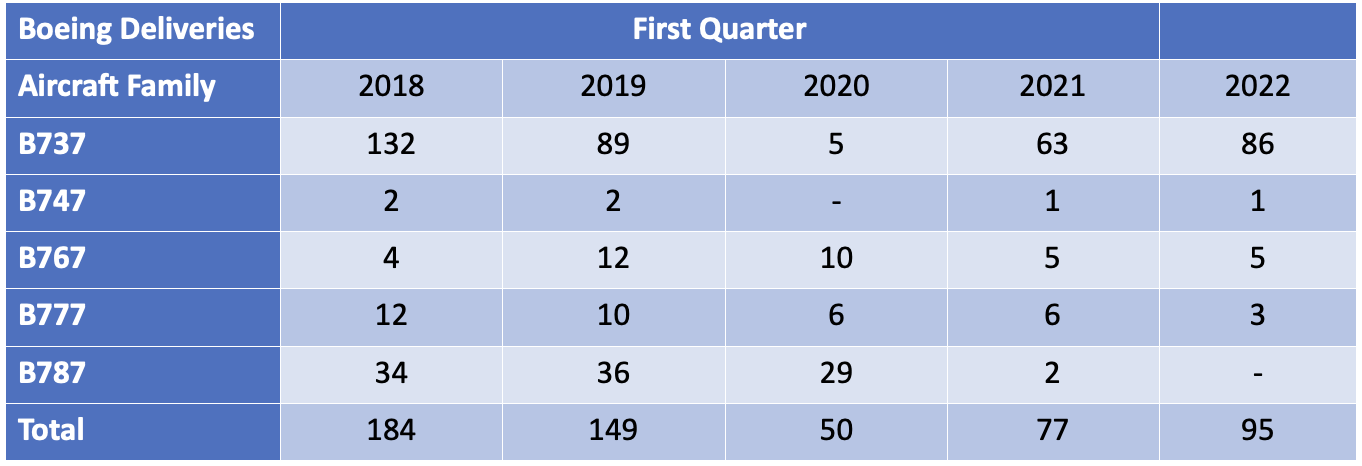
The latest status of Boeing’s production plans is:
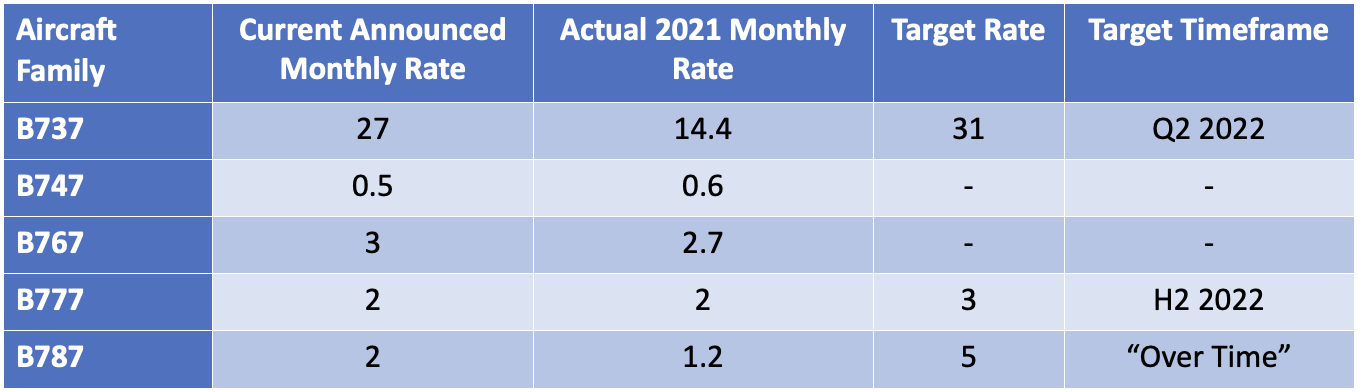
We have not been able to find any updates on Boeing’s inventory of undelivered B737 Max and B787 aircraft after December 2021, but we do not believe they have changed materially from 335 and 110 respectively. This is because Max deliveries of 86 in Q1 2022 were broadly in line with aircraft produced, and because there were no B787 deliveries production is very low.
Although the B737 max has successfully resumed production it still faces challenges. It has yet to be recertified by the Chinese authorities although this is expected to be resolved soon. Also, there is effective FAA certification deadline at the end of 2022 for the new B737 Max 7 and B737 Max 10 variants. If Boeing fails to meet this deadline these aircraft will have to be redesigned to add a new emergency alerting system, which would lead to delivery delays.
Boeing has also had quality and production problems with the B787, its main passenger twin-aisle product (nearly all B747, B767 and B777 deliveries are freighters or tankers) and has suspended deliveries since May 2021. Boeing is working with the FAA on certification issues and deliveries are expected to resume in 2022 but there is no firm guidance on timing.
Finally, it has been reported that entry into service for the B777X has been pushed back by a year until early 2025 because of certification difficulties with the FAA.
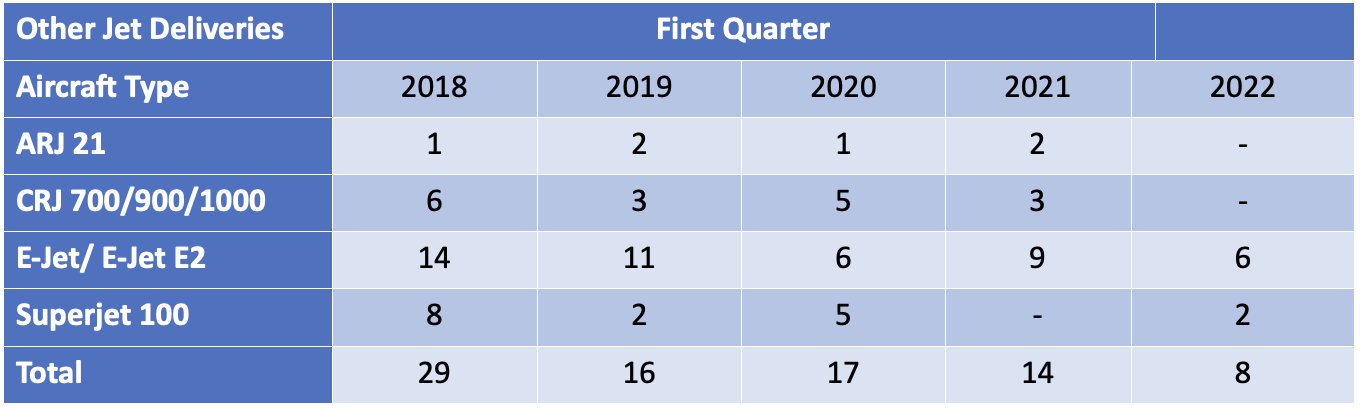
There has been no significant change in production levels of other aircraft manufacturers apart from the winding down of the CRJ programme.
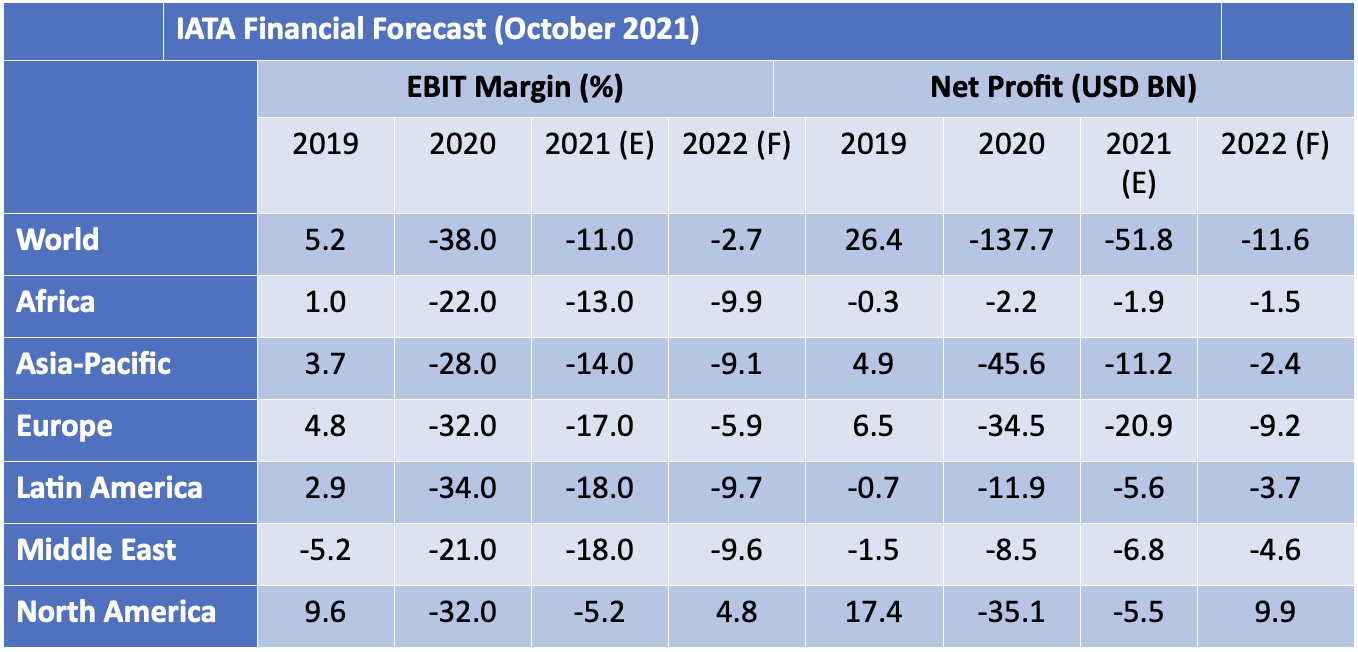
Airline Industry Financial Performance
IATA’s most recent October 2021 financial forecast shows the airline industry returning to a near breakeven in 2022. North America is set to be the first region to move back into profit and Europe is forecast to be the next best performer on an EBIT Margin basis. Europe’s relative performance is much better than in 2021 due to positive impacts of its Covid passport scheme and the re-opening of North Atlantic travel. We anticipate another forecast will be released by June 2022 and the most likely change will be a downward revision in the outlook for the Asia Pacific region due to the impact of renewed lockdowns in China.
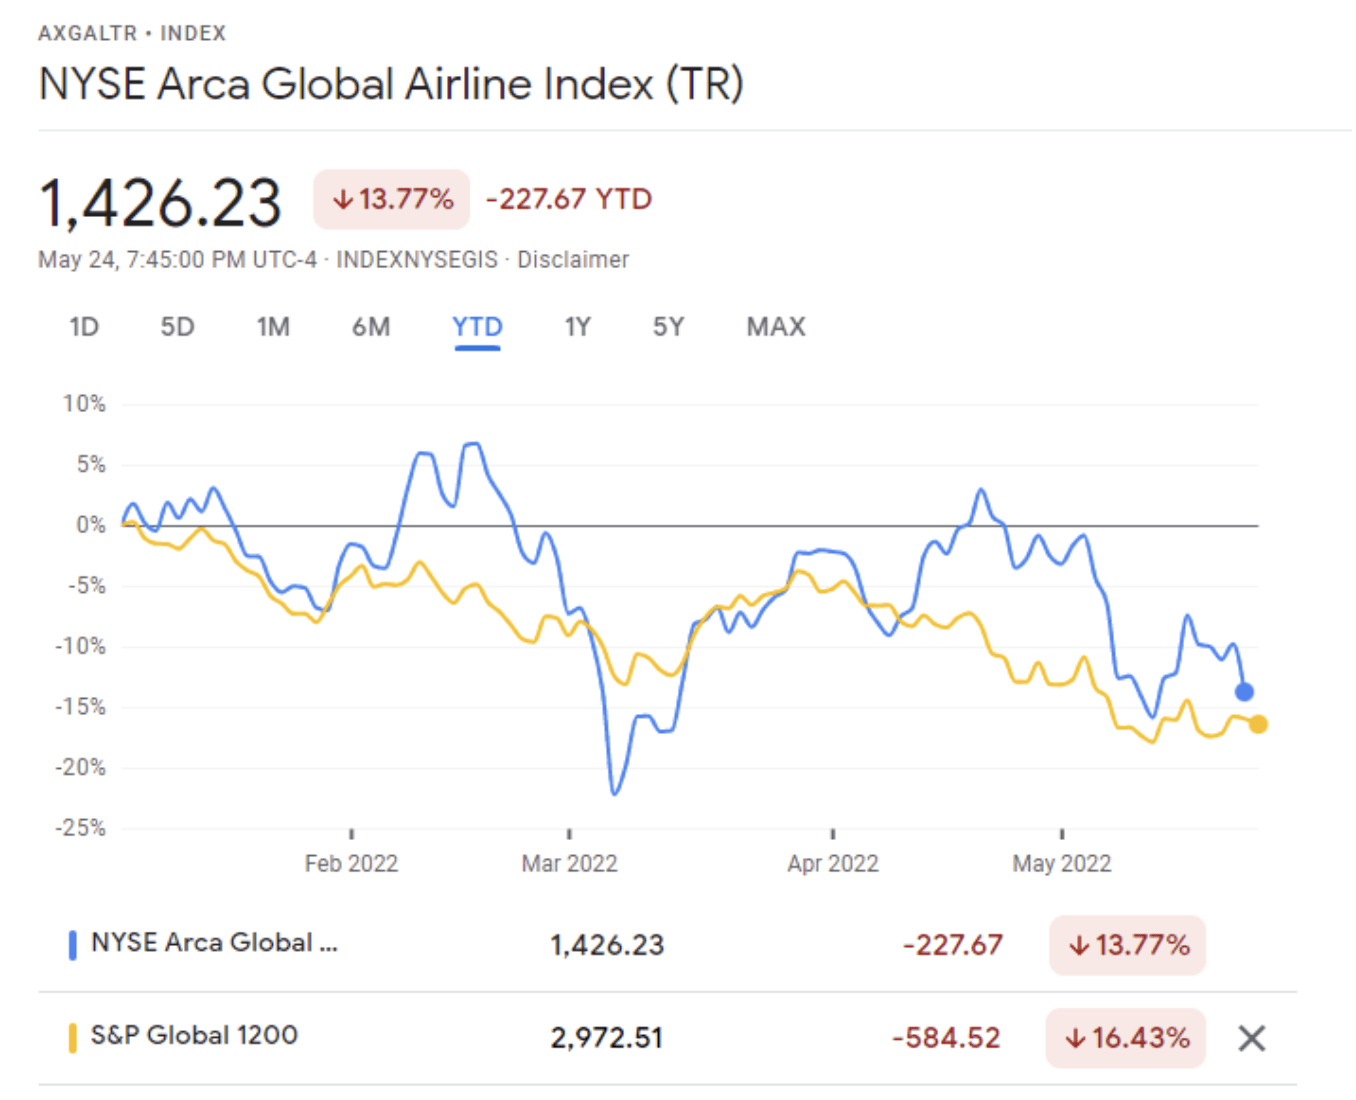
So far in 2022 airline shares have slightly outperformed the overall market. Since 2020 airlines have not recovered in line with the overall market because of the need to issue new stock to repair their balance sheets. This process is under way, with a recent announcement by Air France-KLM of its plan to sell €2.26BN of new shares following similar news from Air Asia, Air New Zealand, American Airlines, easyJet, El Al, Flyr, Garuda, Lufthansa and TUI.
The major airline credit event in Q1 2022 was obviously the effective confiscation of aircraft leased to Russian airlines by western lessors. Most of these lessors had taken out contingency insurance which they  believe provides full or partial financial compensation for their losses. However, those lessors who have reported since Russia’s invasion of Ukraine are writing off their net Russian exposure before any such compensation because their claims will be contested by their insurers and the timing of any resolution is uncertain.
For the most part Russian airlines are still operating these aircraft, but over time their ability to do so will be reduced by their lack of access to spare parts. This can be temporarily offset by cannibalisation of some aircraft, but the longer the current situation prevails the less likely it becomes that repossession provides an adequate remedy for the lessors even if it were possible. This is because it would be very hard to redeploy an aircraft outside of Russia without its records being in order, and this is unlikely to be the case where widespread cannibalisation has occurred.
The impact of Russia’s actions has been very owner specific as there has not been a significant increase in available aircraft – according to IBA only 32 of 514 aircraft in Russia before the invasion have been returned.
We have not been able to identify any significant airline failures outside Russia since the start of 2022. The largest was CGA Airlines of Colombia which never operated more than four aircraft. According to the aviation consultancy Ishka the number of airlines in bankruptcy/restructuring reduced from 17 in January to 10 in May with 701 aircraft affected[2]. Large airlines to recently emerge from bankruptcy/restructuring include Aeromexico, Avianca, CSA Czech Airlines and HNA Group.
Special Topic – Why are Twin Aisle Aircraft Production Rates So Low?
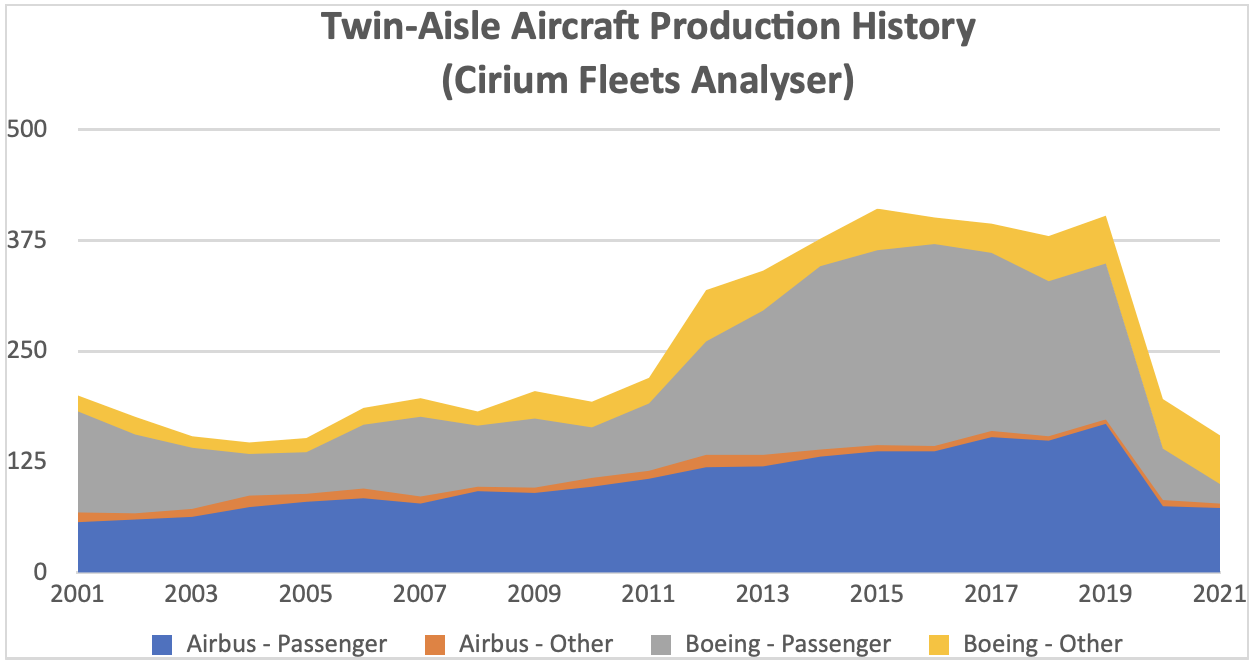
As discussed above Airbus are planning to increase A320 family production to record levels in the next few years and a big recovery in B737 Max deliveries is also very likely. The production outlook is very different for twin-aisle aircraft where the combined production targets for Airbus and Boeing are c. 180 aircraft a year, less than half the peak of c. 400 aircraft a year achieved from 2015 to 2019.
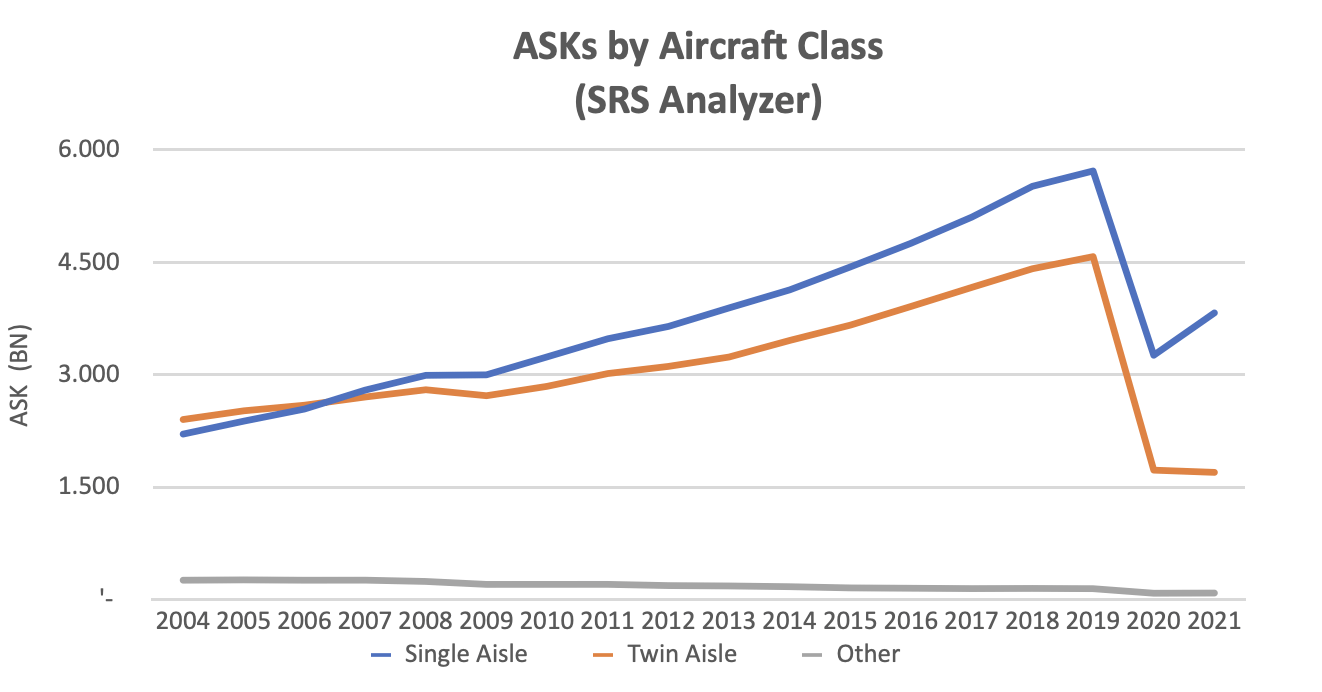
One important reason for this relative weakness is lack of demand. We have airline schedule data for ASKs back to 2004 from SRS Analyzer which shows a marked trend towards an increased share of capacity for single-aisle aircraft throughout this period. Part of this increase in single-aisle aircraft capacity came at the expense of smaller aircraft such as 50-seat jets and Turboprops included in “Other”, but the main source was twin-aisle aircraft.
Airlines will tend to replace twin-aisle aircraft with single-aisle where possible because they are cheaper and have better revenue potential. Cost savings are mainly driven by lower capital cost per seat as single-aisle aircraft do not have the structural enhancements to carry the additional fuel required for long-haul flights. Fuel costs per seat are similar and so are crew costs, because the larger seat capacity of twin-aisle aircraft is offset by higher cockpit crew salaries. Revenue potential is better because a smaller aircraft can profitably serve thin routes that would not be economic for a larger aircraft, and also a smaller aircraft can offer greater frequency on busy routes which is particularly attractive to business class passengers.
The obstacles to deploying more single-aisle capacity are range limitations and airport congestion. Single-aisle aircraft have offered greater range over time which has allowed them to substitute for twin-aisle aircraft – a typical example of substitution is the US transcontinental market which would have mainly been served by B767s in the 1980s and 1990s, but thereafter moved towards B737NGs and A321s. The chart below shows the increase in single-aisle capacity share for different route lengths up to 2018 (we stopped at 2018 to avoid analytical “noise” as a result of the Max grounding and Covid).
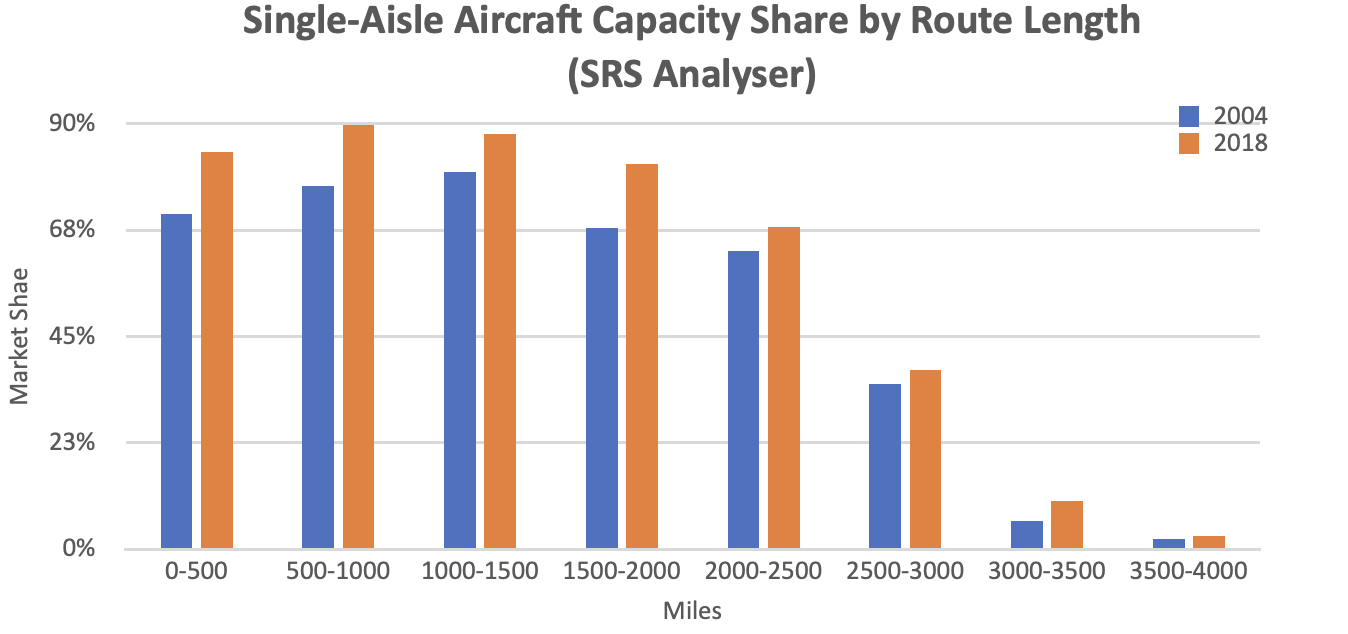
The successful introduction of the A321 Neo LR and A321 Neo XLR with ranges of 4,600 and 5,400 miles respectively and the greater range of other A320 Neo and B737 Max aircraft relative to their predecessors means that the trend towards more single-aisle capacity is likely to continue.
Airport congestion has proved to be less of a problem than anticipated in the past, partly due to increases in capacity but also because of the way airlines have developed their networks. The greater emphasis on point to point rather than hub and spoke networks has both reduced the pressure on hub airports and provided a better service to passengers. There are still routes where capacity constraints dictate the use of twin-aisle aircraft of short haul routes such as Beijing – Shanghai, but these are increasingly unusual cases.
We believe there is also an issue with the long-run supply of twin-aisle aircraft which is driven by the improved service life performance of long-range twin-engine types[3] (“LRTEs”). The most common way to measure service life is by survival curves. These curves show the percentage of passenger aircraft remaining in passenger service by age. Ultimately aircraft leave passenger service by being retired or converted to another use, predominantly freighter. Before this point there can be routine temporary exits from service for maintenance or change of operator, or non-routine storage in a market downturn as experienced in 2020-2021.
Aircraft classes and individual types can have very different service life performance, particularly where they are subject to rapid economic obsolescence. The chart below shows survival curves for different passenger aircraft classes and highlights the impact of such obsolescence on early technology aircraft such as the B707 and DC8 and more recently 50-seat jets. It also shows that twin-aisle aircraft have under-performed relative to single-aisles because they have been more impacted by improvements in technology and changes in the type of aircraft required by airlines due to the developments in route structures described above.
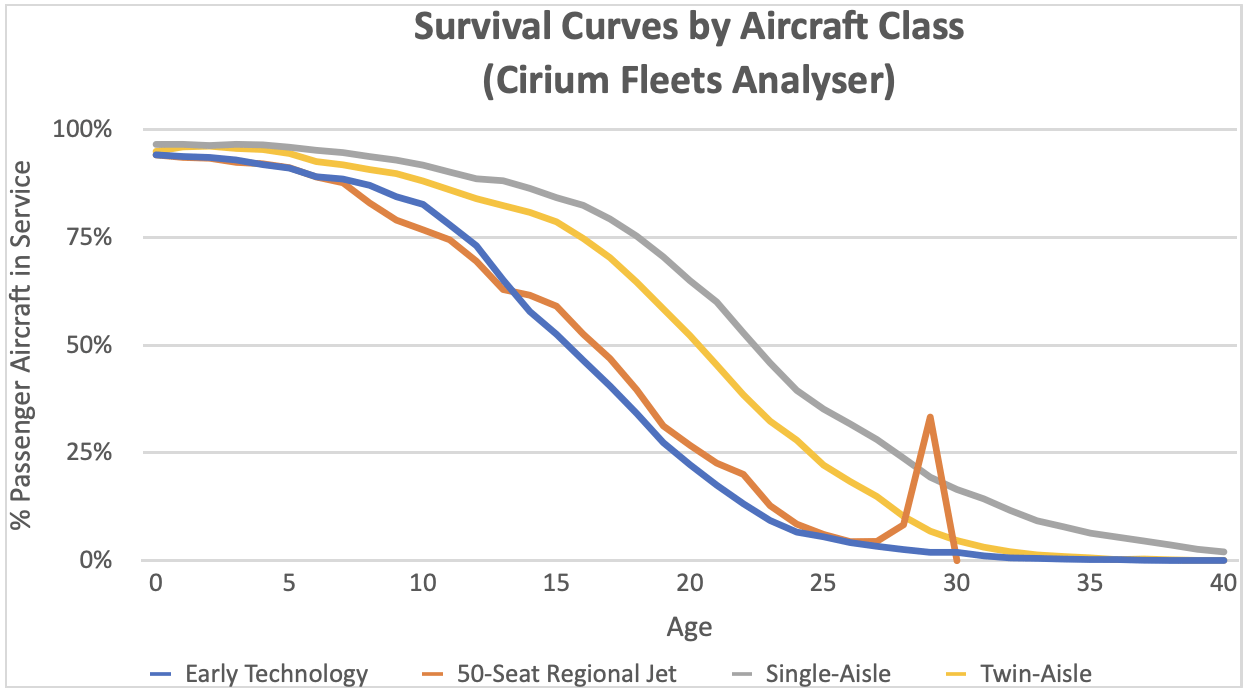
Survival curves are a key input for estimating future demand for new aircraft and in fact they are more useful than retirement age. There is a need to make subjective judgements in how to segment the available data as performance changes over time and allocating aircraft types to different classes should really group types with similar performance. For example, 50-seat jets perform very differently to other regional jets and the latter are more like larger single-aisle aircraft, so we segment on this basis. Also, all early technology types are single aisle but if you were to include them with their successors the resulting curve would be a poor guide to likely future performance by the modern types.
We suspect that demand for twin-aisle aircraft may have been over-estimated in the past because of an assumption that LRTEs would perform in line with other twin-aisle aircraft types. This was not an unreasonable assumption given that there was very little data to go on. However, with the benefit of hindsight there were good reasons why their performance would be different:
- A twin-engine aircraft in inherently cheaper to operate than a three or four engine aircraft
- Greater range allows an aircraft to serve routes that are not subject to single aisle competition
- Most LRTE types are 300 seats or less which fits better with point-to-point route structures.
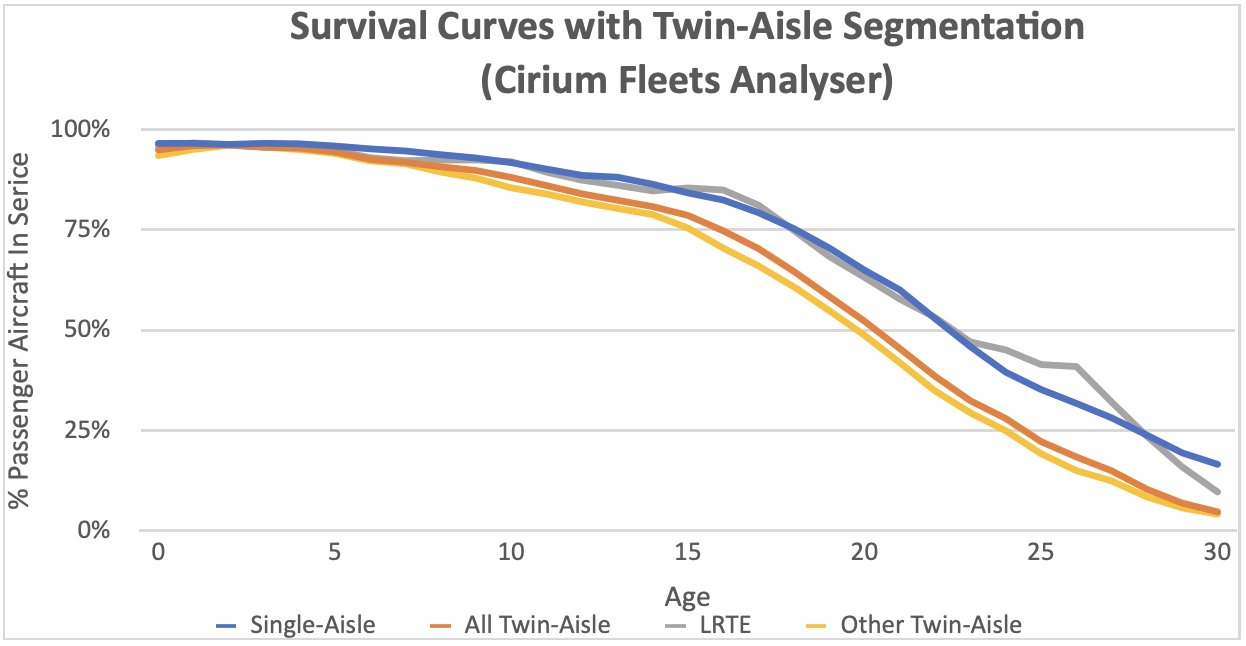
The chart below segments the performance of LRTEs vs other twin aisle aircraft types and shows their performance is much stronger. While this is ultimately good news for owners it does mean that future demand for new aircraft is likely to remain subdued. This analysis helps to explain why it was very hard for lessors to place twin aisle aircraft in 2019 before Covid arrived. Our proprietary forecast model showed minimal excess capacity in the twin-aisle market without segmentation of in-service performance, but a large surplus with it. We believe that current and planned production rates are low enough that this surplus will be eliminated over time, but it will be a while before we see 400 twin-aisle aircraft delivered in a year.
Disclaimer
This document is for informational purposes only. It is not intended as advice or a recommendation with respect to any transaction. The recipient of this document shall be solely responsible for making its own independent investigation and appraisal of any transaction. No market or company data or other information is warranted or guaranteed by Sirius Aviation Capital as to its completeness, accuracy, or fitness for a particular purpose, express or implied, and such data and information are subject to change without notice. Any comments or statements made herein reflect the assumptions, views, and analytical methods of the persons that prepared this document as of its date of preparation, and do not necessarily reflect the views of Sirius Aviation Capital. Sirius Aviation Capital may have issued, and may in the future issue, other communications that are inconsistent with, and reach different conclusions from, the information presented herein. Sirius Aviation Capital specifically disclaims any obligation to update this document, or any comments or statements contained herein.
[1] ASKs is the acronym for available seat kilometres, which is the product of the number of seats flown and distance flown.
[2] Fleet totals are based on data as of January 2020.
[3] These aircraft types are the A330-200, high gross weight variants of the A330-300, A330 Neo, A350, B767-200ER, B767-300ER, B777-200ER, B777-300ER, B777LR and the B787.