
• Macro-Economic Background
• Traffic and Aircraft Demand
• New Aircraft Supply
• Airline Industry Financial Performance
• Special Topic – Aircraft Leasing Industry Consolidation
Macro-Economic Background
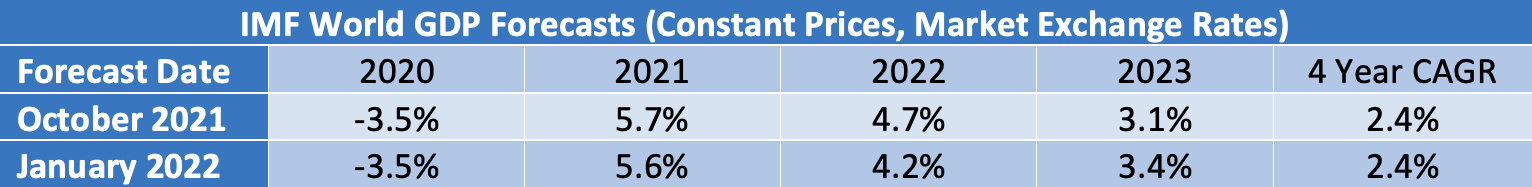
The tone of the IMF’s latest world economic forecast is rather downbeat. The headline reads” Rising Caseloads, a Disrupted Recovery, and Higher Inflation”. However, their revised forecast shows no material change in the overall four-year compound annual growth rate from 2020 to 2023, with reductions in 2021 and 2022 being offset by a stronger recovery in 2023. The increase in general inflation may present an opportunity for airlines to pass on some increased costs such as higher fuel prices.
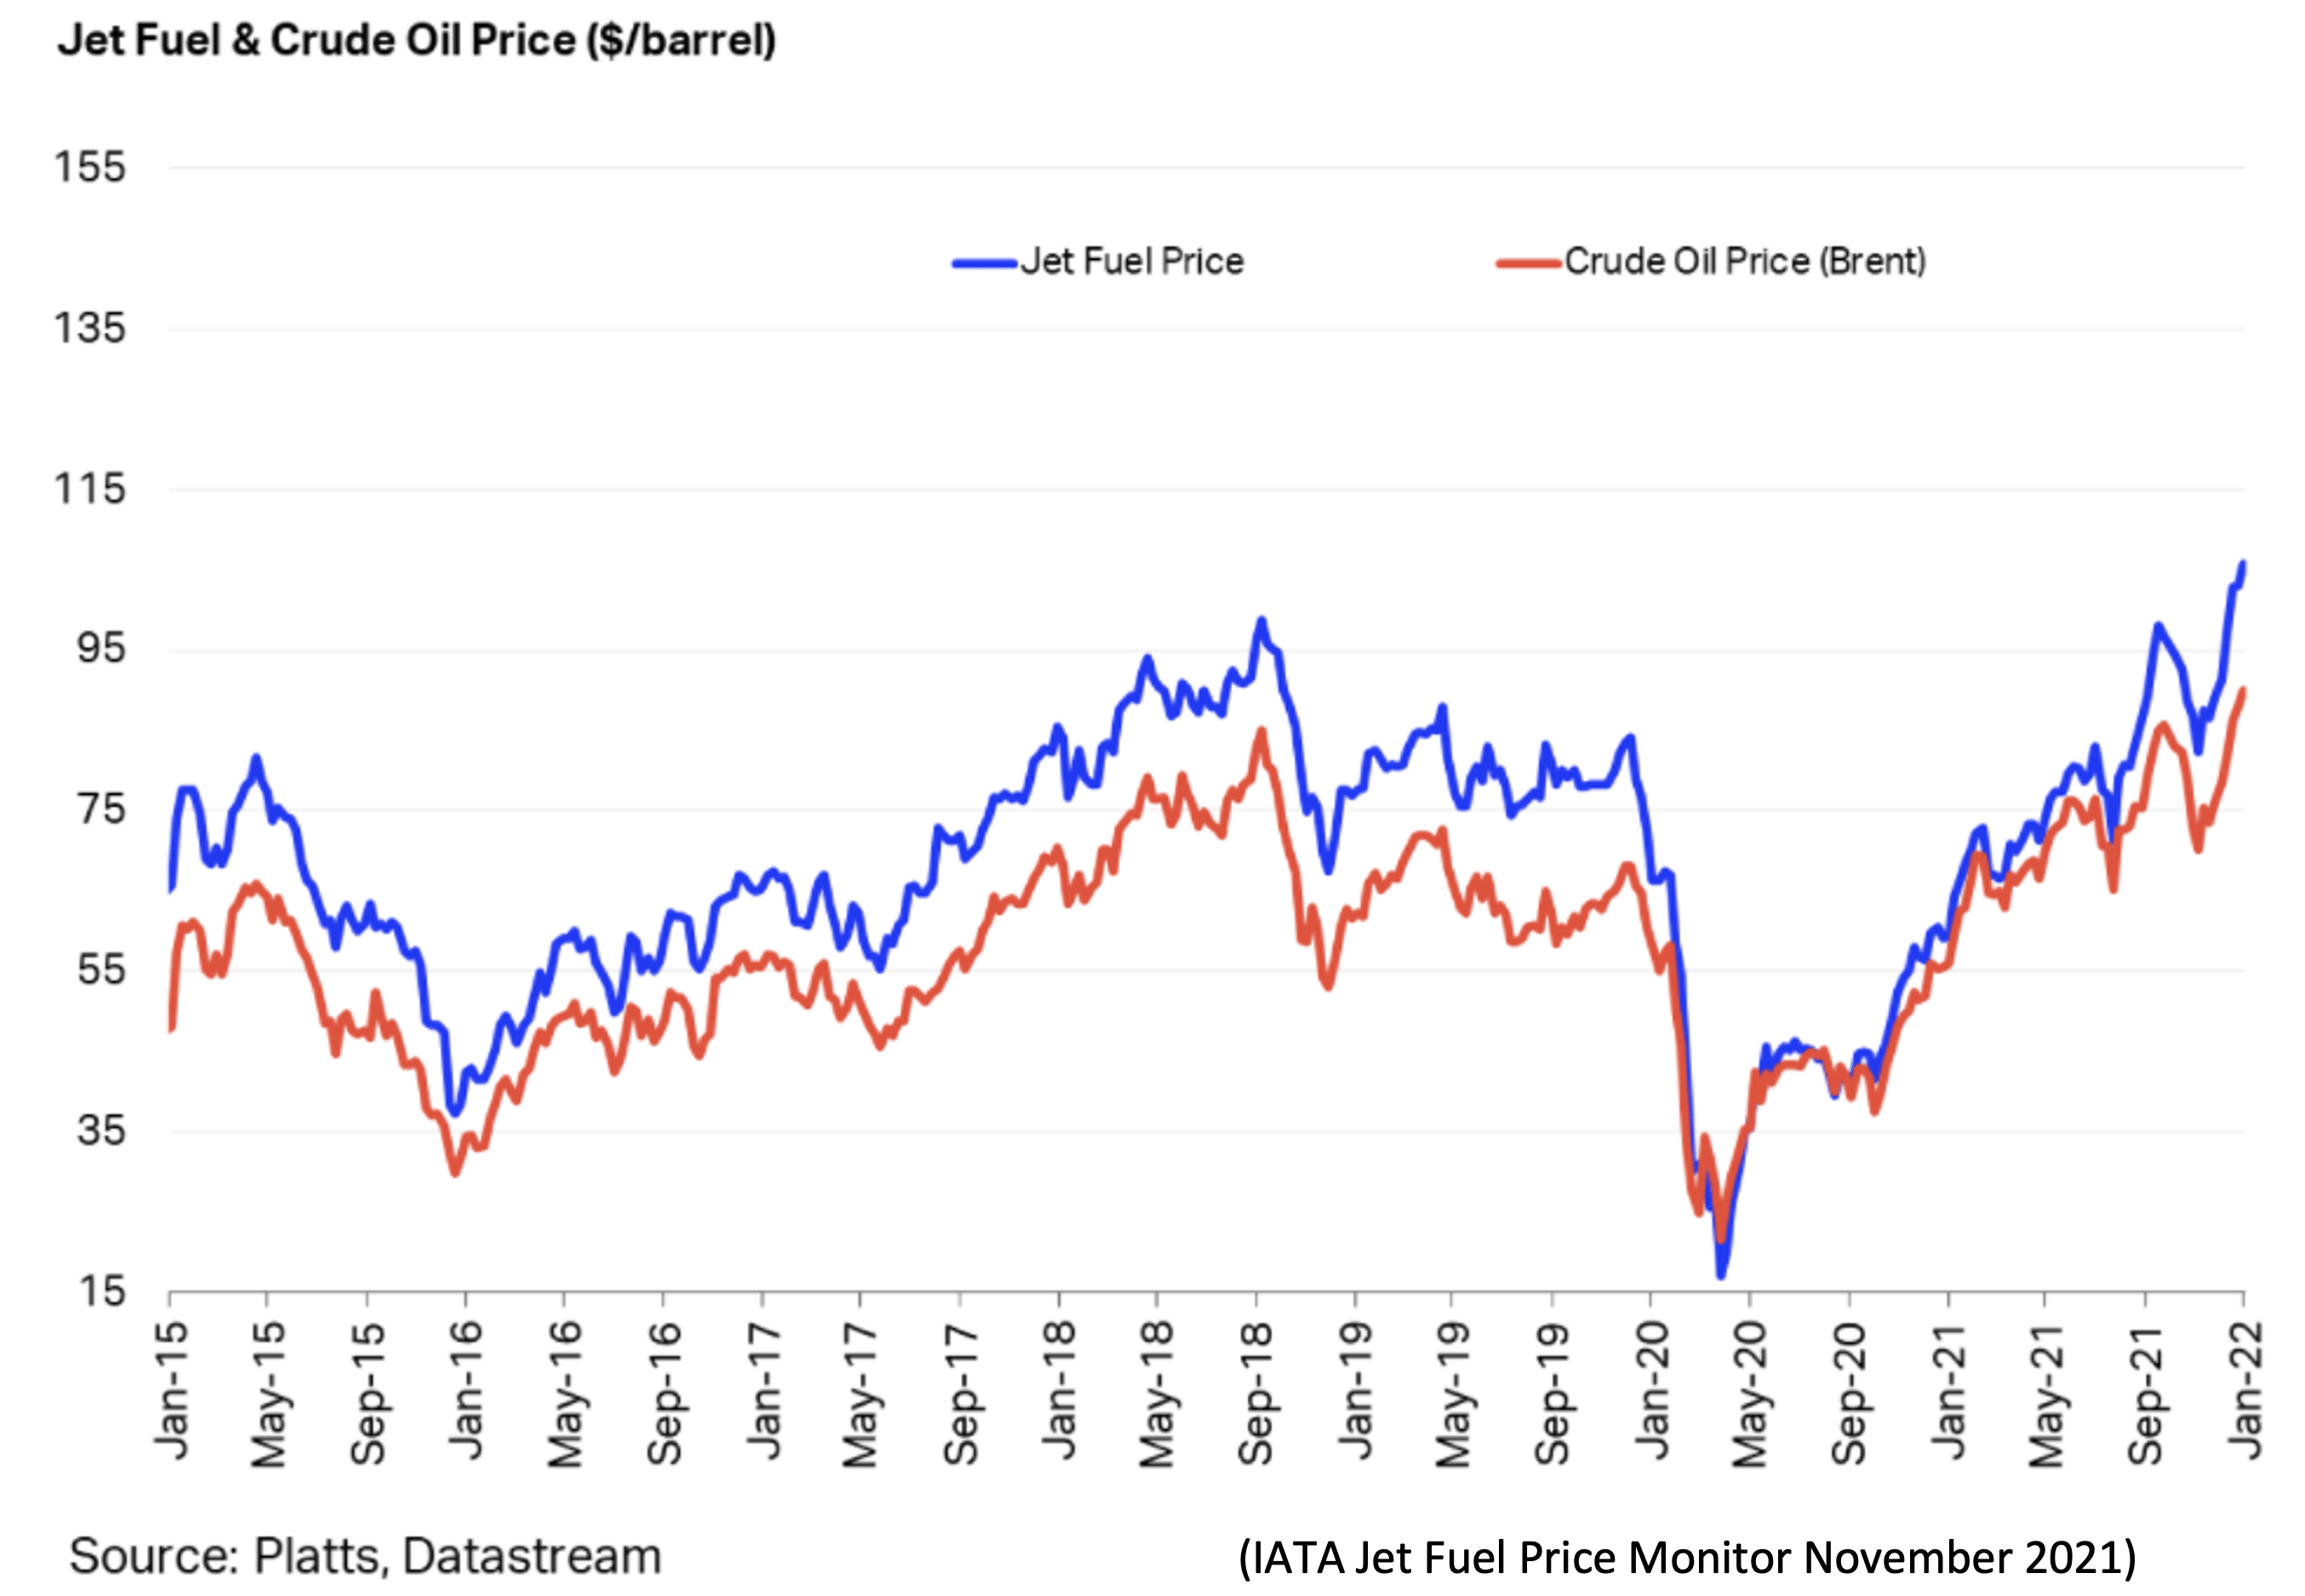
The price of jet fuel continued to increase in Q4 2021, driven by the increase in the price of crude oil and by the return of the “crack spread”[1] to more normal historical levels. Today’s price is a little higher than in 2018, which was a good year for the airline industry, so the current price is not an existential threat. However, it will reduce the airlines’ financial flexibility and at the margin will encourage them to prioritize profit margins over traffic growth as it will increase their break-even load factor.
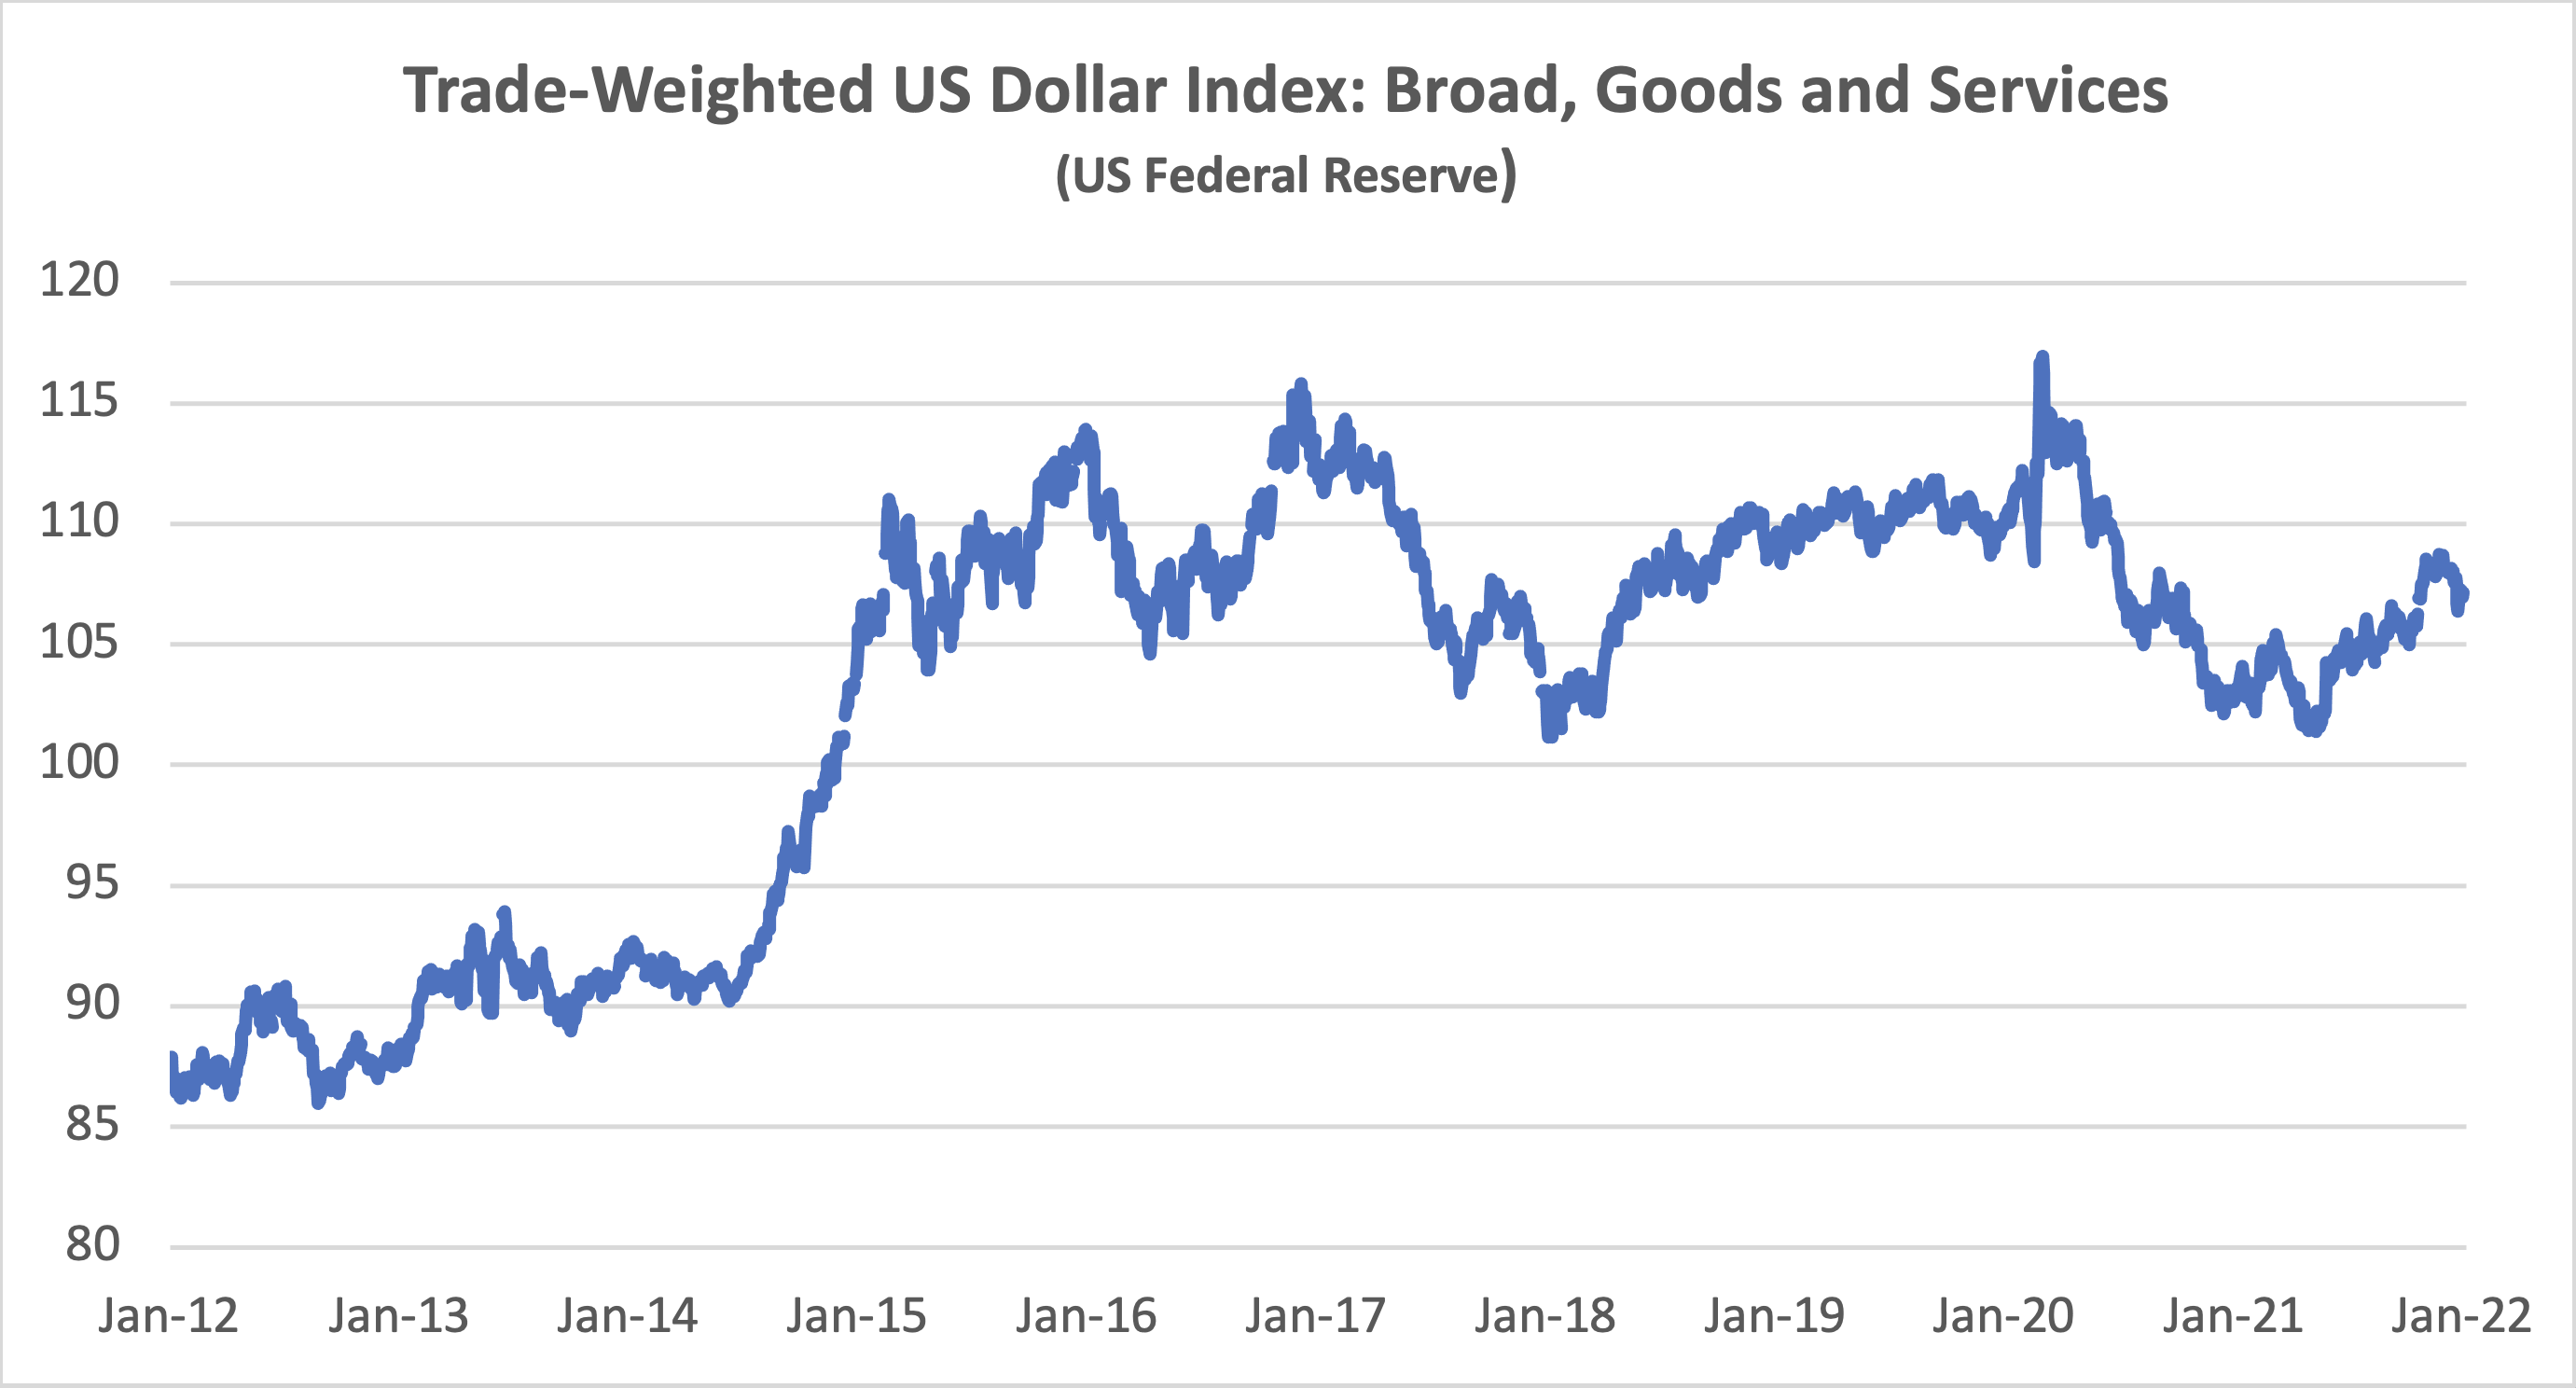
For airlines outside of the US this negative continues to be offset by a weaker US Dollar. This is a very important factor in airline financial performance because so many airline costs are typically US Dollar-denominated – not just fuel but also aircraft rents, debt service, aircraft, and spare parts.
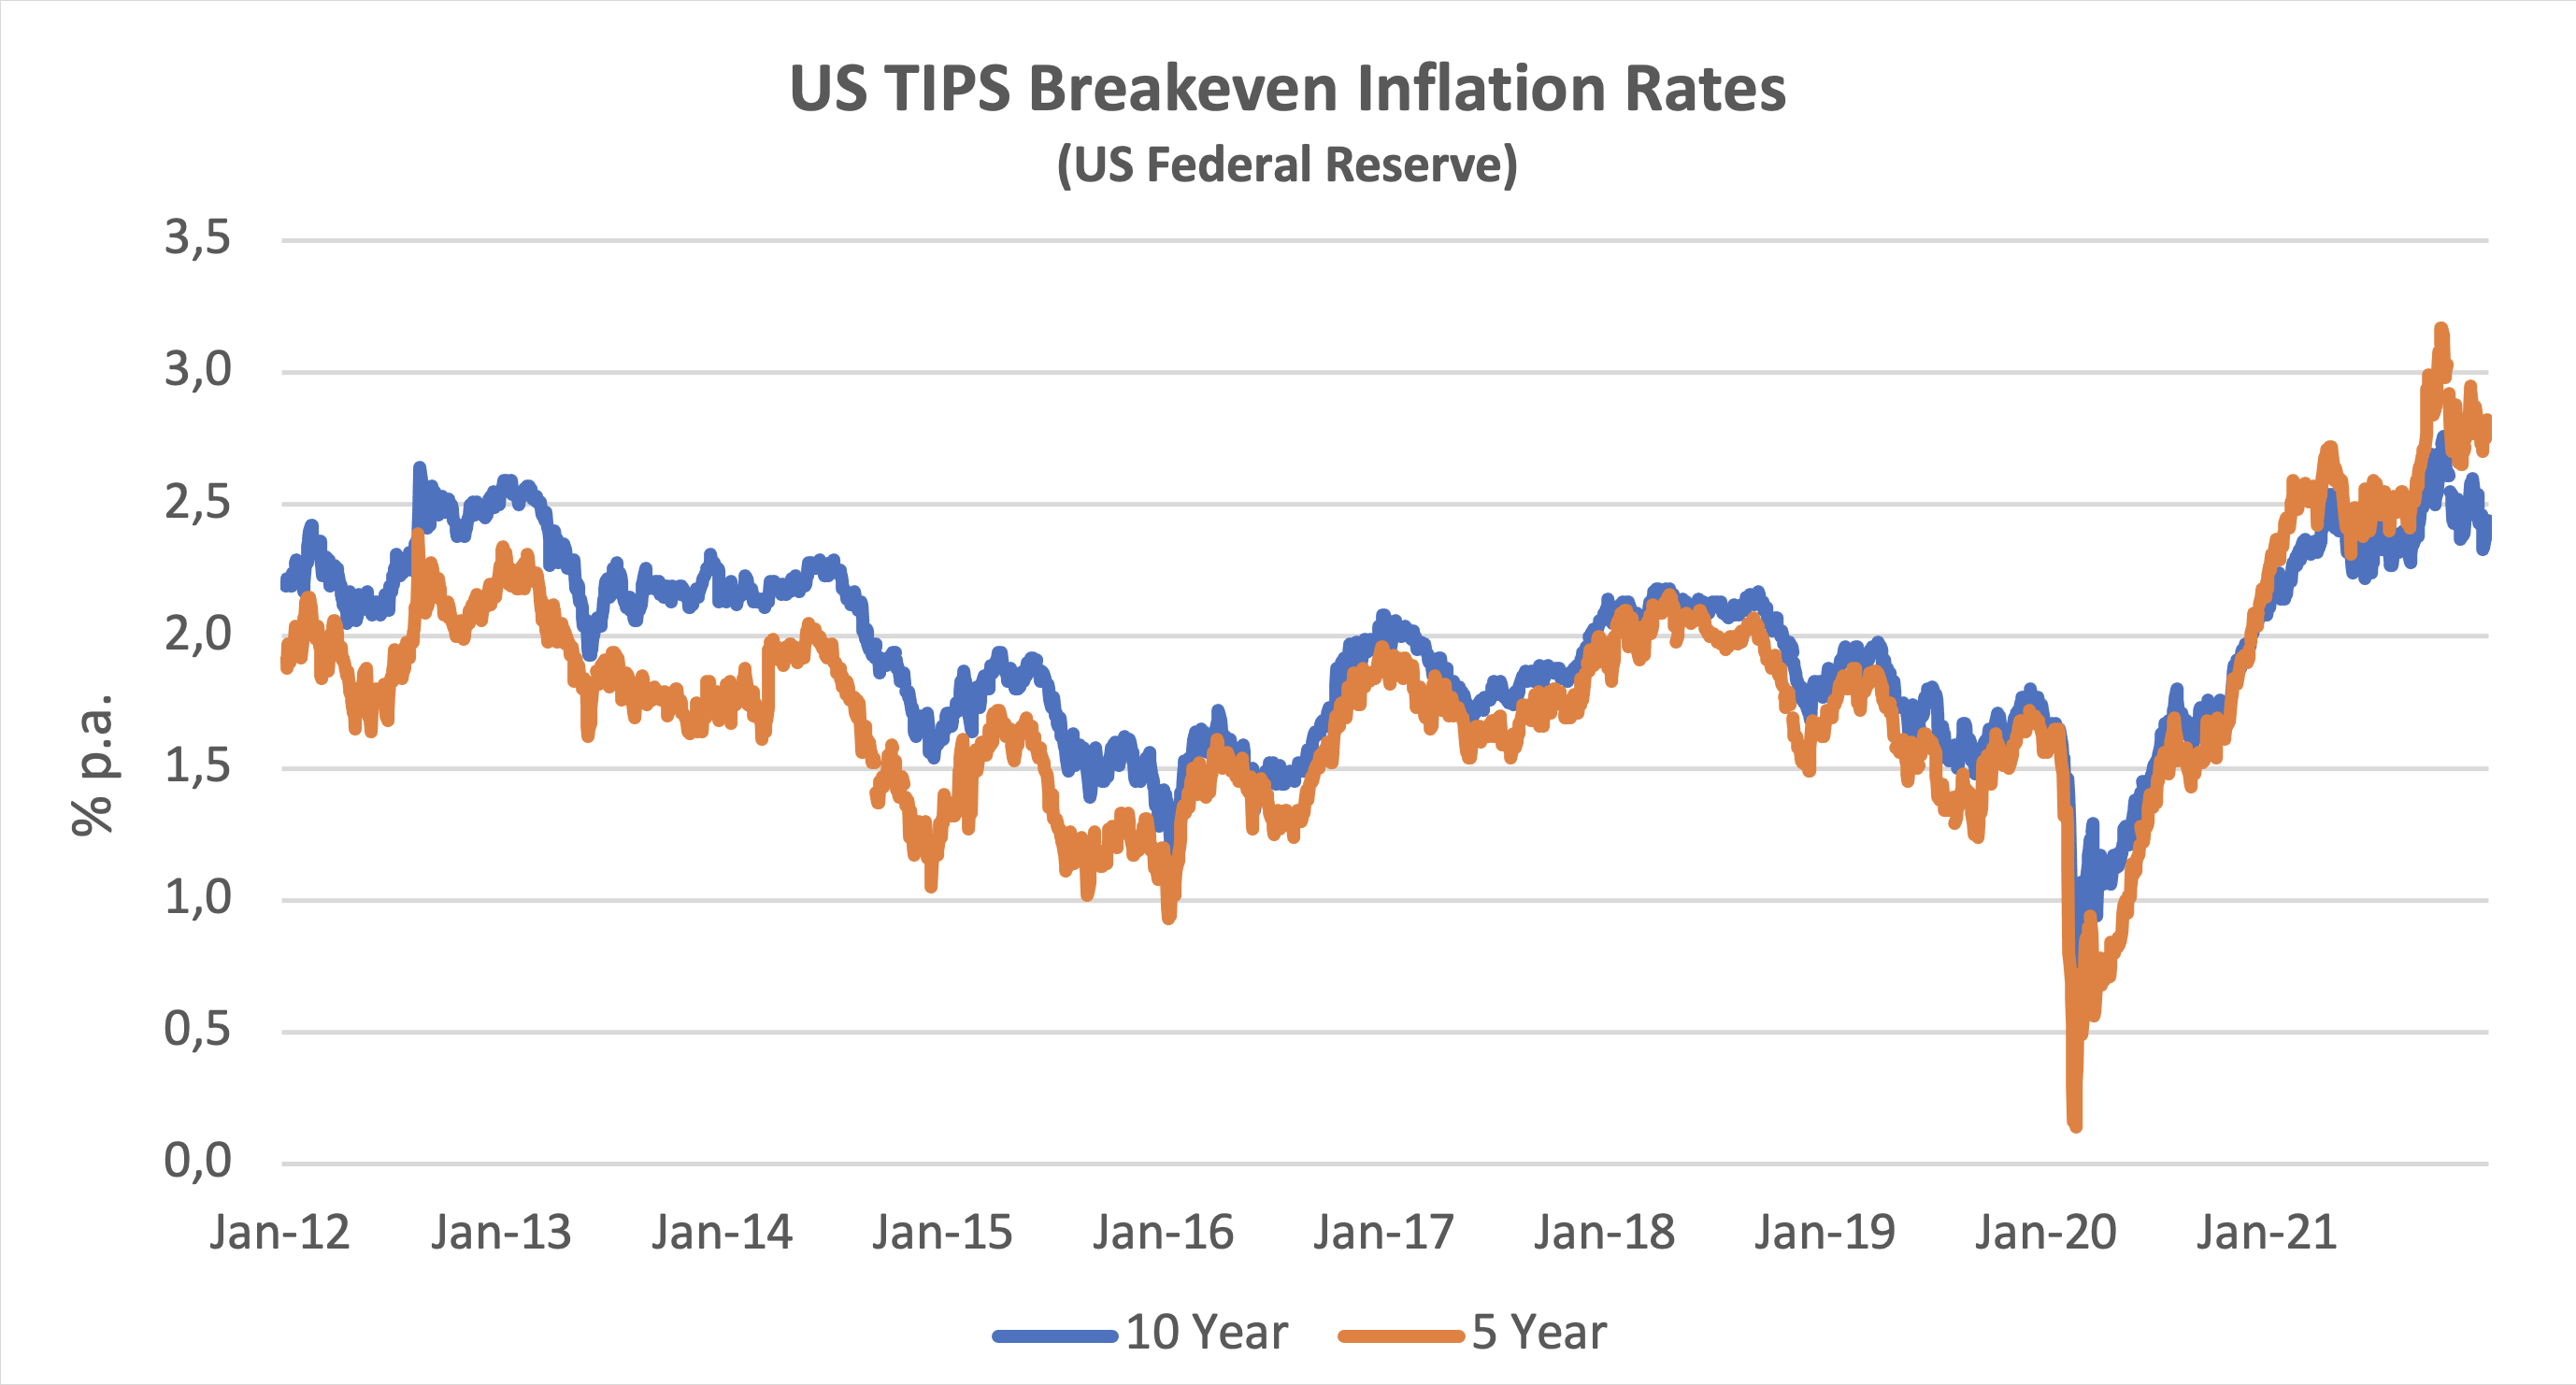
Another indicator that is potentially important to aircraft investors is the breakeven inflation rate on US Treasury Inflation-Protected Securities (TIPS). This indicator measures inflation expectations and it matters because used aircraft values are strongly influenced by the cost of new aircraft and over time this cost is linked to US Dollar inflation. In the short term this linkage is driven by escalation clauses in aircraft purchase contracts and in the long term by the general input cost environment for the aircraft manufacturers. For this report we have compared the breakeven rate for 10-year and 5-year TIPS to highlight the differences in expectations for the two time horizons. The shorter time horizon has been more volatile, especially since the onset of the pandemic, but there is a strong overall correlation that suggests changed inflation expectations are not for a transitory “blip”.
Traffic and Aircraft Demand
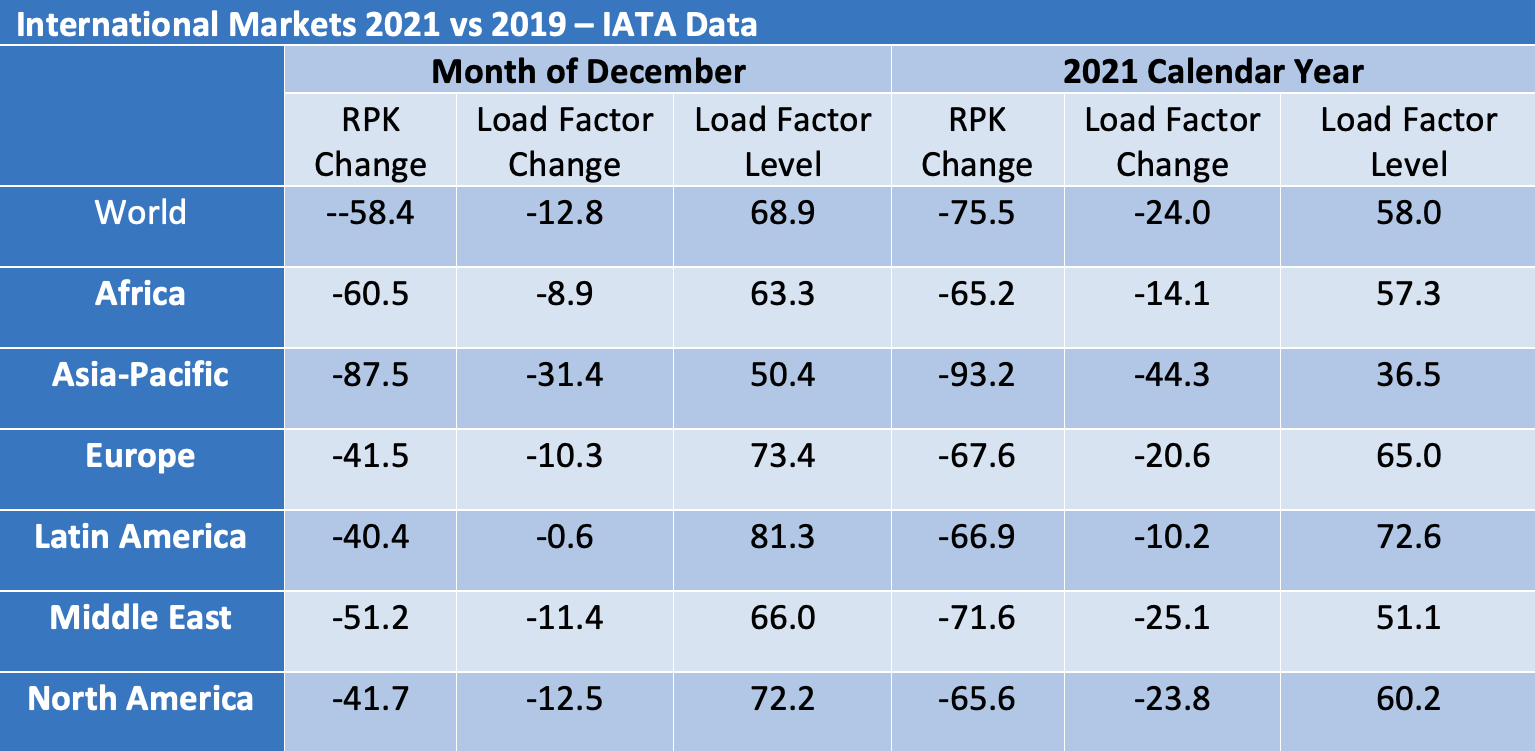
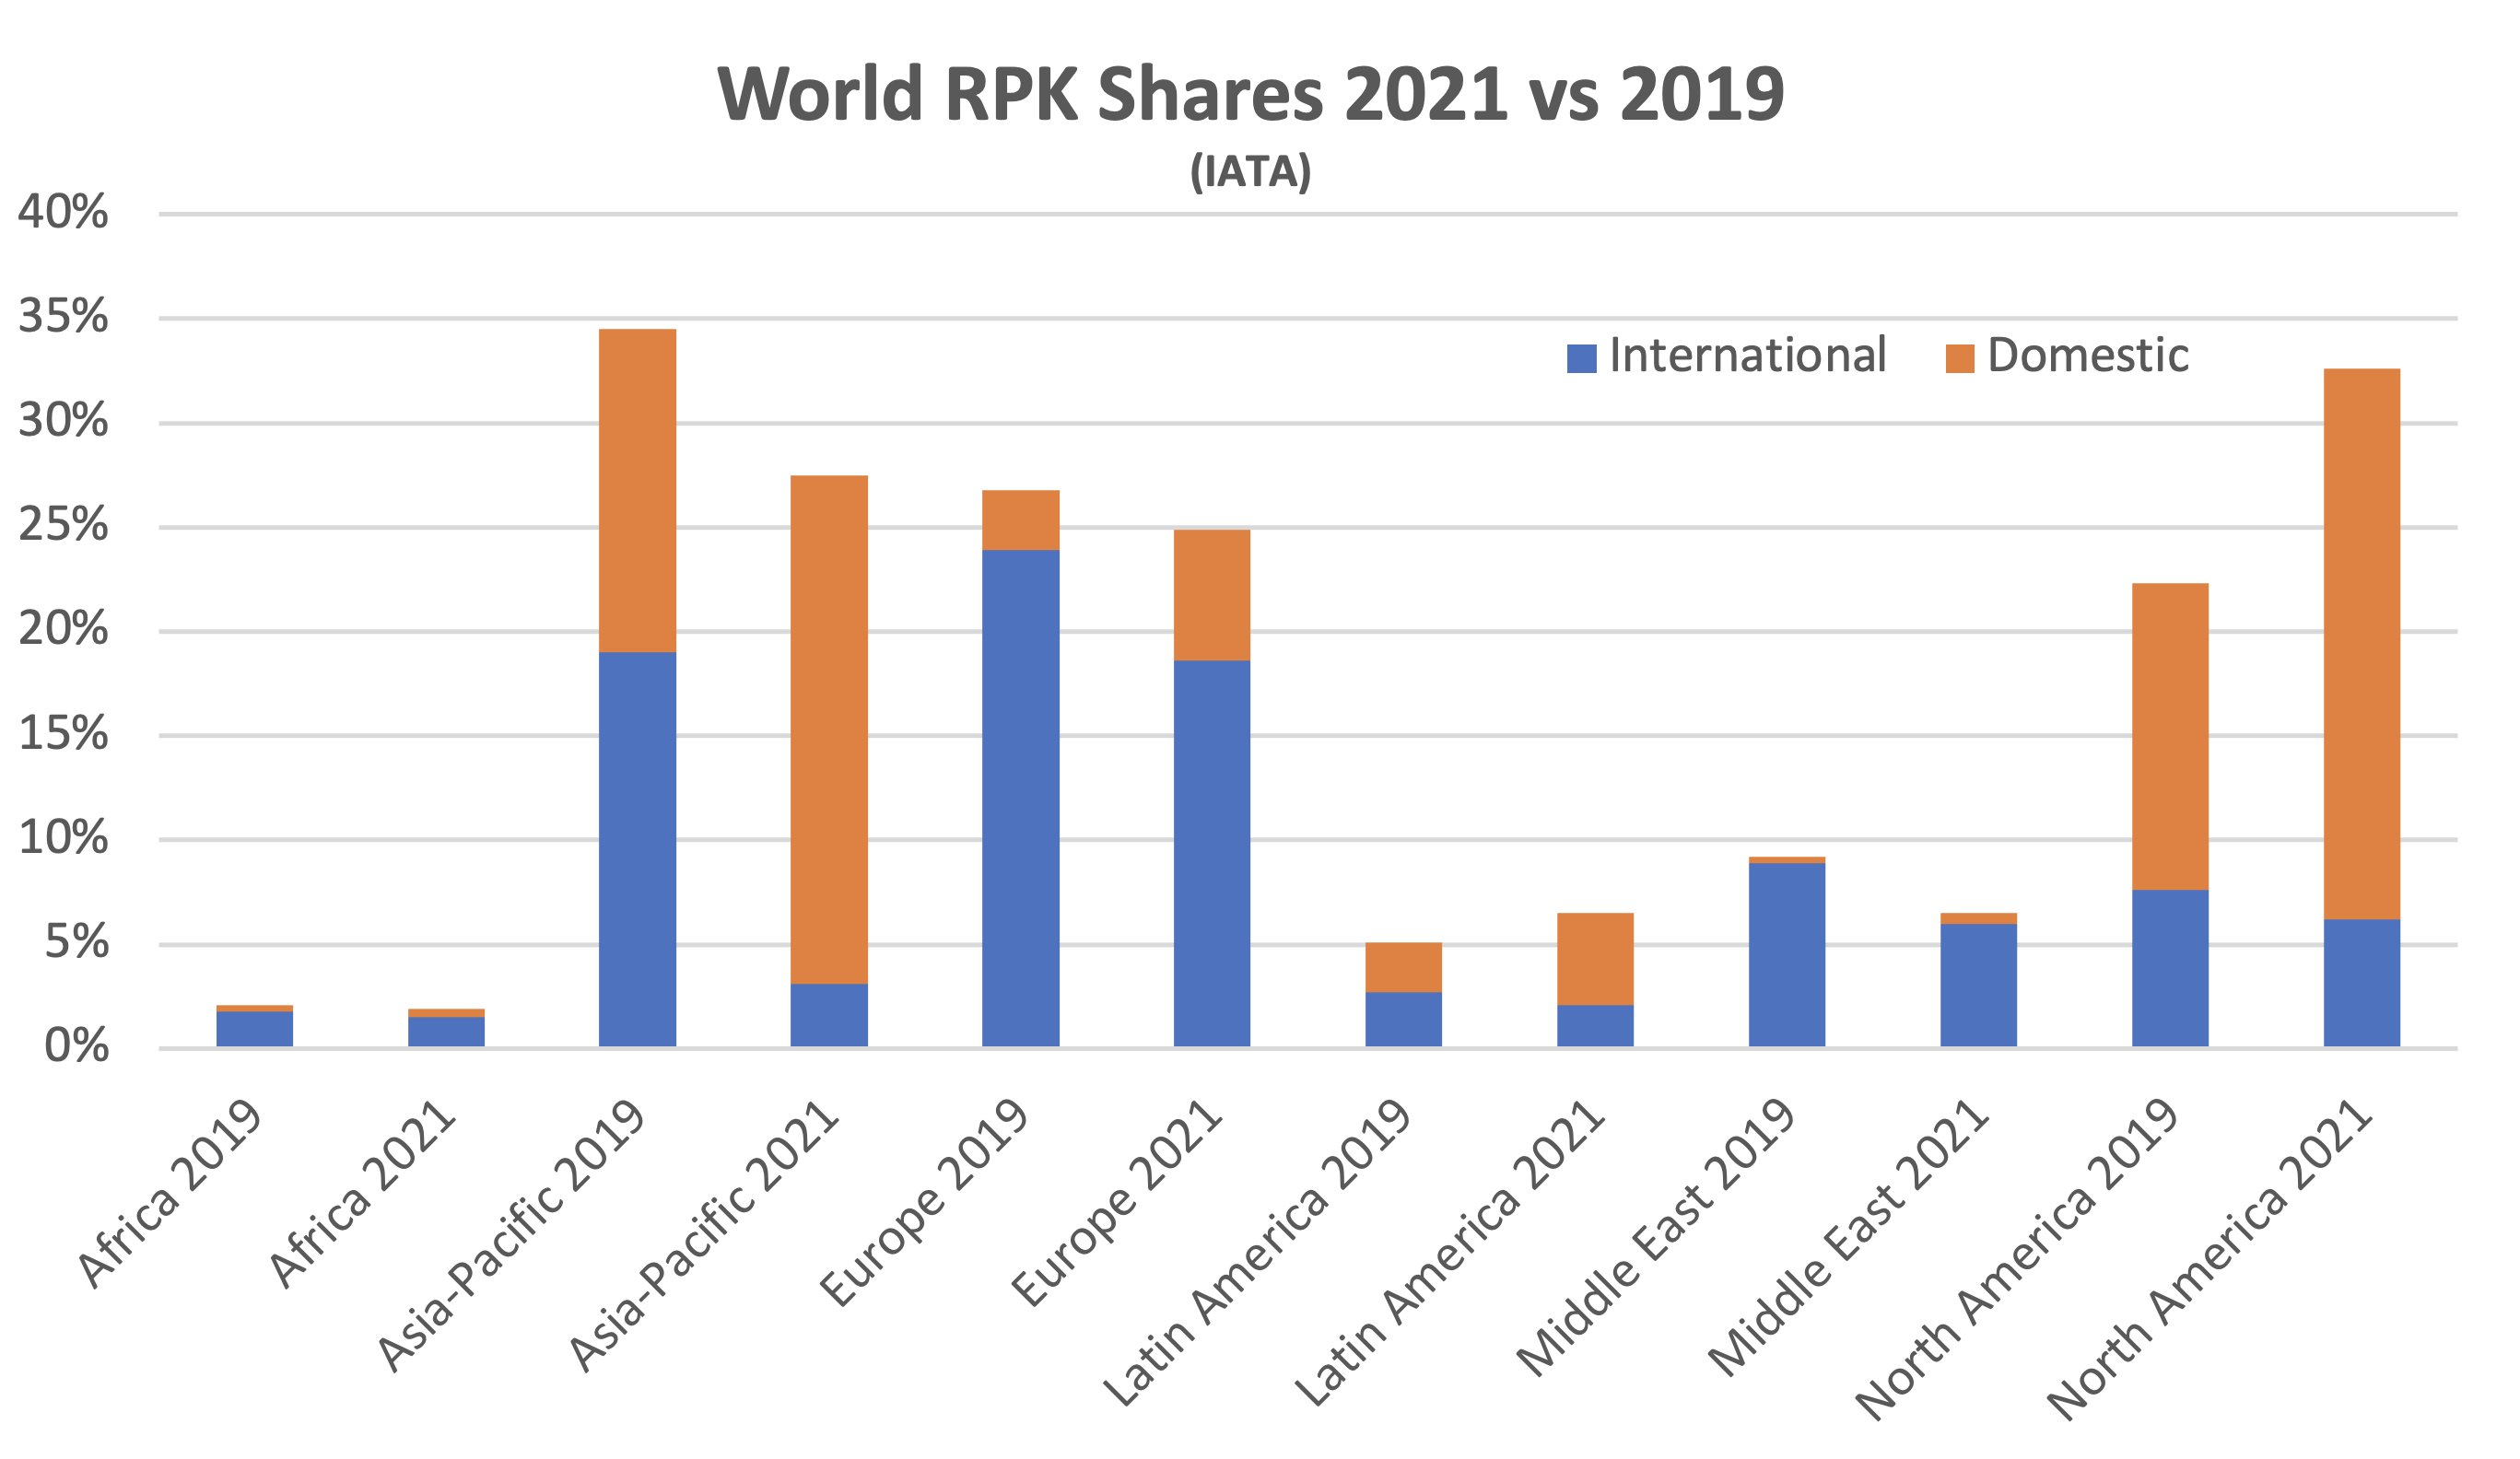
Recovery from the impact of COVID-19 remains slow and patchy. Global RPKs[2] for calendar year 2021 were down 58% vs 2019 compared to a 60% drop for the nine months to September. As the tables below make clear domestic traffic continues to outperform international by a large margin due to the greater impact of government restrictions on the latter.
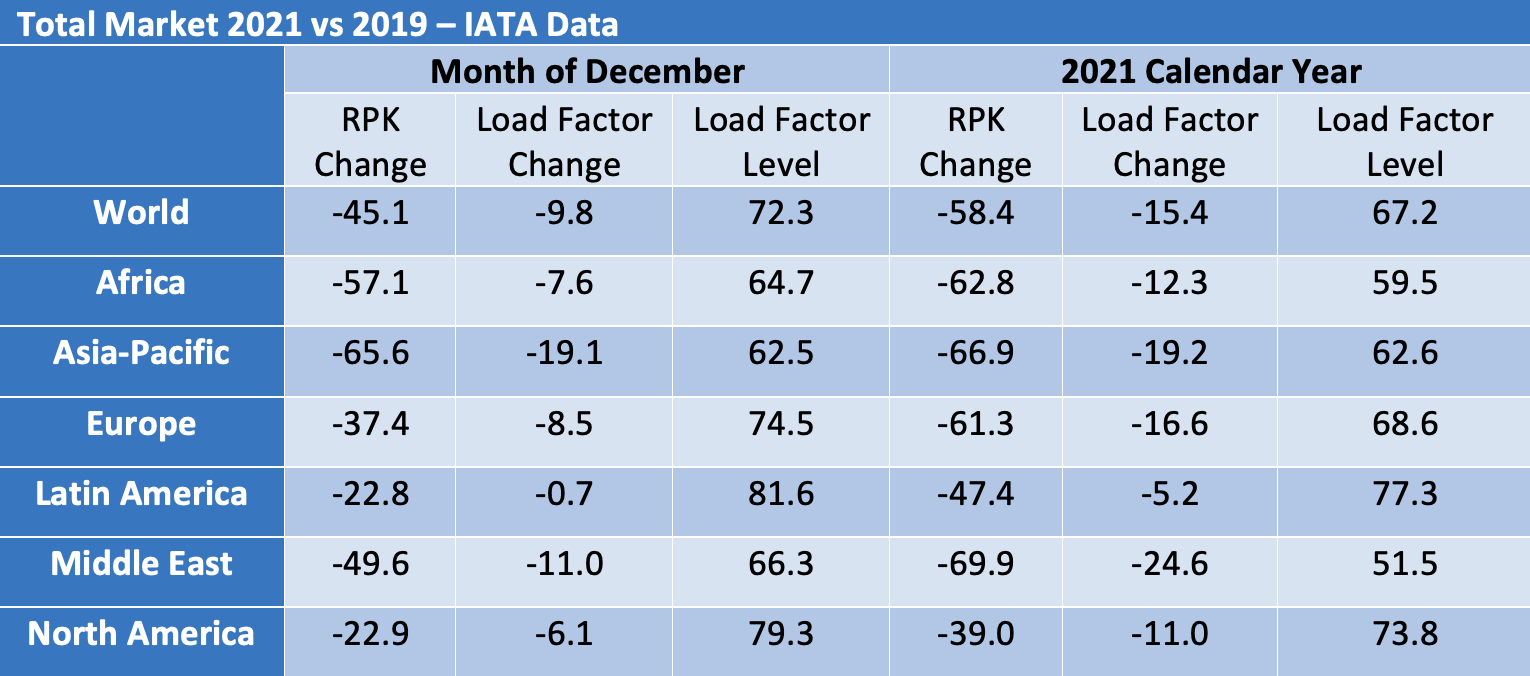
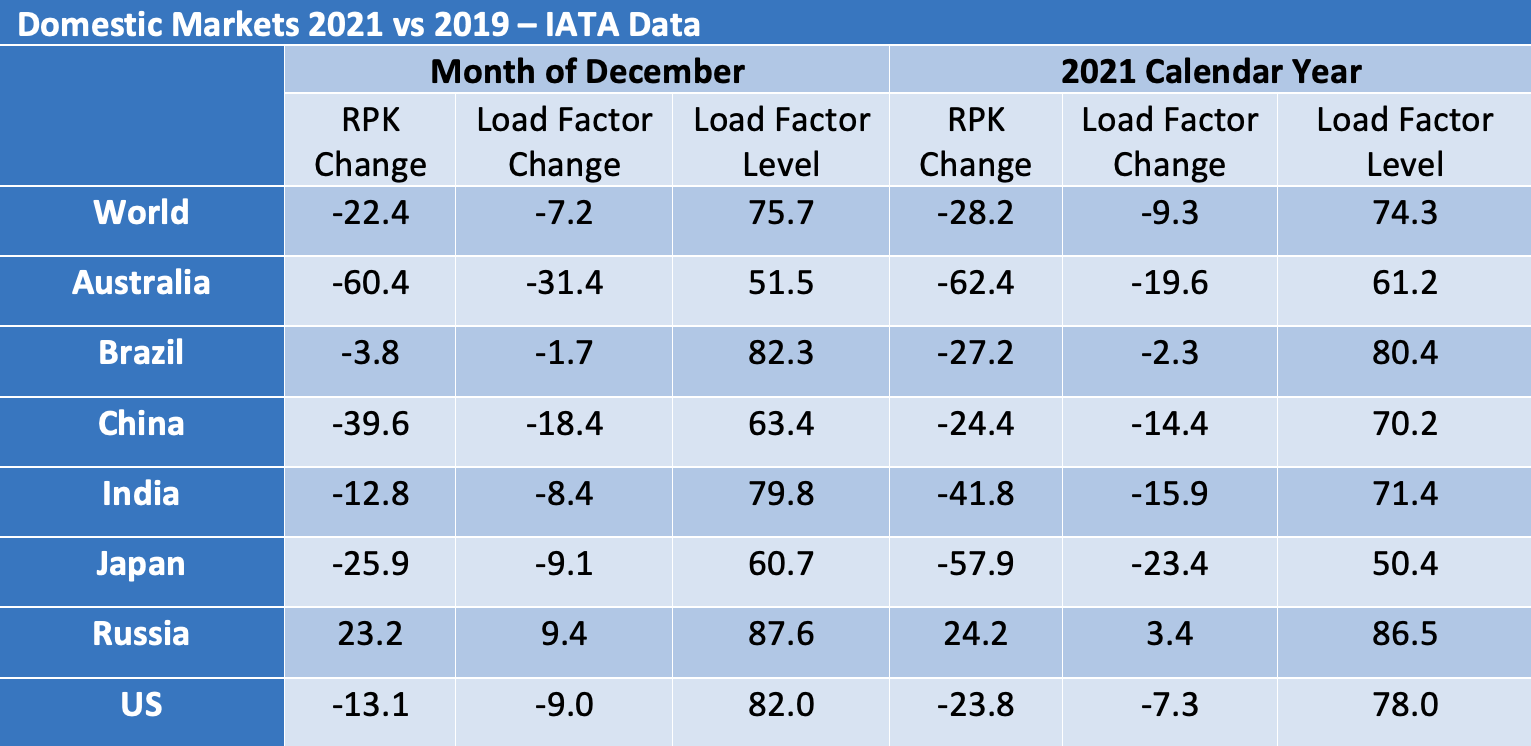
IATA reports changes in traffic and global market shares rather than actual values and reports domestic traffic on a different basis to international traffic by focusing on country rather than regional markets. The country focus becomes more understandable when one considers the 85% total domestic traffic accounted for by the seven countries listed separately.
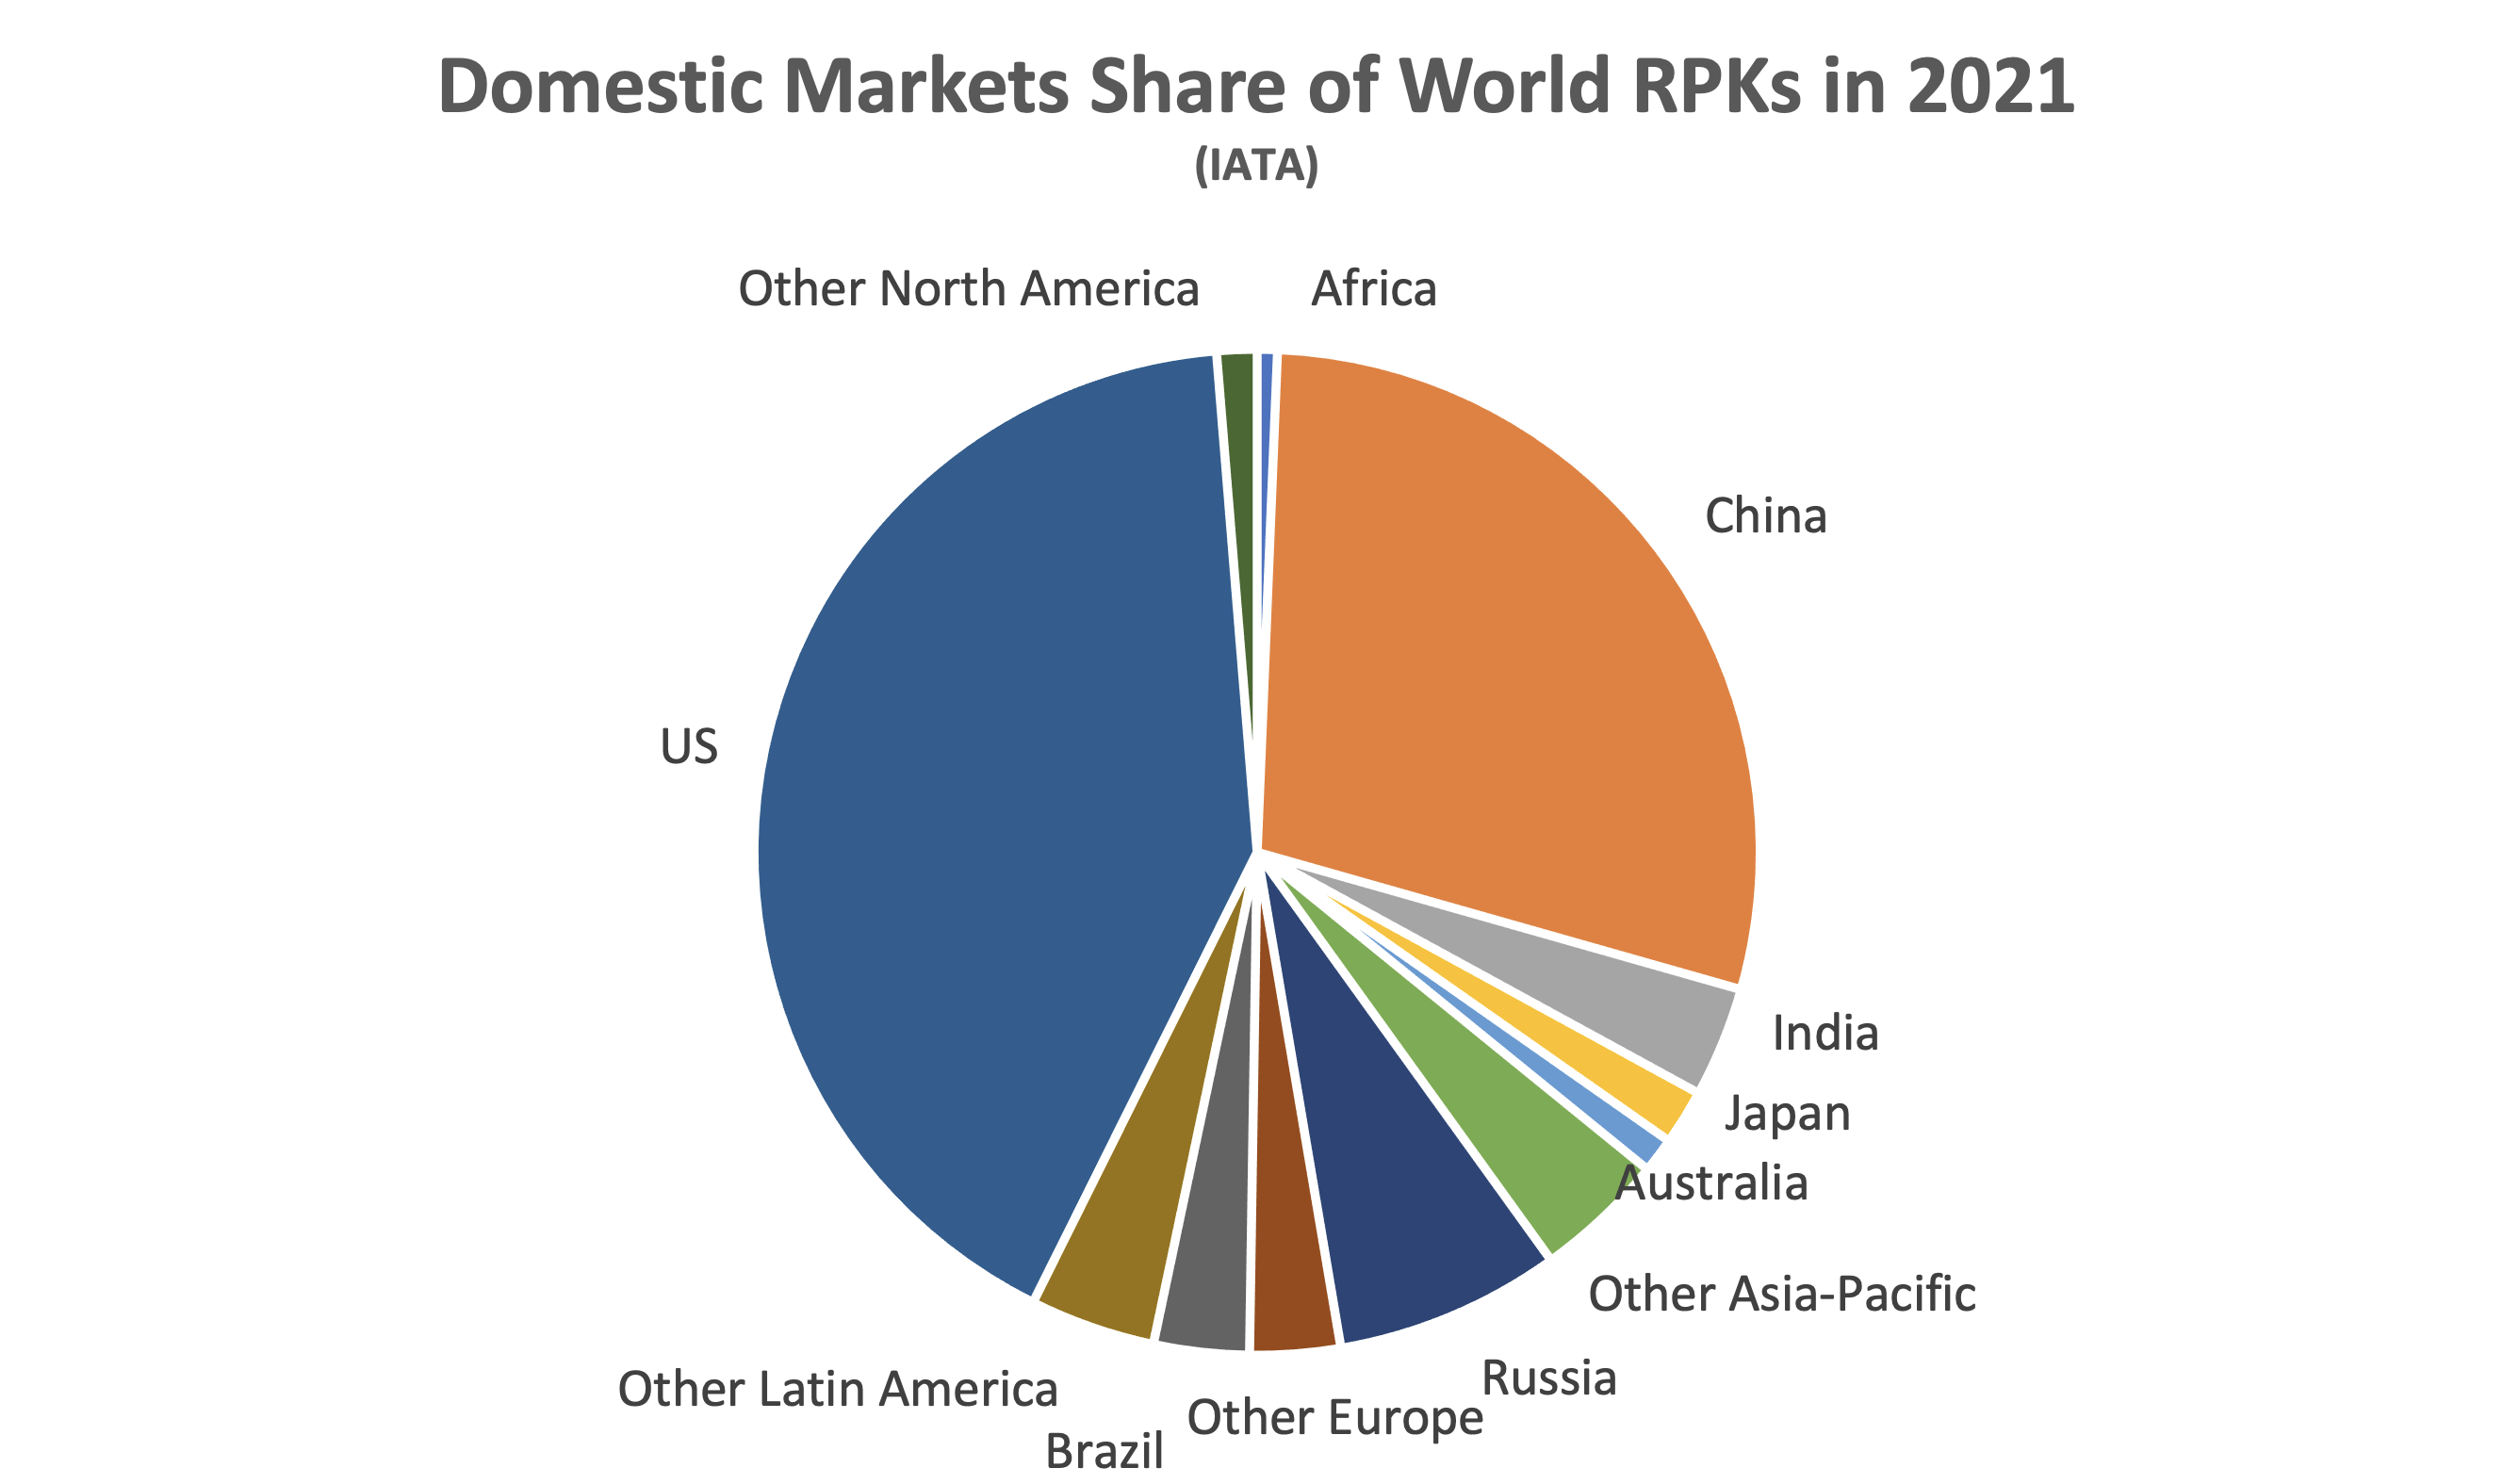
Although the breakdown of domestic traffic in 2021 looks similar to 2019, this is not true of the split between domestic and international traffic by region. Although domestic traffic has an increased share everywhere, the change is most dramatic in the Asia-Pacific region where international traffic has collapsed, and domestic Chinese traffic is most of what’s left.
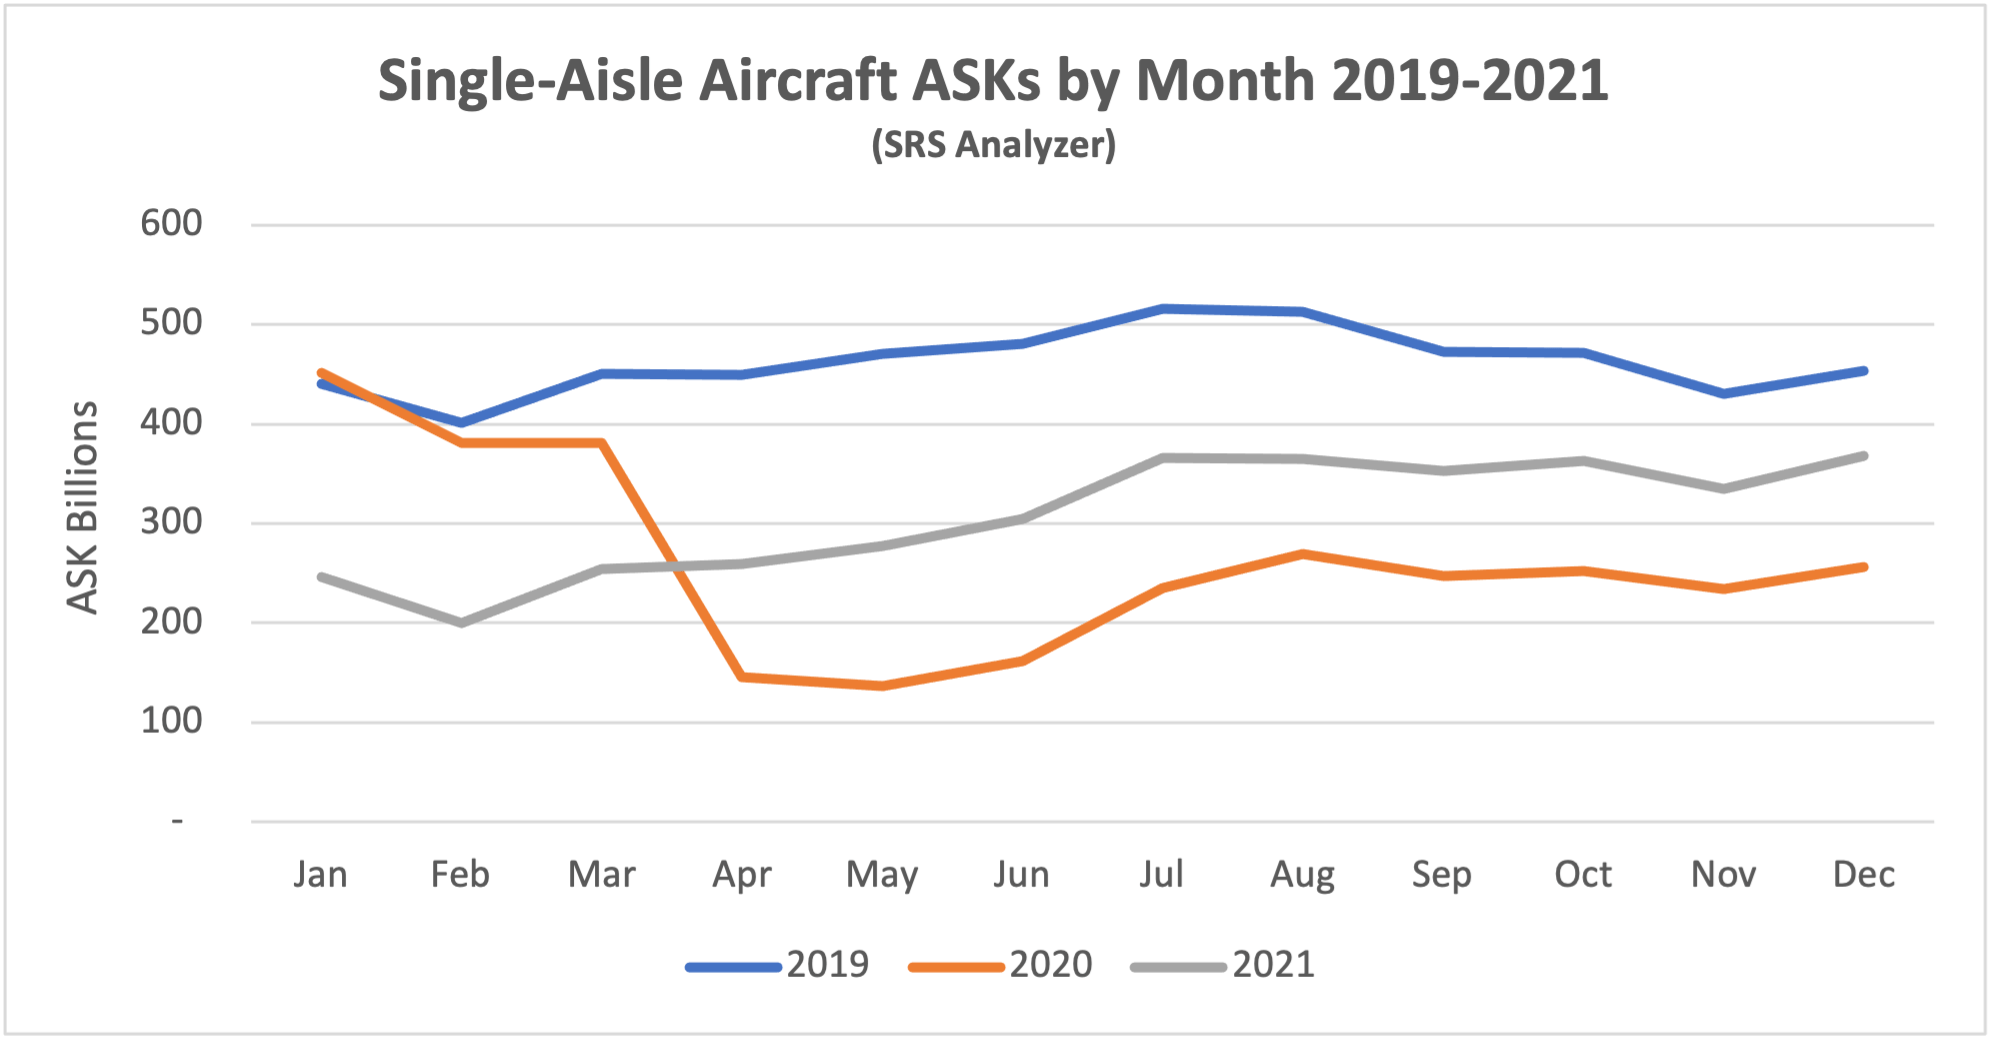
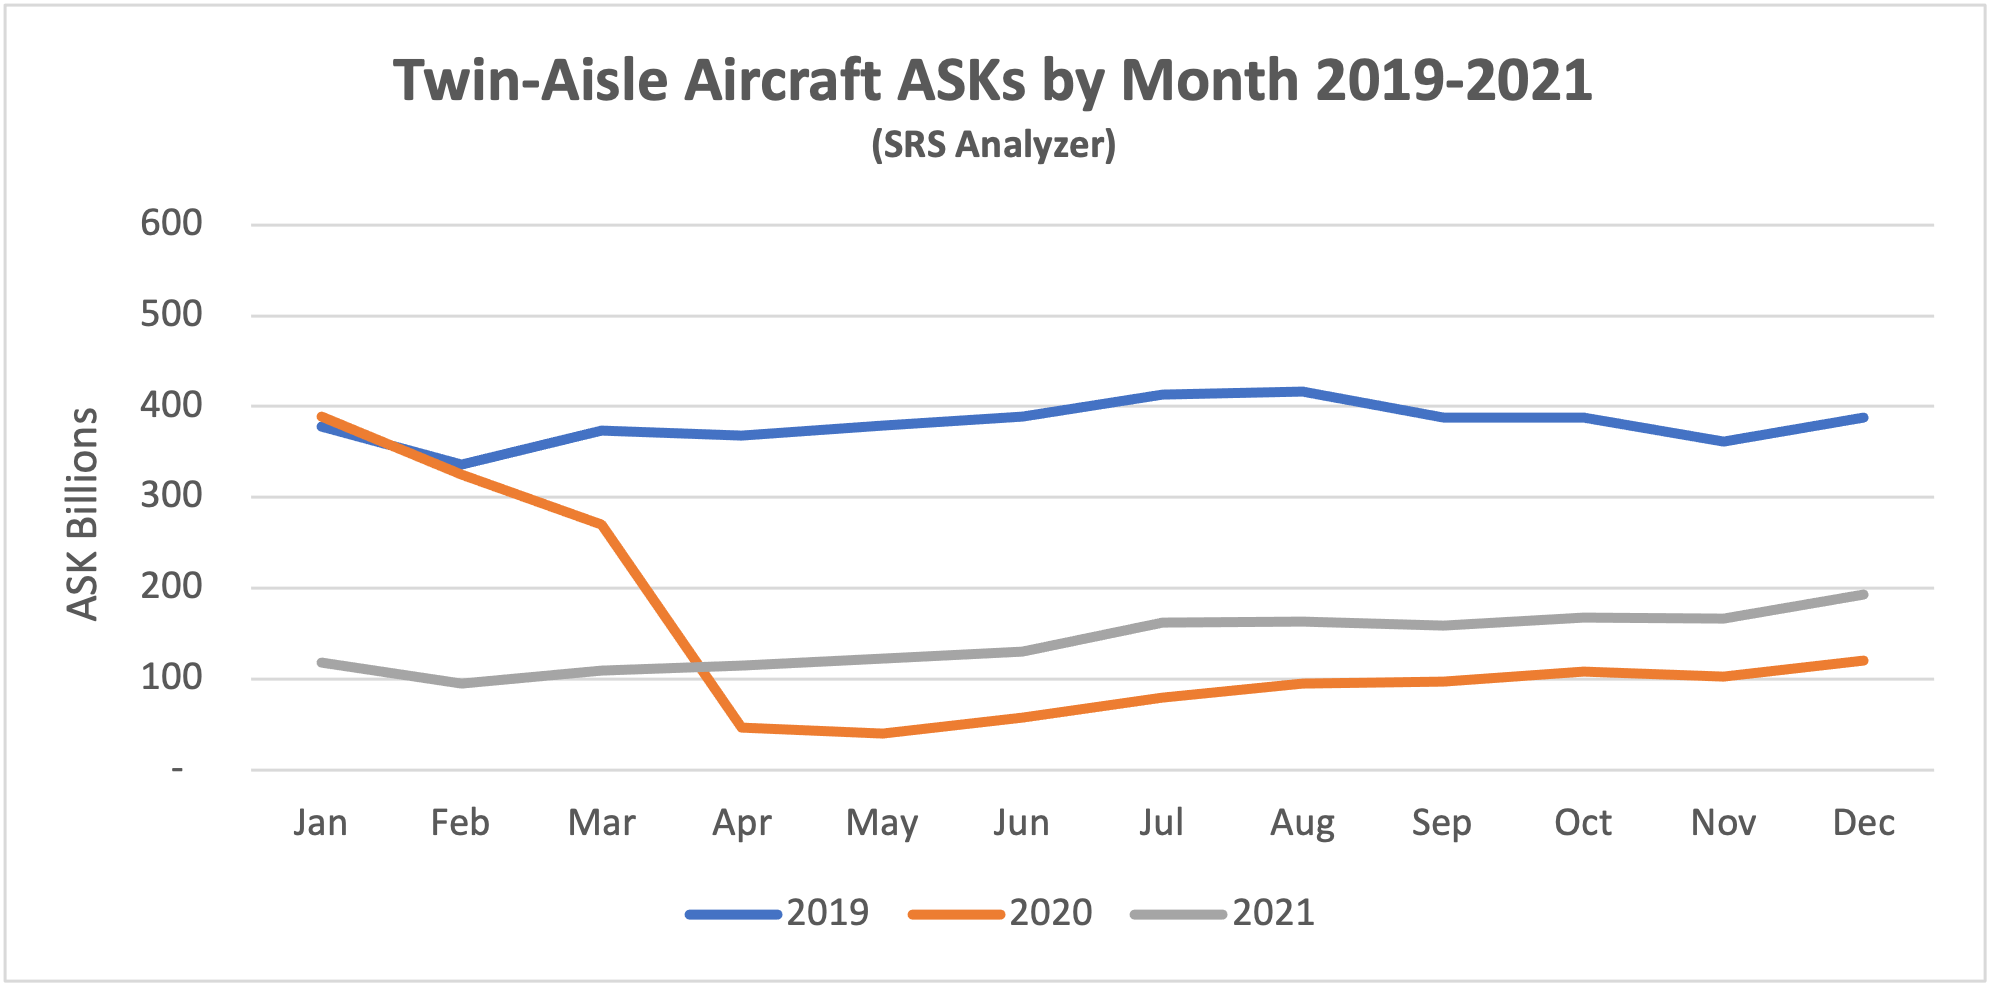
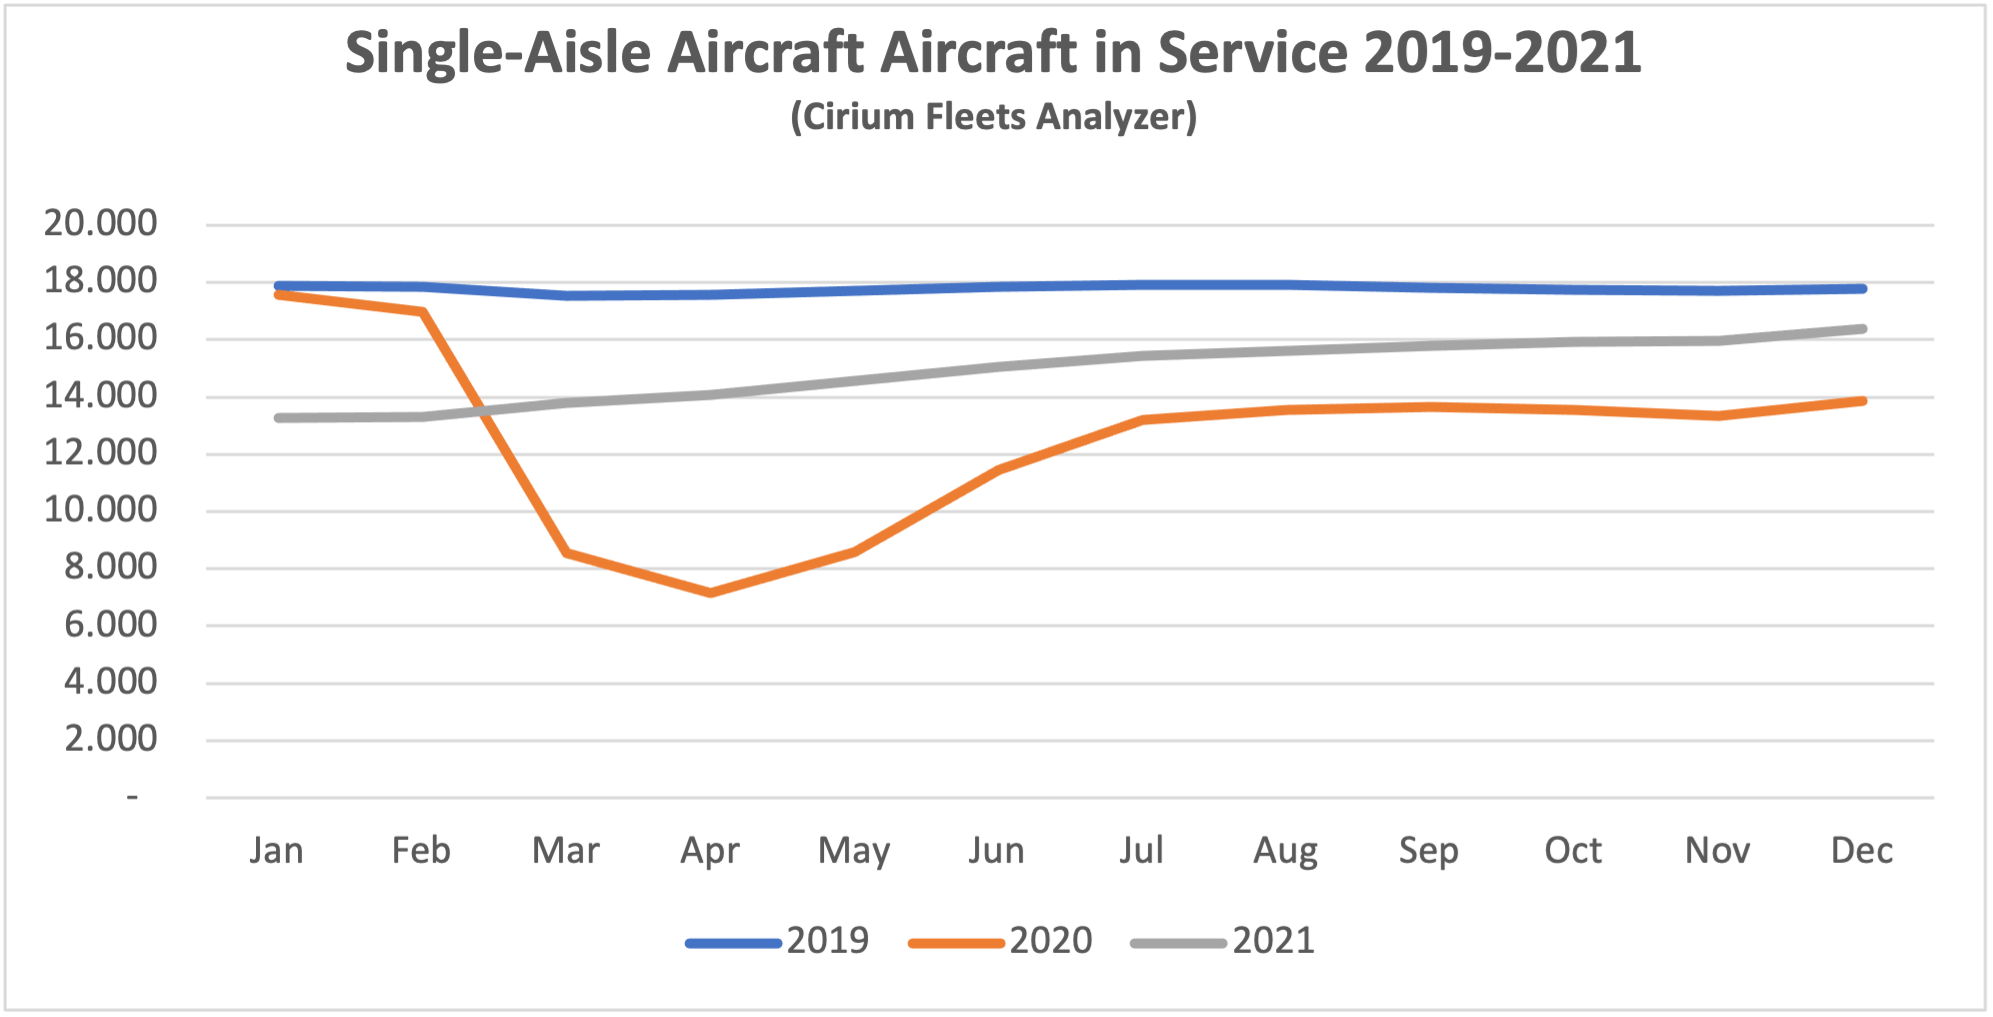
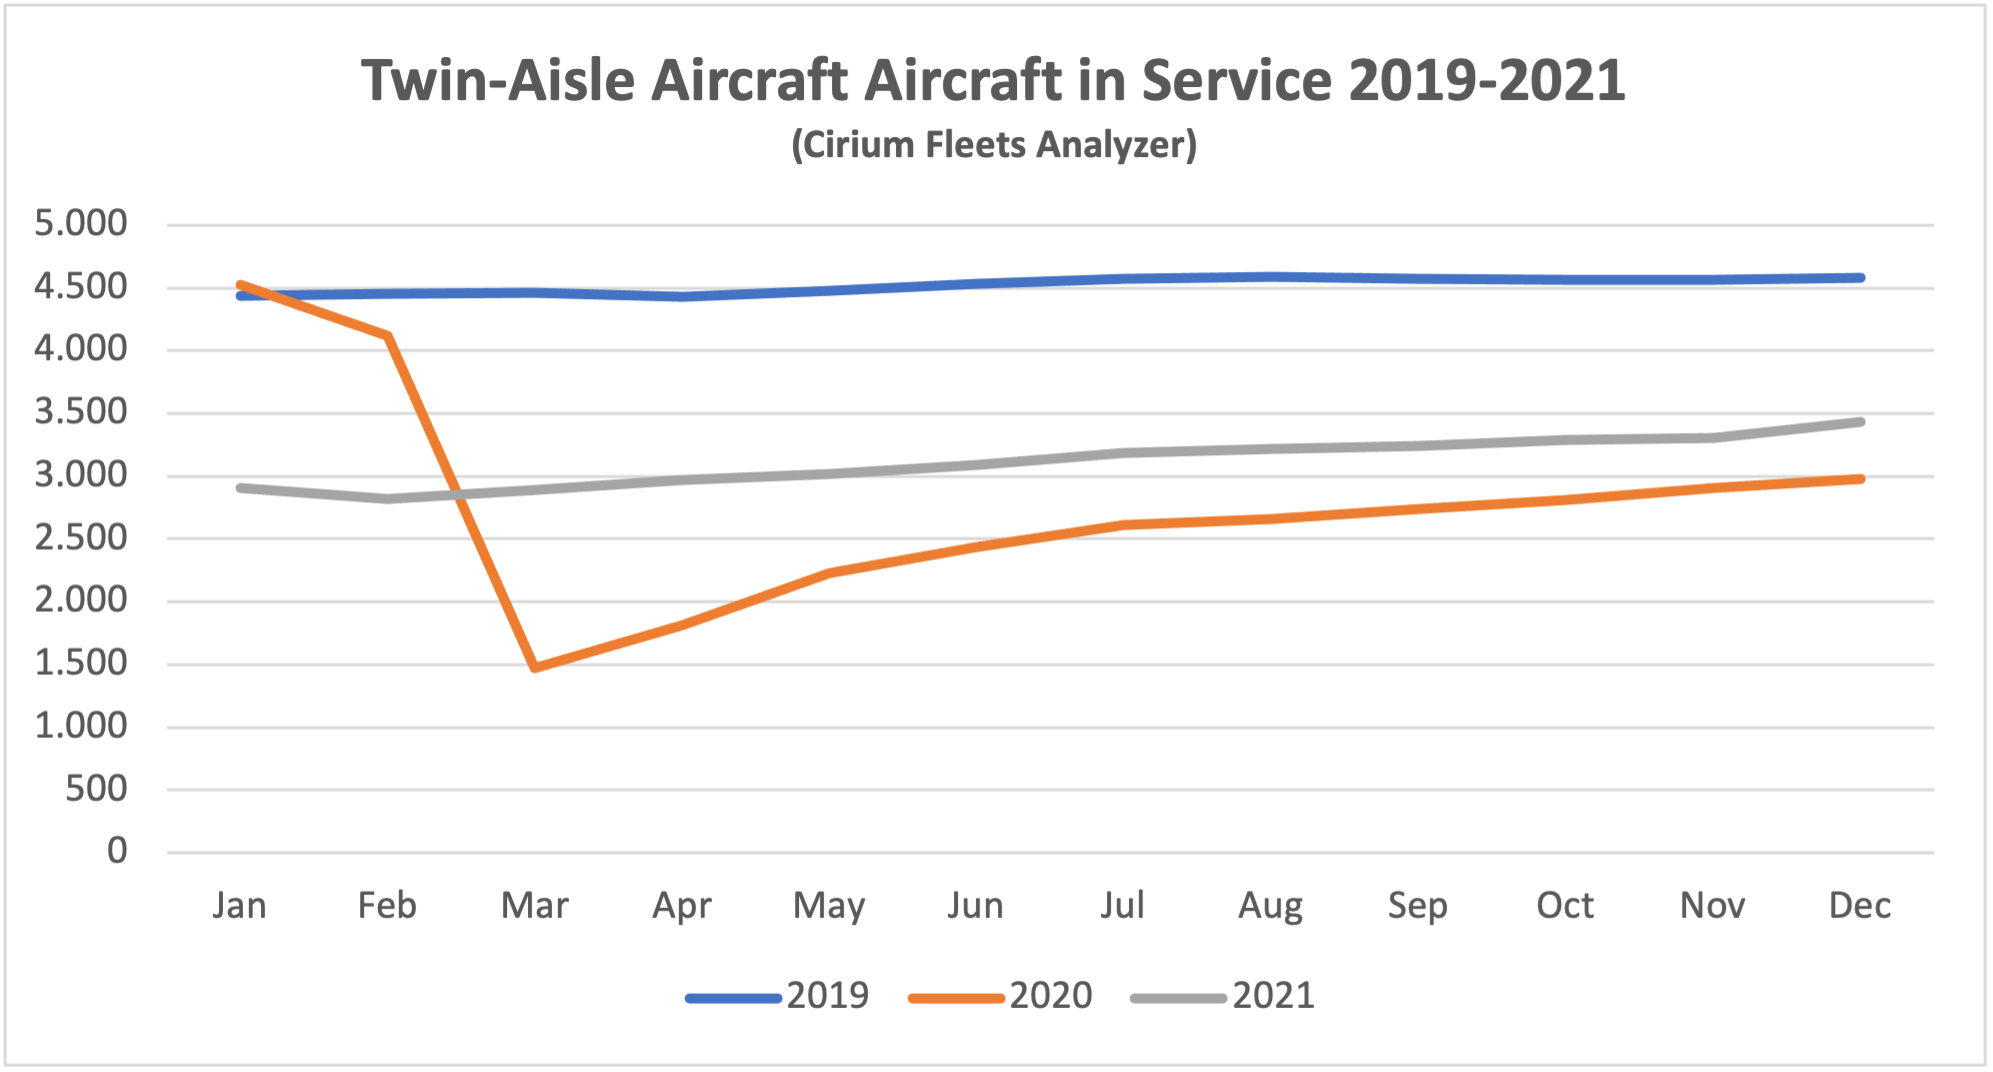
Although some short-haul aircraft serve international routes nearly all long-haul aircraft do so, and this is reflected in the relative demand for single-aisle (narrowbody) and twin-aisle (widebody) aircraft. Aircraft demand can be measured in terms of ASKs[3] and aircraft in service. ASKs have not declined as much as traffic because load factors have declined and aircraft in service have not declined as much as ASKs because aircraft utilization has declined. The airlines are clearly sweating their assets more since the middle of 2021 as the rates of growth in both ASKs and aircraft in service have both declined. This is probably due to a more stable market environment and the need to address rising fuel prices with greater asset productivity.
New Aircraft Supply
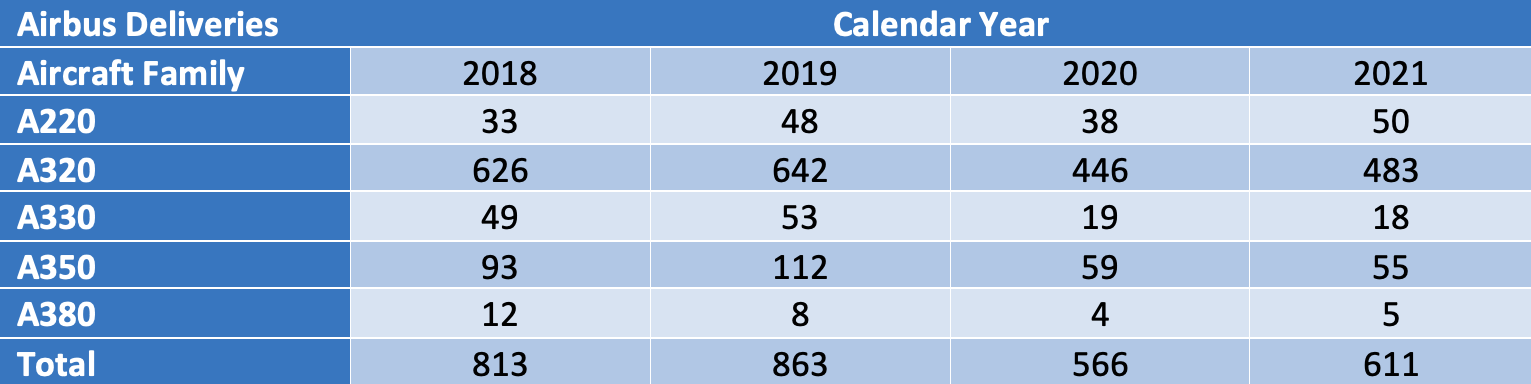
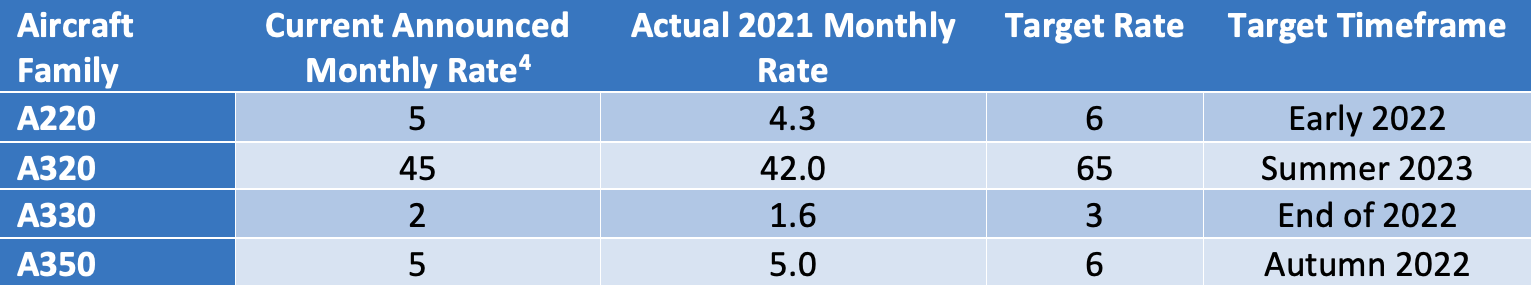
The latest status of Airbus’s production plans is:
Airbus is reported to have received objections from some of its major lessor customers after announcing that it is considering an increase in A320 family production to 75 aircraft per month in 2025. It is also believed that key members of its supply chain such as some engine manufacturers are not enthusiastic. One might speculate that Airbus is testing the waters with some of its key stakeholders and signalling that intends to maintain its lead in the single-aisle aircraft market.
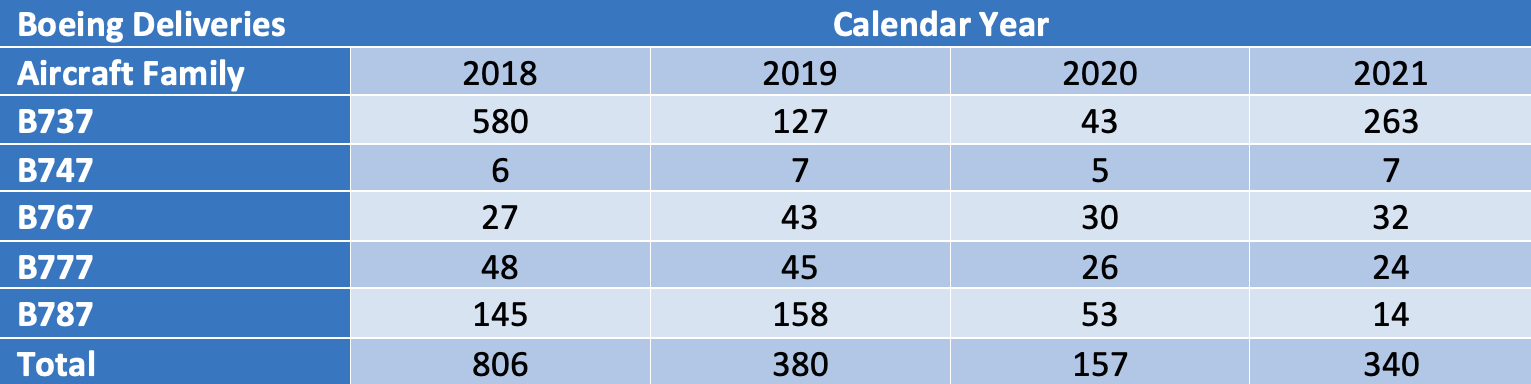
The latest status of Boeing’s production plans is:
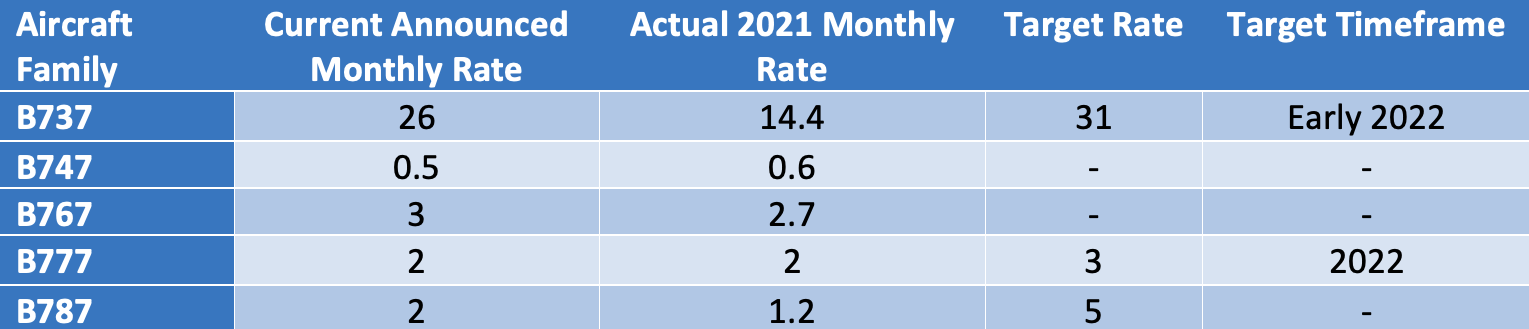
Boeing’s inventory of undelivered B737 Max aircraft fell from 425 at the end of 2020 to 335 in 2021. This lower inventory includes aircraft manufactured since Boeing resumed production in late 2020. This is probably due to a combination of delivery bottlenecks and delays in recertification in some jurisdictions, notably China. Inventory is expected to clear by 2023. Boeing is producing 26 aircraft per month and says it is on track to meet its target of 31 aircraft per month in early 2022. Management is considering further production increases but are wary of potential supply chain issues and expects to deliver 500 B737 Max aircraft in 2022.
Boeing has also had quality and production problems with the B787, its main passenger twin-aisle product (nearly all B747, B767 and B777 deliveries are freighters or tankers) and has suspended deliveries. At the end of 2021 Boeing had 110 B787s in inventory, up from 80 in 2020. Deliveries are expected to resume in 2022 but there is no firm guidance on timing.
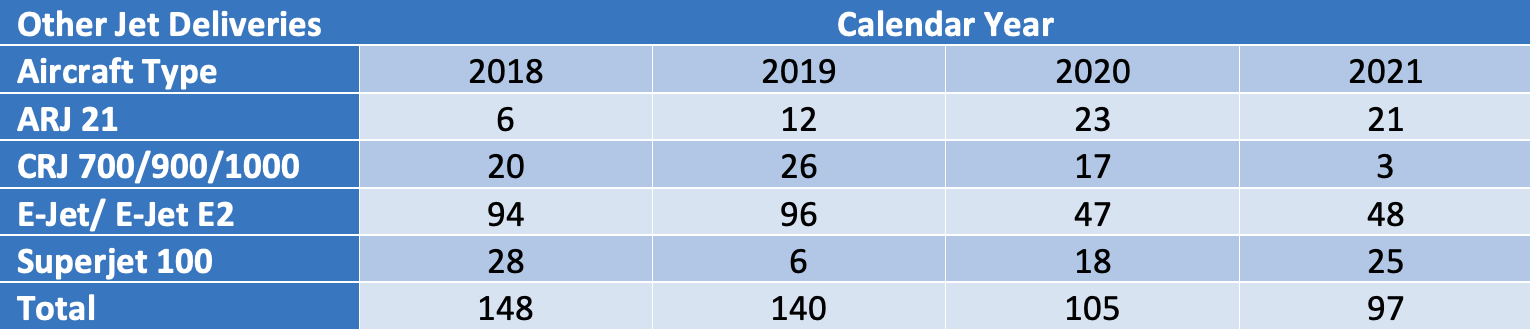
There has been no significant change in production levels of other aircraft manufacturers apart from the winding down of the CRJ programme.
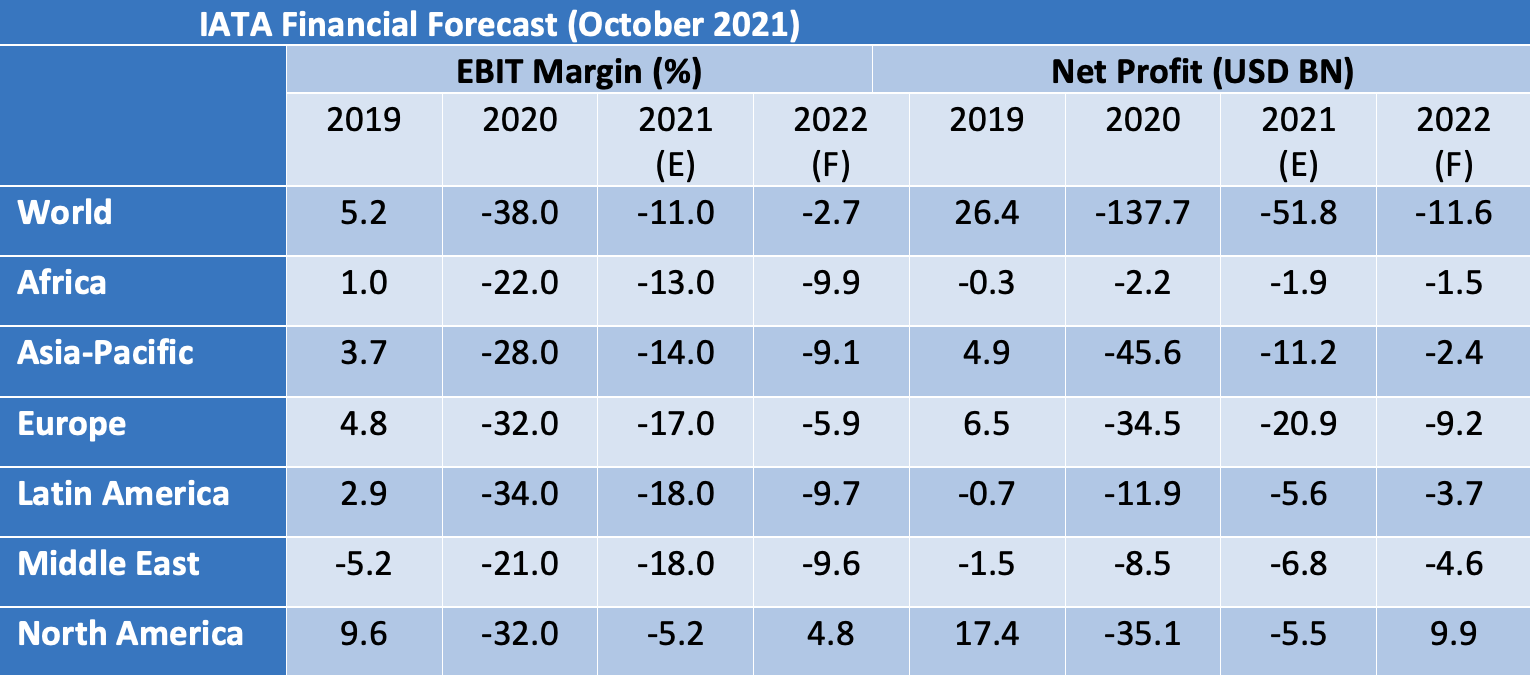
Airline Industry Financial Performance
IATA’s October 2021 forecast shows the airline industry returning to a near breakeven in 2022 after another very difficult year in 2021. North America is set to be the first region to move back into profit and Europe is forecast to be the next best performer on an EBIT Margin basis. Europe’s relative performance is much better than in 2021 due to positive impacts of its Covid passport scheme and the re-opening of North Atlantic travel.
In 2022 there is likely to be an increase in air fares. This is partly due to cost pressures such as fuel which will spike more than normal because airlines have found it harder to implement fuel hedging strategies during the pandemic. Also, there is likely to be significant pent-up demand due to the travel restrictions prevailing in 2020 and 2021 along with an increase in general inflation. Another factor in this anticipated recovery is the reduction in price competition caused by airlines going out of business.
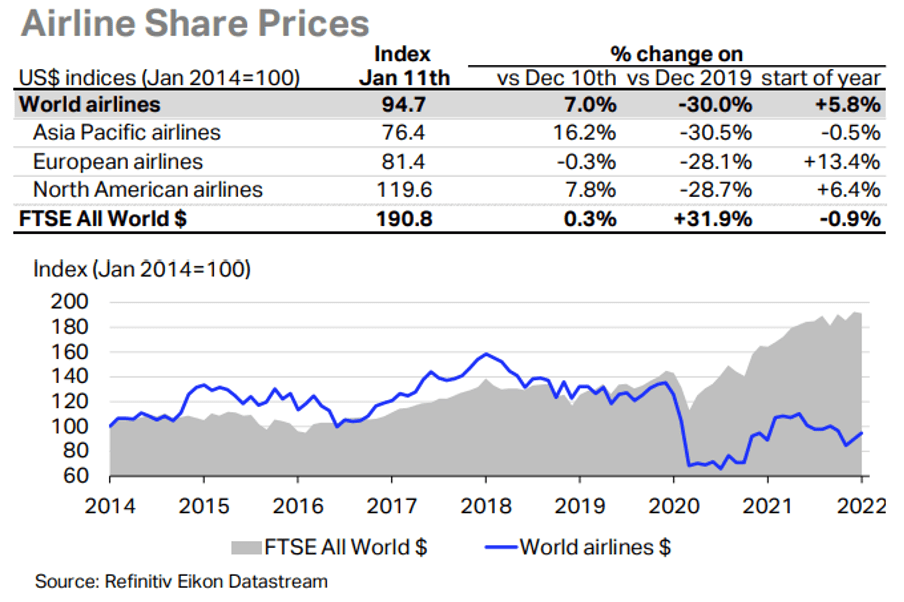
Airline share prices have recovered from their 2020 lows, but the chart below shows that they have underperformed the overall market. This is not surprising given the continued uncertainty over the timing of recovery and the probable requirement to strengthen balance sheets by issuing new equity at the cost of diluting existing shareholders.
Significant airline credit events in Q4 2021 were:
- Alitalia ceased operations and transferred most of its operations to its successor ITA (it should be emphasised that this was an orderly process and cannot really be characterised as a default)
- Blue Panorama (Italy) suspended operations
- Great Dane Airlines (Denmark) ceased operations and filed for bankruptcy
- ITA (Brazil) suspended operations
- Tayaran Jet (Bulgaria) ceased operations
According to the aviation consultancy Ishka 17 airlines with 1,557 aircraft were under formal restructuring in in January, a decrease from October.
Aircraft Leasing Industry Consolidation
Q4 2021 saw the closing of the largest aircraft leasing merger in the history of the industry, AerCap’s acquisition of GECAS. Given this important event and the popularity of industry consolidation as a topic of conversation amongst those who work for aircraft lessors, it seems opportune to review consolidation’s history and consequences.
The table below tracks all aircraft leasing M&A activity since 2000 that we are aware of. We have classified transactions under the headings of either “Consolidation” or “New Entrant”. In a Consolidation transaction both buyer and target are already industry participants whereas a New Entrant Transaction involves a buyer that is not. We have also included a rough transaction value based on the target’s fleet at the year-end before the transaction.
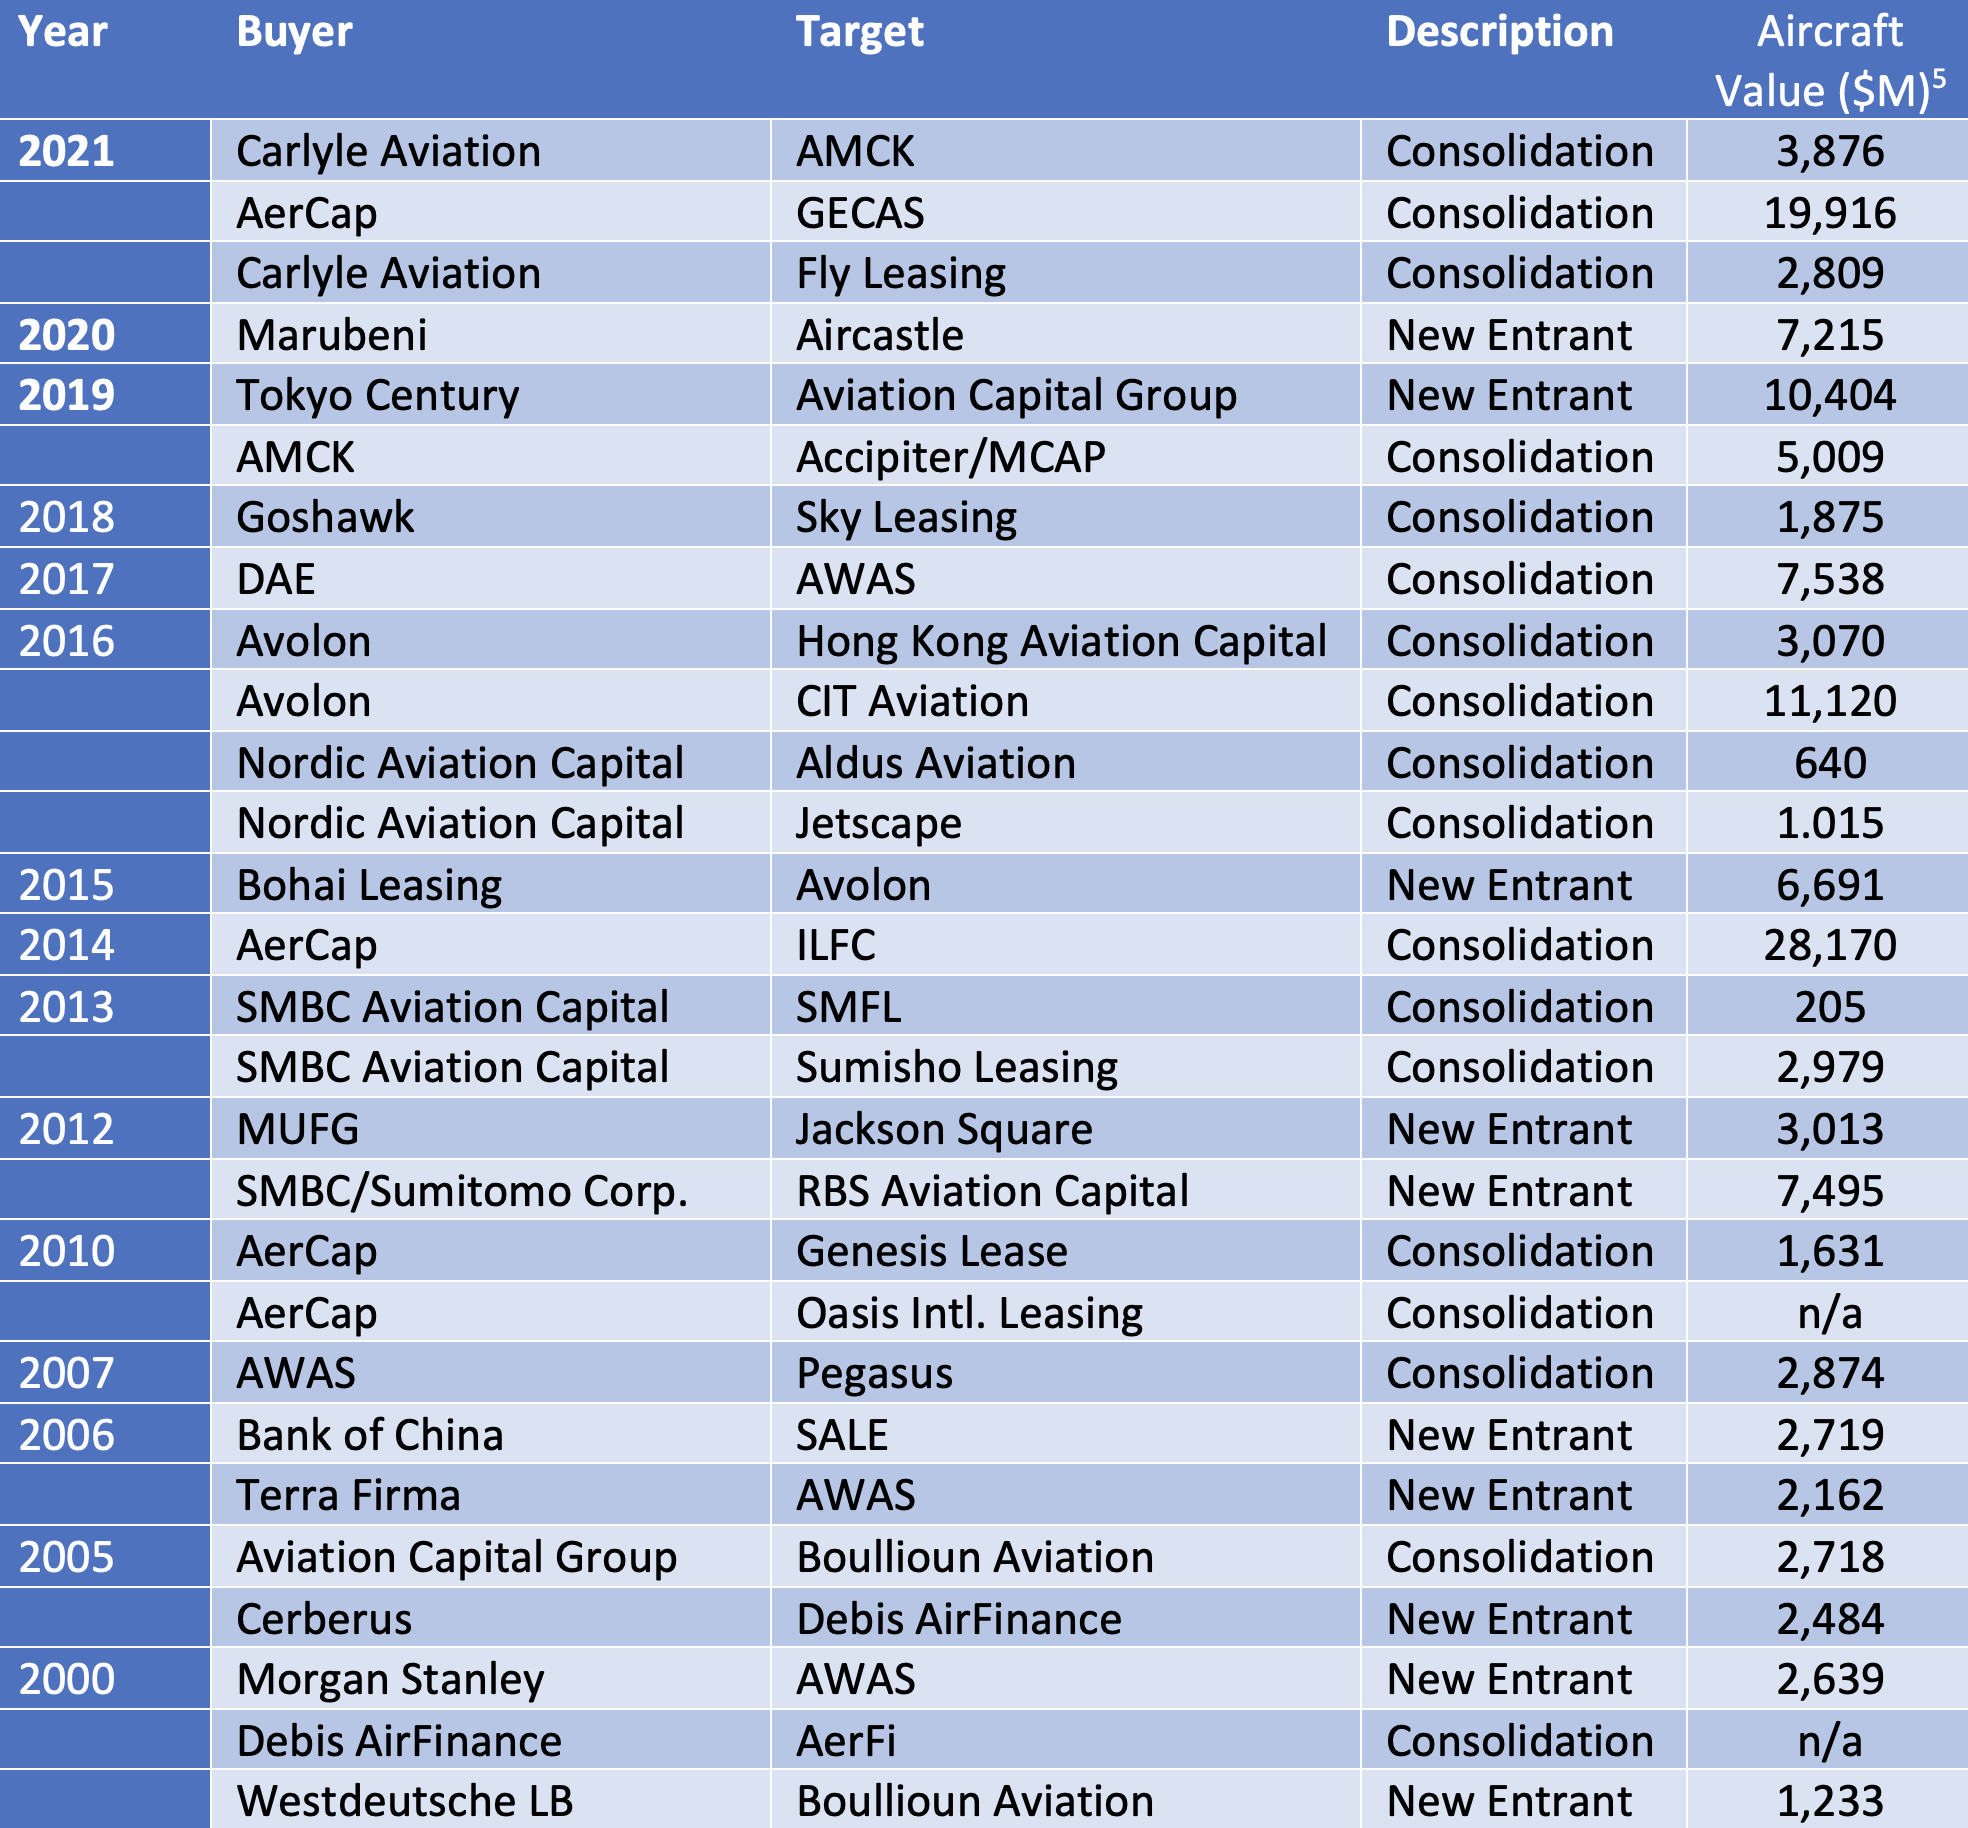
Buyer motivation varies depending on the whether they are already an industry participant. New entrants are looking to avoid the challenges of establishing a business from scratch and put a value on the asset management platform as well as the aircraft portfolio. Transactions driven by consolidation tend to be about scaling up an existing business and can involve significant attrition for employees of the target company.
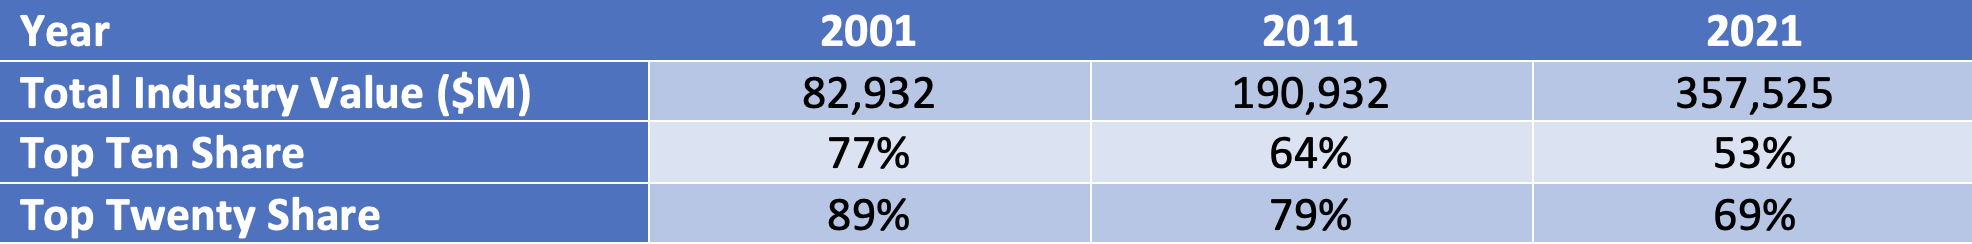
The number and scale of transactions has clearly increased since 2010 but this does not necessarily mean the industry has become more concentrated as the total value of the industry has increased as well. The table below shows shares of total industry value for the top ten and top twenty lessors since 2001. The industry has become more fragmented with the share of the top ten dropping by 24% and the top twenty by 20%, slightly less[6].
A big part of the recent history of aircraft leasing industry structure is the impact of new entrants from China, starting with Bank of China’s acquisition of SALE in 2006. There have been a significant number of these new entrants and they comprise ten of the top twenty and 35% of total industry assets at December 2021. Apart from Bank of China the only other Chinese new entrant to acquire an existing platform has been Bohai Leasing, which bought Avolon in 2015. The other new entrants have been highly price-competitive, particularly for sale-leasebacks of new aircraft, which has limited the ability of industry incumbents to grow as much as they might have anticipated.
Consolidation can be a very sensible reaction to this kind of aggressive competition. It does not necessarily improve profitability – the chart below shows profitability vs size for a broad range of aircraft lessors from 2010 to 2020 and there is only a modest upward trend. This should not be a surprise because the aircraft leasing market is efficient, and scale does not confer pricing power.
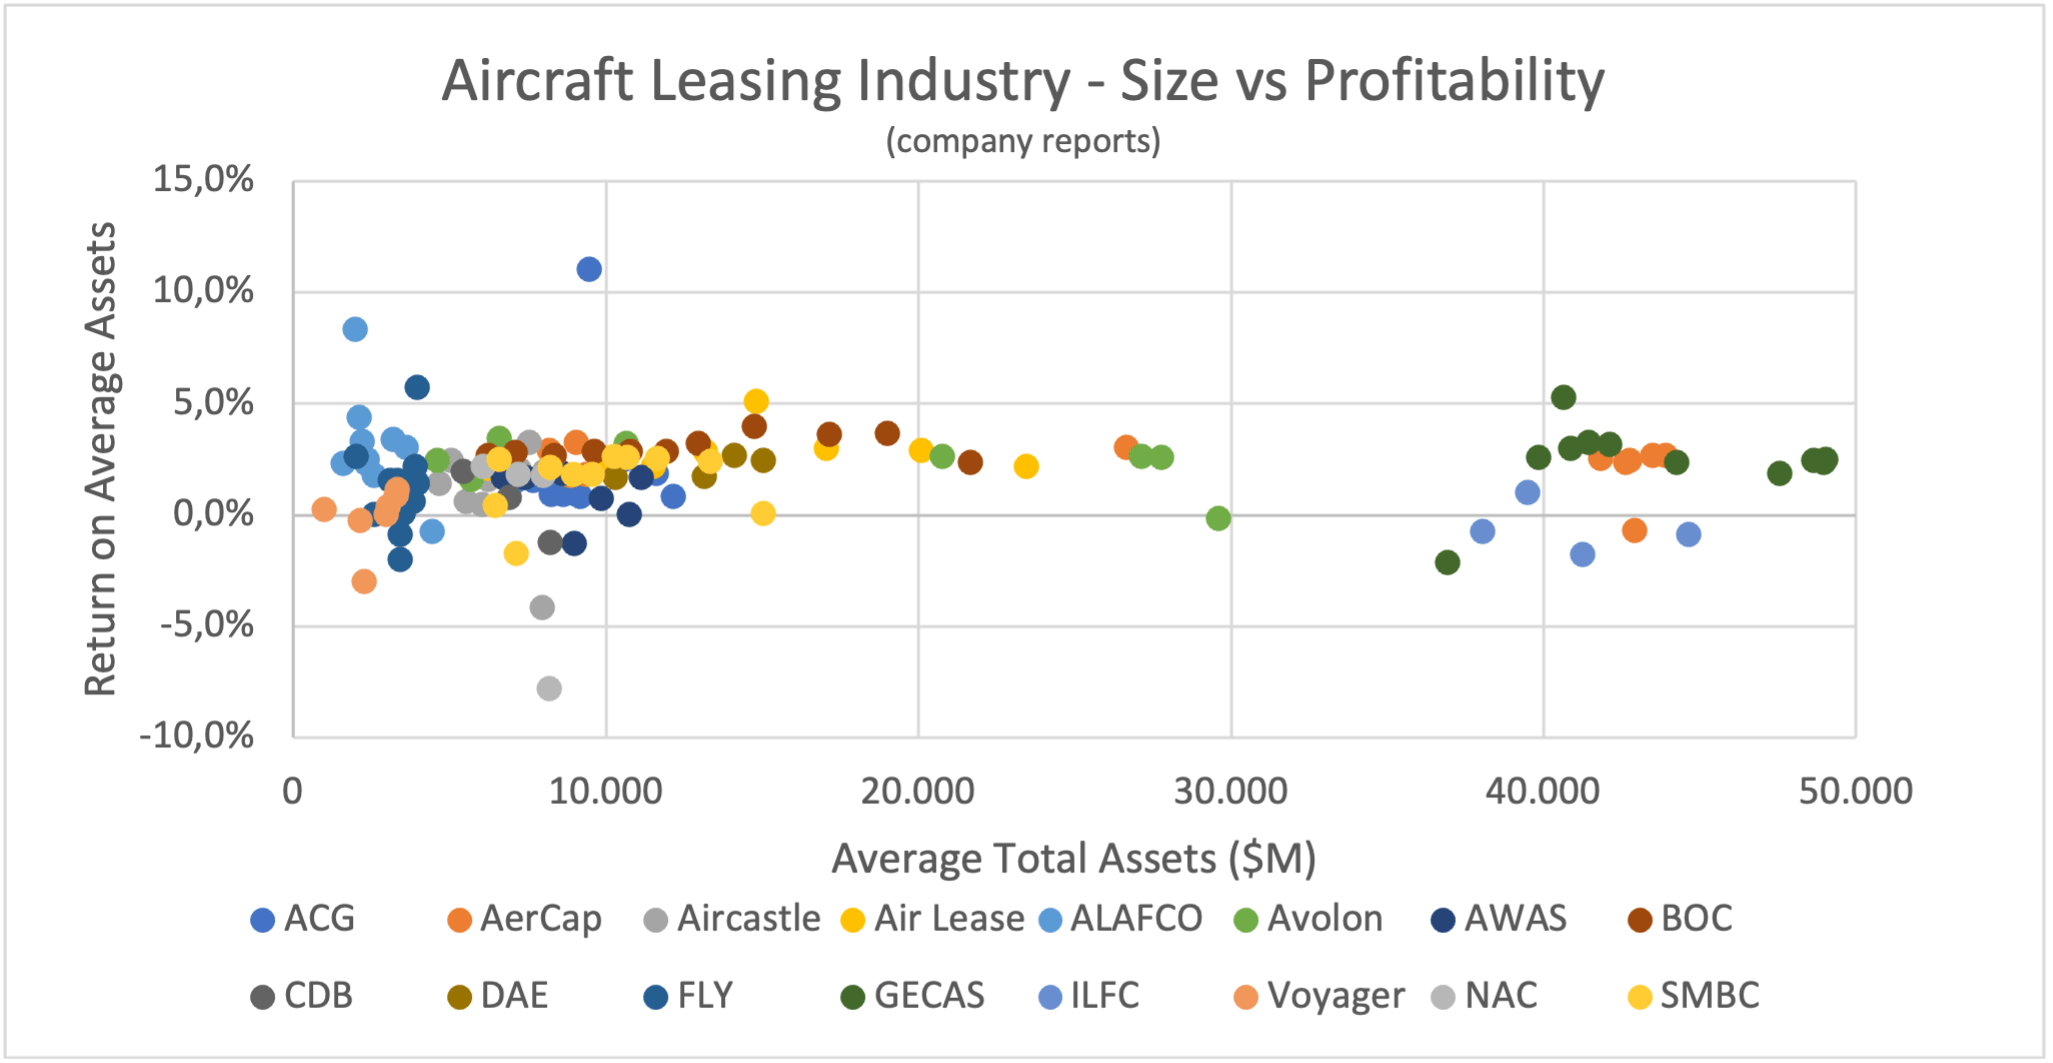
However, growth through acquisition can avoid some of the disadvantages of “organic” growth, particularly the acquisition of aircraft types that are not well suited to leasing, such as those with a limited airline customer base. Most of the outliers in the chart on the upside are US lessors that benefitted from President Trump’s one-off changes to corporate taxation in 2017 (we use after-tax profits so we can include GECAS on an apples-to-apples basis). The big outlier in terms of ROA on the downside is Nordic Aviation Capital, a specialised regional aircraft lessor, in 2020.
When one looks at the scatter plot for the largest lessors there are single loss-making years for AerCap and GECAS, both in 2020 as a result of COVID-19. However, there is consistent weak performance from ILFC in the period 2010-2013, mainly caused by asset impairments. ILFC did not make any material acquisitions and had a very high concentration on twin-aisle aircraft.
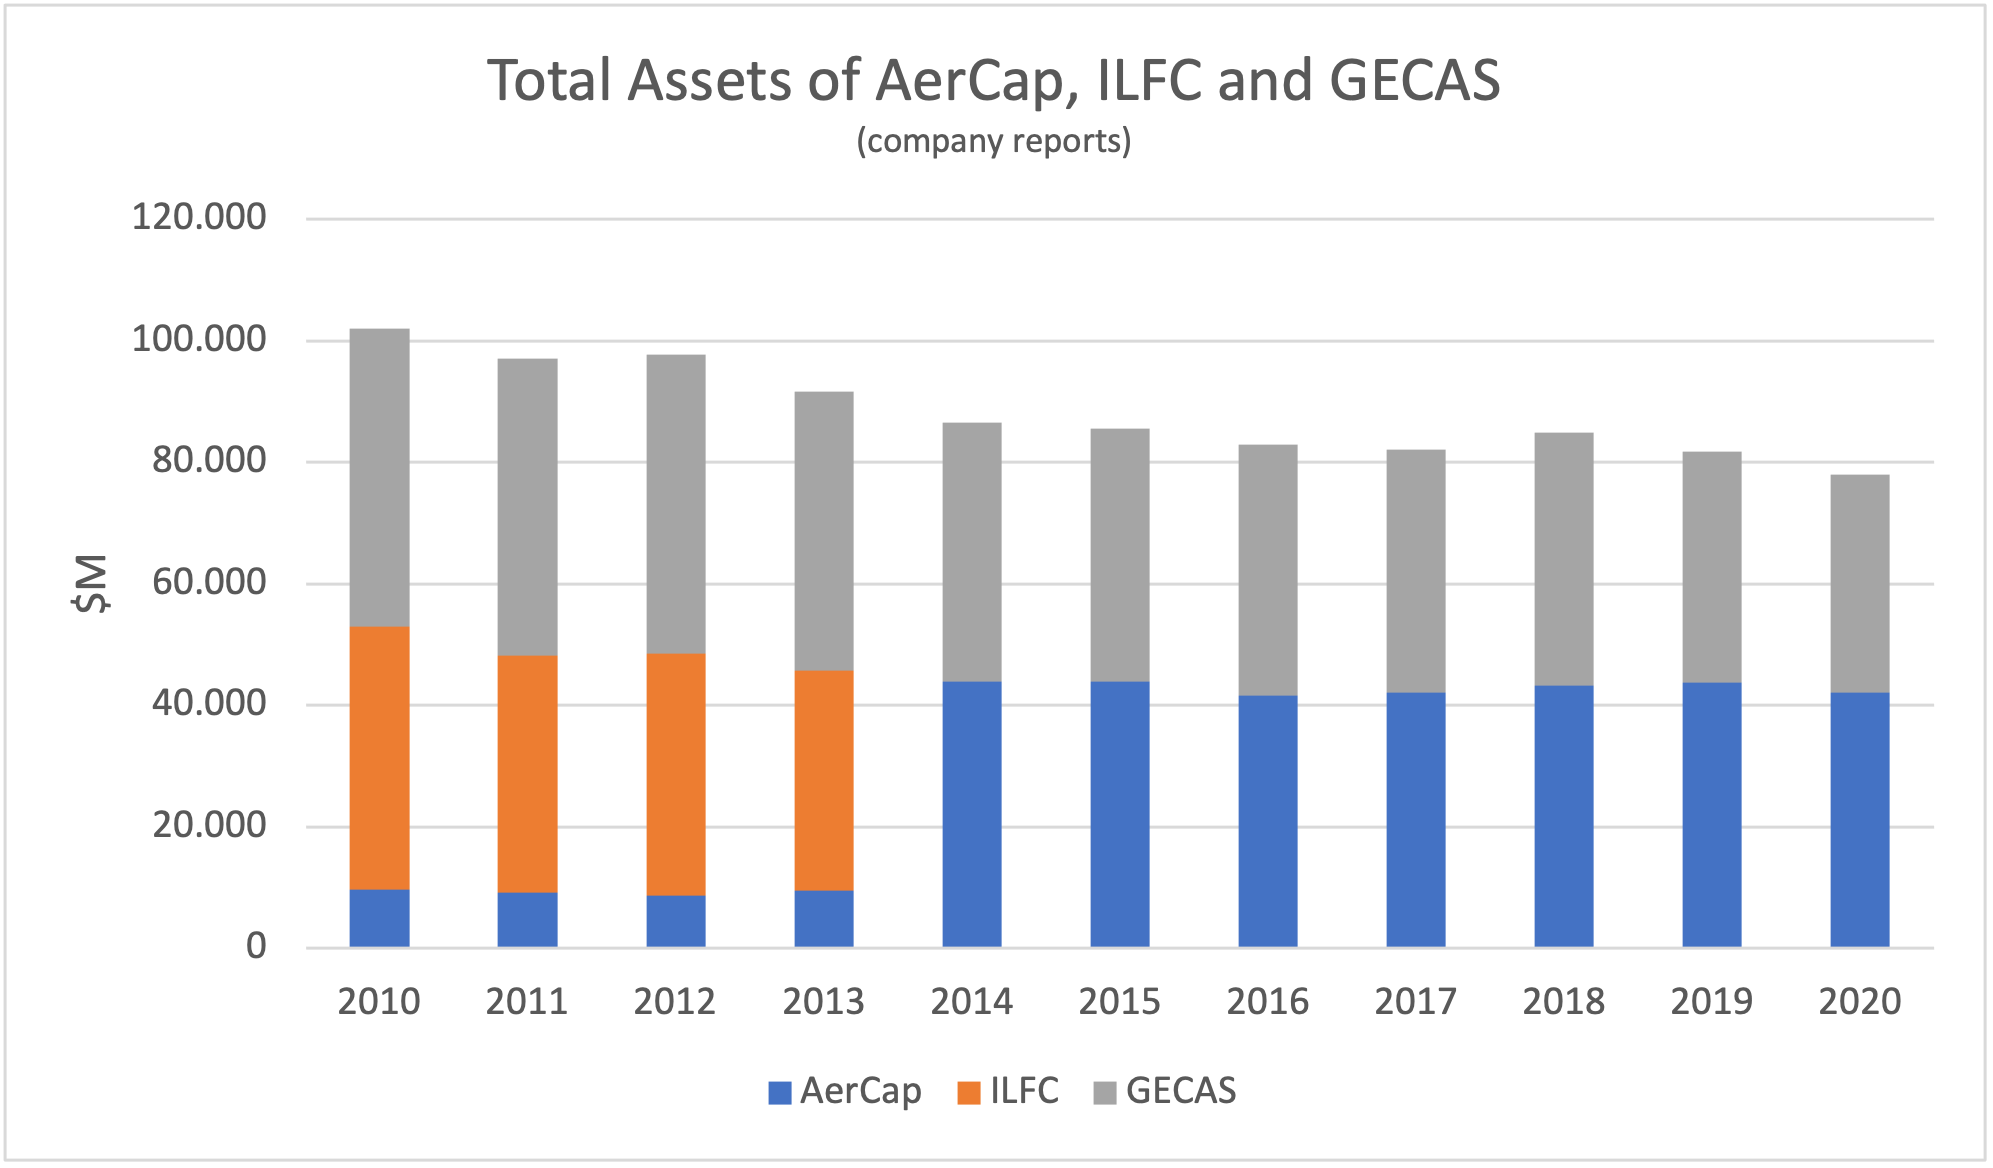
AerCap’s acquisition of GECAS means that it now owns both of the traditional industry “big two” (it acquired ILFC in 2014). From 2010 to 2020 the aggregate total assets of these three companies declined by over 20% while the overall value of the aircraft leasing industry more than doubled. This absolute and relative decline shows the growth challenges faced by well-established lessors when faced with unprecedented price competition.
However, there are number of good reasons to do this transaction apart from growth. AerCap will remain the industry leader in terms of scale for the foreseeable future which should help it when negotiating new aircraft acquisitions from Airbus and Boeing, and It also has the opportunity to reduce its S, G & A costs relative to assets. Although it may be hard to grow the business in absolute terms AerCap has demonstrated its ability to grow shareholder value in recent years by selling aircraft at a healthy profit and buying back shares at a discount to book value. It can keep doing this and will retain the option to increase its new aircraft purchases through sale-leasebacks if that market tips in favour of the buyer.
Disclaimer
This document is for informational purposes only. It is not intended as advice or a recommendation with respect to any transaction. The recipient of this document shall be solely responsible for making its own independent investigation and appraisal of any transaction. No market or company data or other information is warranted or guaranteed by Sirius Aviation Capital as to its completeness, accuracy, or fitness for a particular purpose, express or implied, and such data and information are subject to change without notice. Any comments or statements made herein reflect the assumptions, views, and analytical methods of the persons that prepared this document as of its date of preparation, and do not necessarily reflect the views of Sirius Aviation Capital. Sirius Aviation Capital may have issued, and may in the future issue, other communications that are inconsistent with, and reach different conclusions from, the information presented herein. Sirius Aviation Capital specifically disclaims any obligation to update this document, or any comments or statements contained herein.
[1] The crack spread is the difference between the price of crude oil and the fuel products extracted from it.
[2] RPKs is the acronym for revenue passenger kilometres which is the product of the number of passengers flown and distance flown.
[3] ASKs is the acronym for available seat kilometres, which is the product of the number of seats flown and distance flown. This is the basic measure of airline industry capacity.
[4] Airbus normally quotes its production rates based on an 11.5-month year for single-aisle aircraft and an 11-month year for twin-aisle aircraft.
[5] Aircraft value figures are determined by using historic Avitas CMVs for all aircraft under management per Cirium at the year-end before acquisition. Some lessors such as FLY had outsourced aircraft management so no meaningful numbers are available on this basis. For Fly Leasing and Genesis Lease we have used aircraft net book value at the year-end prior to acquisition. Aircraft value as calculated here will tend to understate total transactions value because aircraft lessors have significant other assets including cash and predelivery payments.
[6] Lessor fleet statistics include all managed aircraft per Cirium Fleets Analyser and values are historic Avitas CMVs.