
Macro-Economic Background
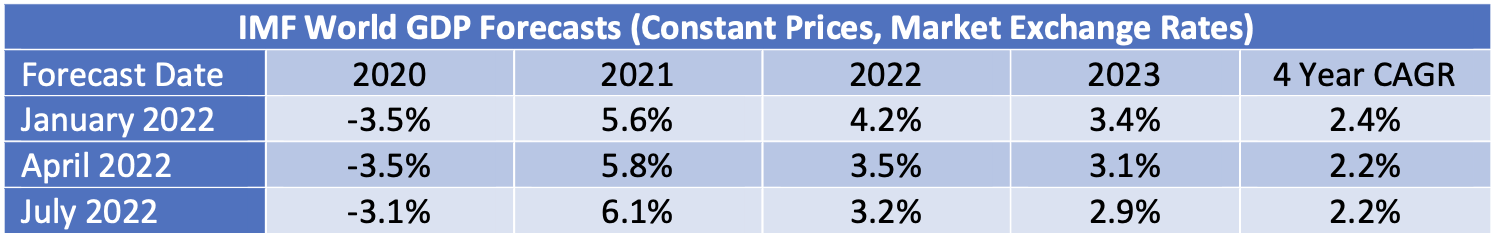
The IMF’s latest World Economic Outlook (July 2022) shows modest decreases for forecast growth in 2022 and 2023, although looking over the entire period since the onset of the pandemic these reductions are entirely offset by upward revisions to 2020 and 2021.
Global economic growth is vital to the long-term growth of air travel. However, in the next few years the key drivers of growth will likely be very specific to the airline industry, especially the recovery from the industry downturn caused by the Covid 19 pandemic.
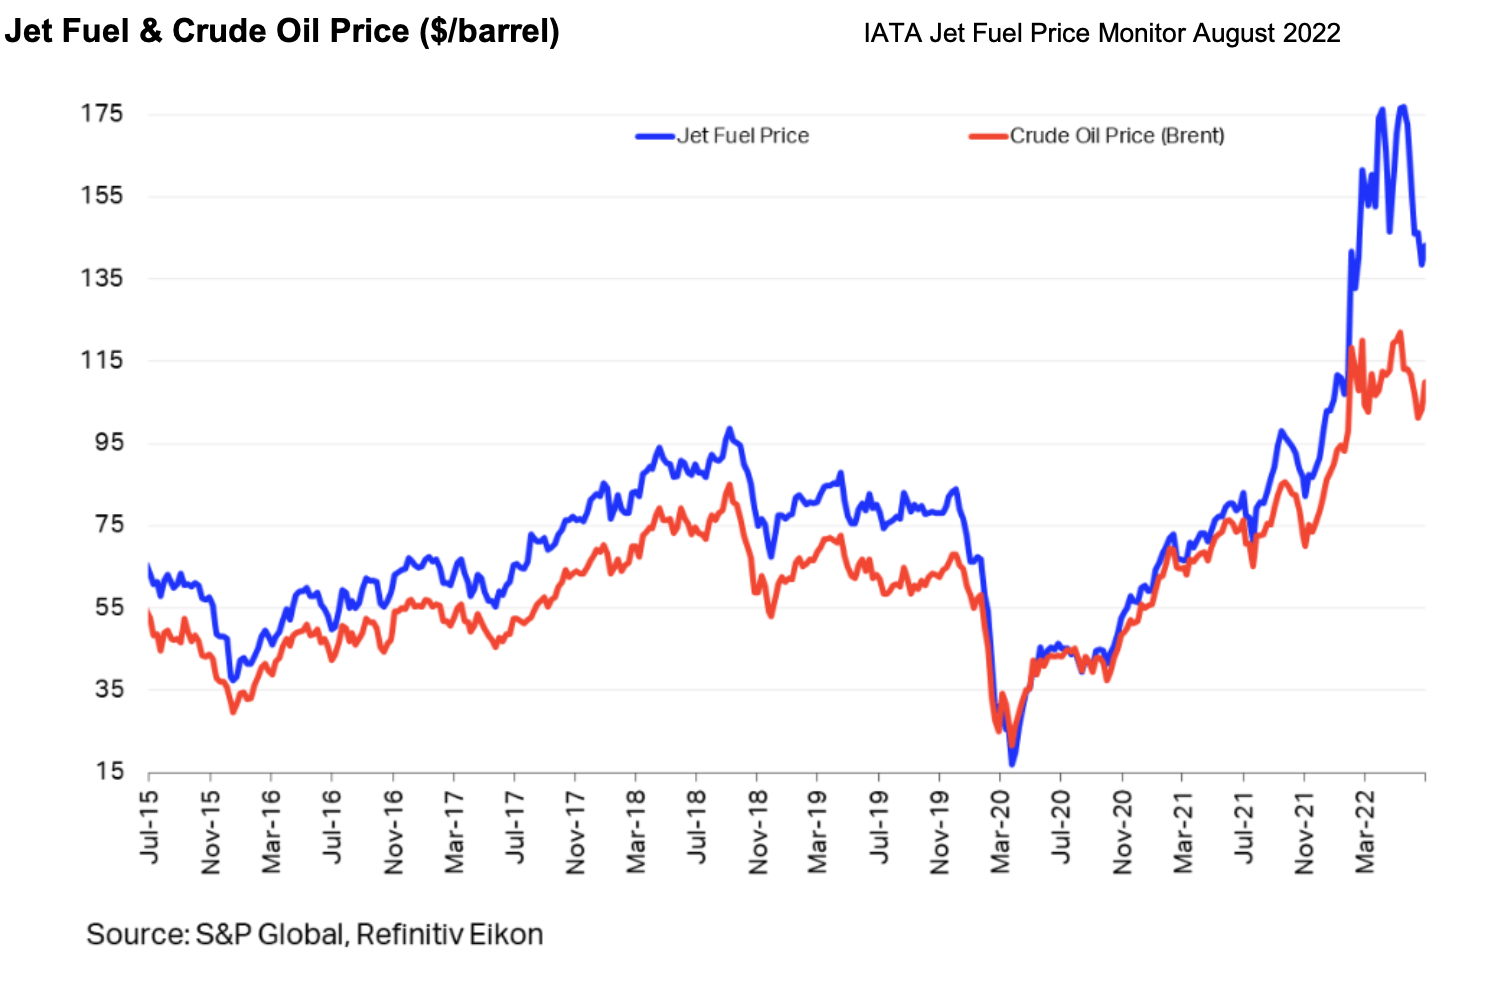
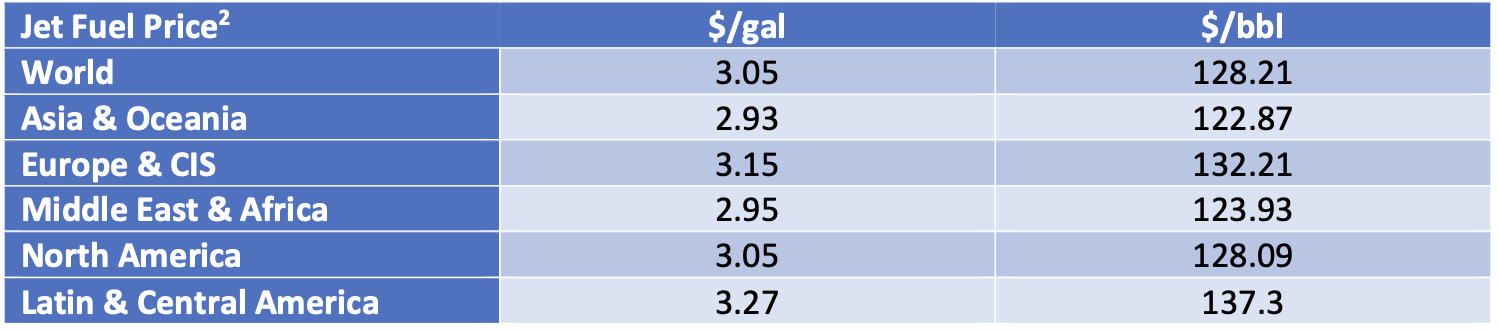
Fuel prices have dropped by nearly 50 cents per gallon since May, and the maximum spread between different regions has dropped from 13% to 11%. Although the reduction in variability between regions suggests that supply chain disruption is abating the “crack spread”[1] remains very high by historic standards.
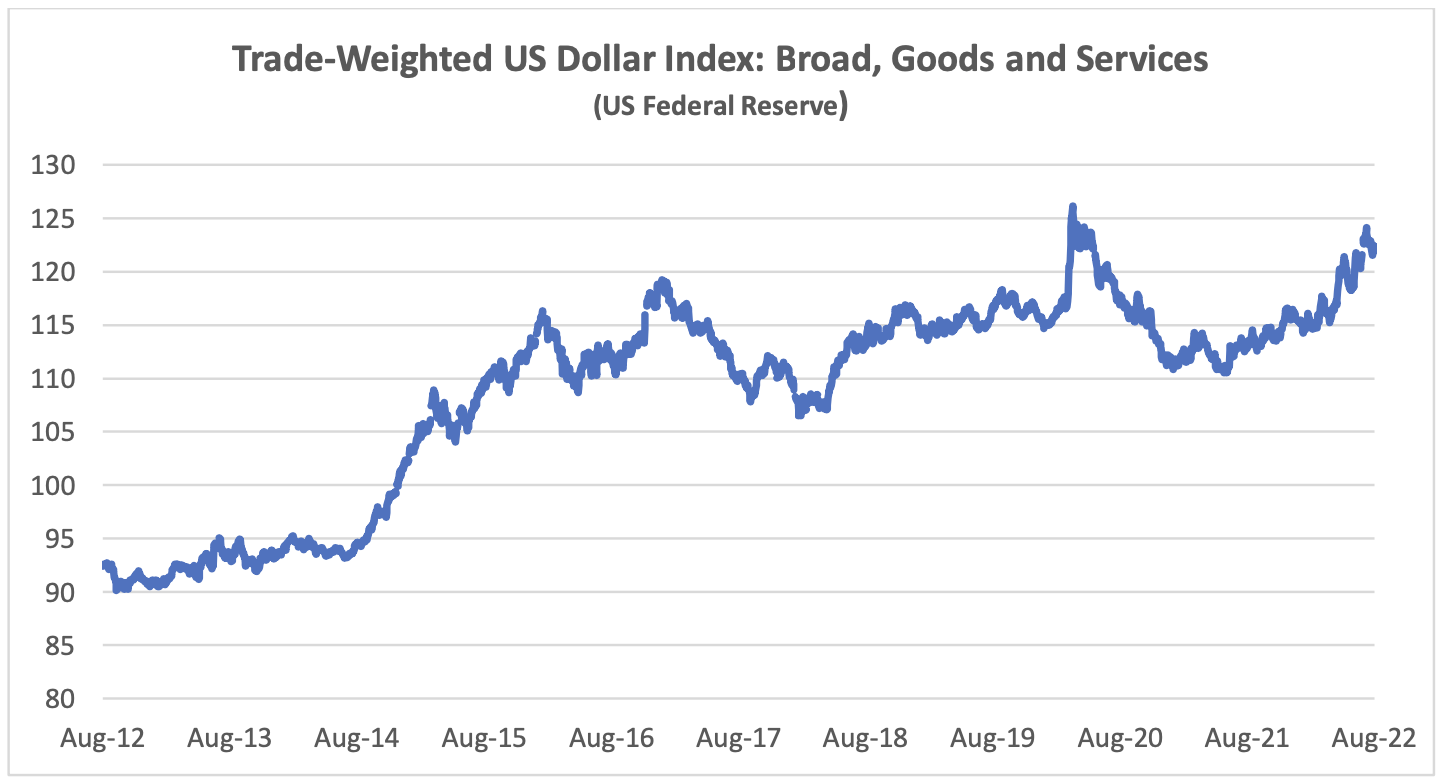
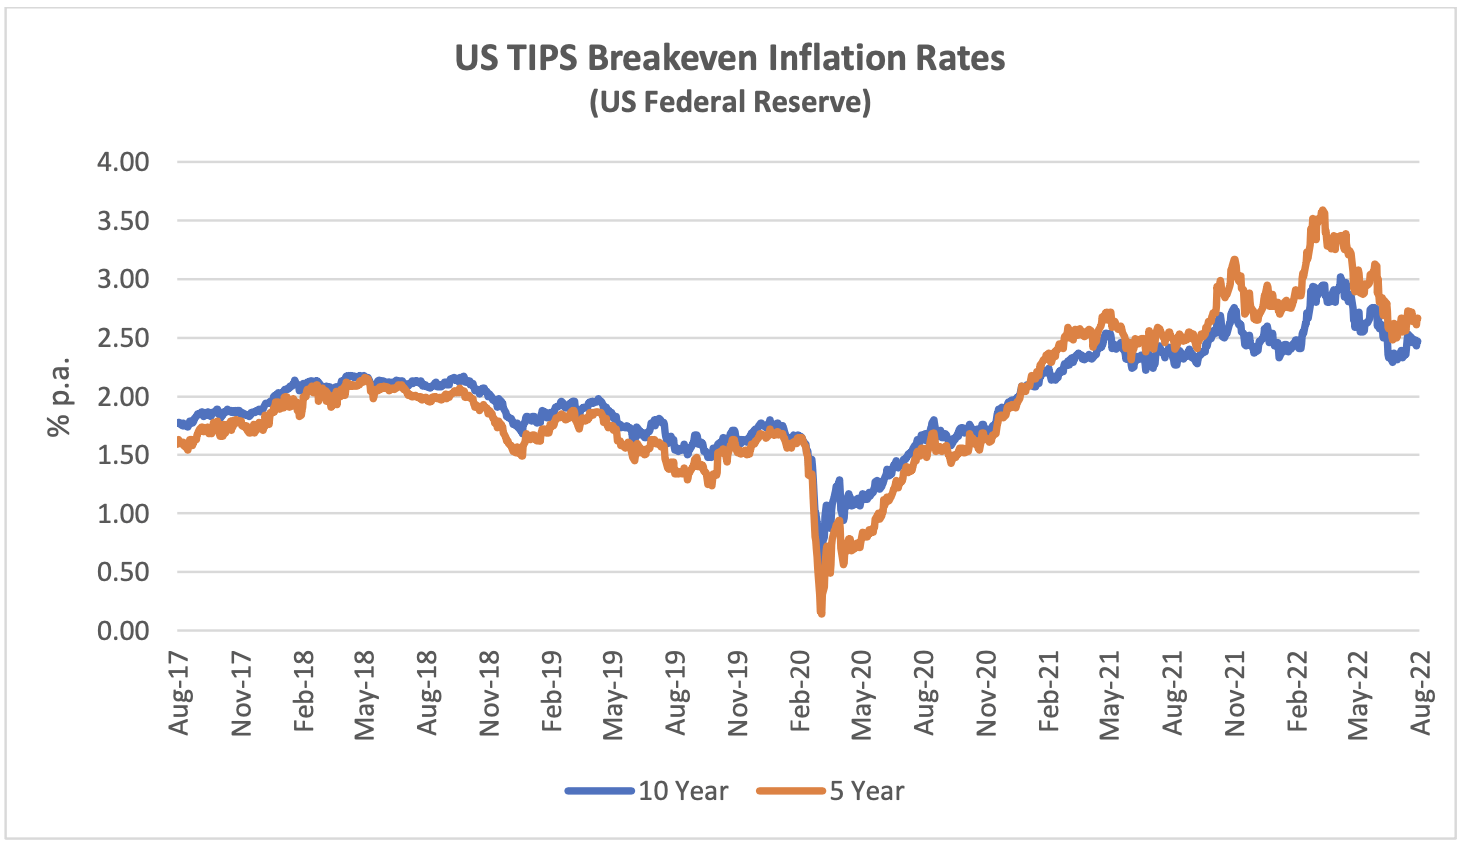
For airlines outside of the US the impact of the high cost of fuel has been compounded by a strengthening US Dollar. This is a very important factor in airline financial performance because so many airline costs are typically US Dollar-denominated – not just fuel but also aircraft rents, debt service, aircraft, and spare parts.
The chart below compares the breakeven rate for 10-year and 5-year TIPS to highlight the differences in expectations for the different time horizons. The shorter maturity has been more volatile, especially since the onset of the pandemic, but there is a strong overall correlation that suggests changed inflation expectations are not for a transitory “blip”.
Traffic and Aircraft Demand
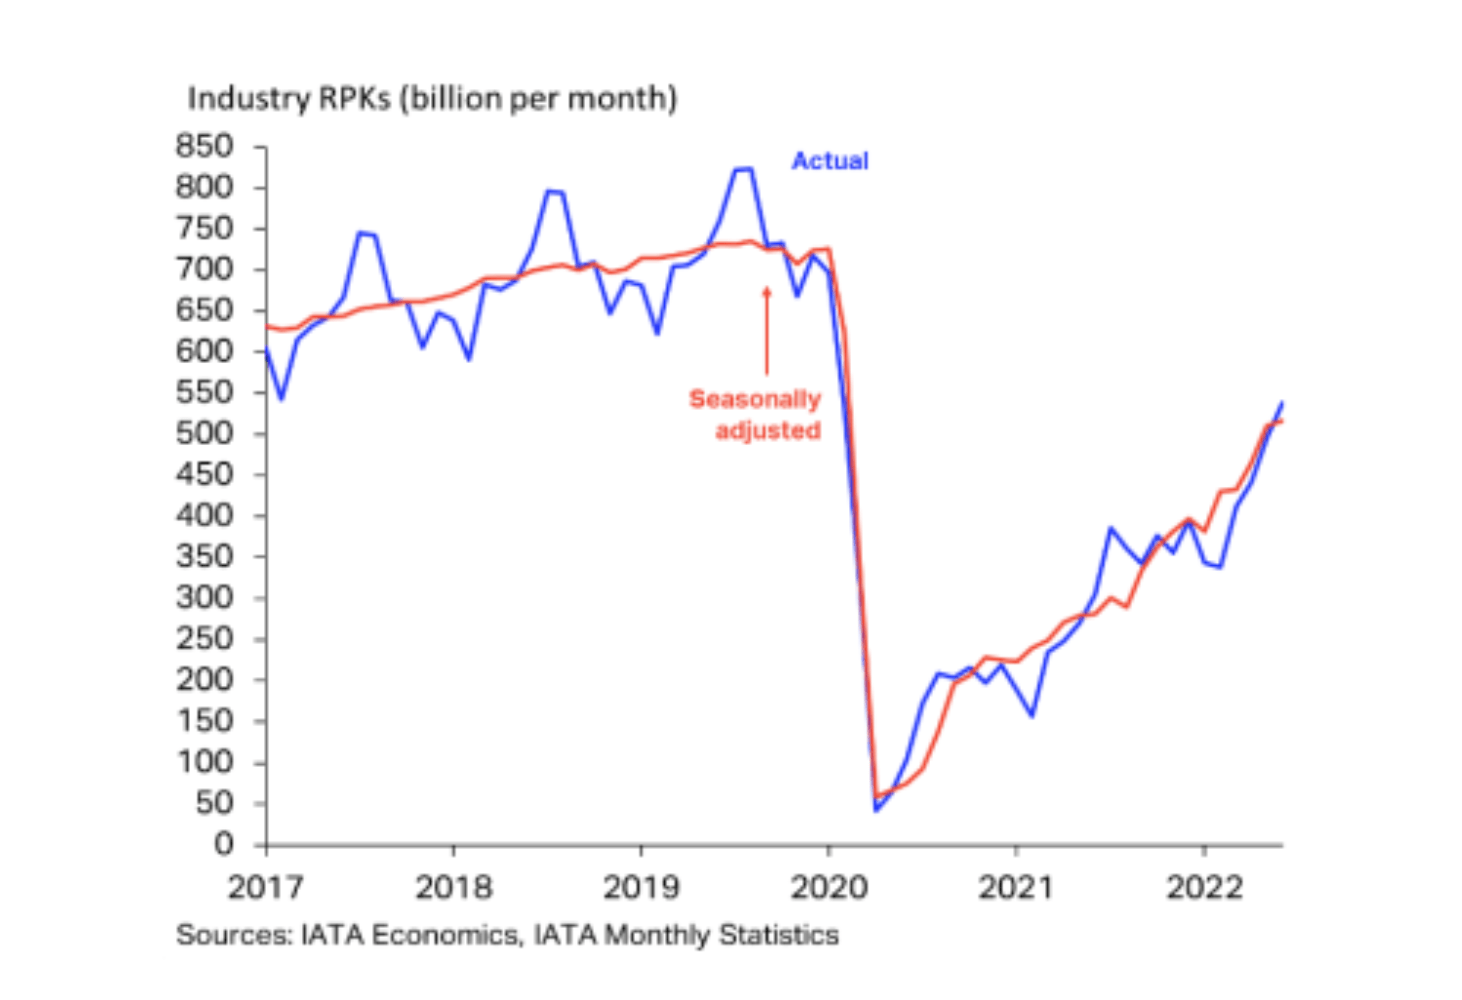
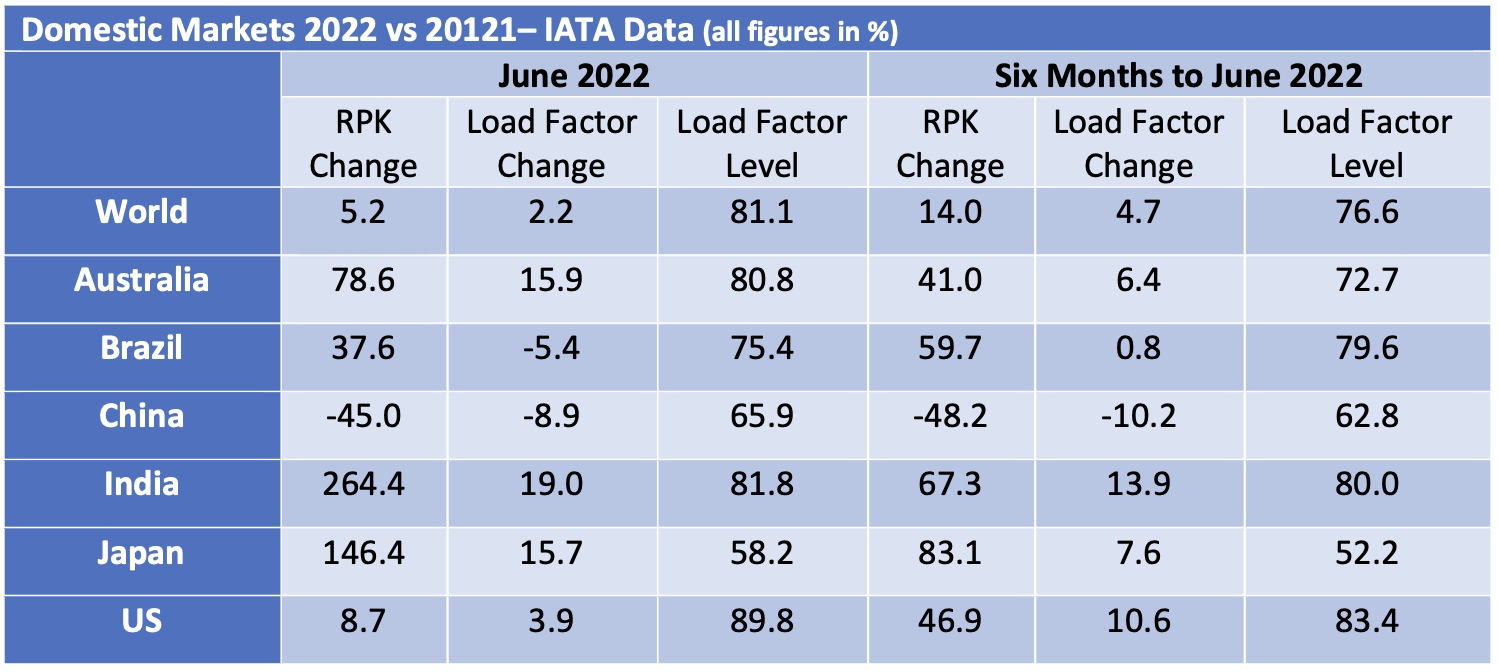
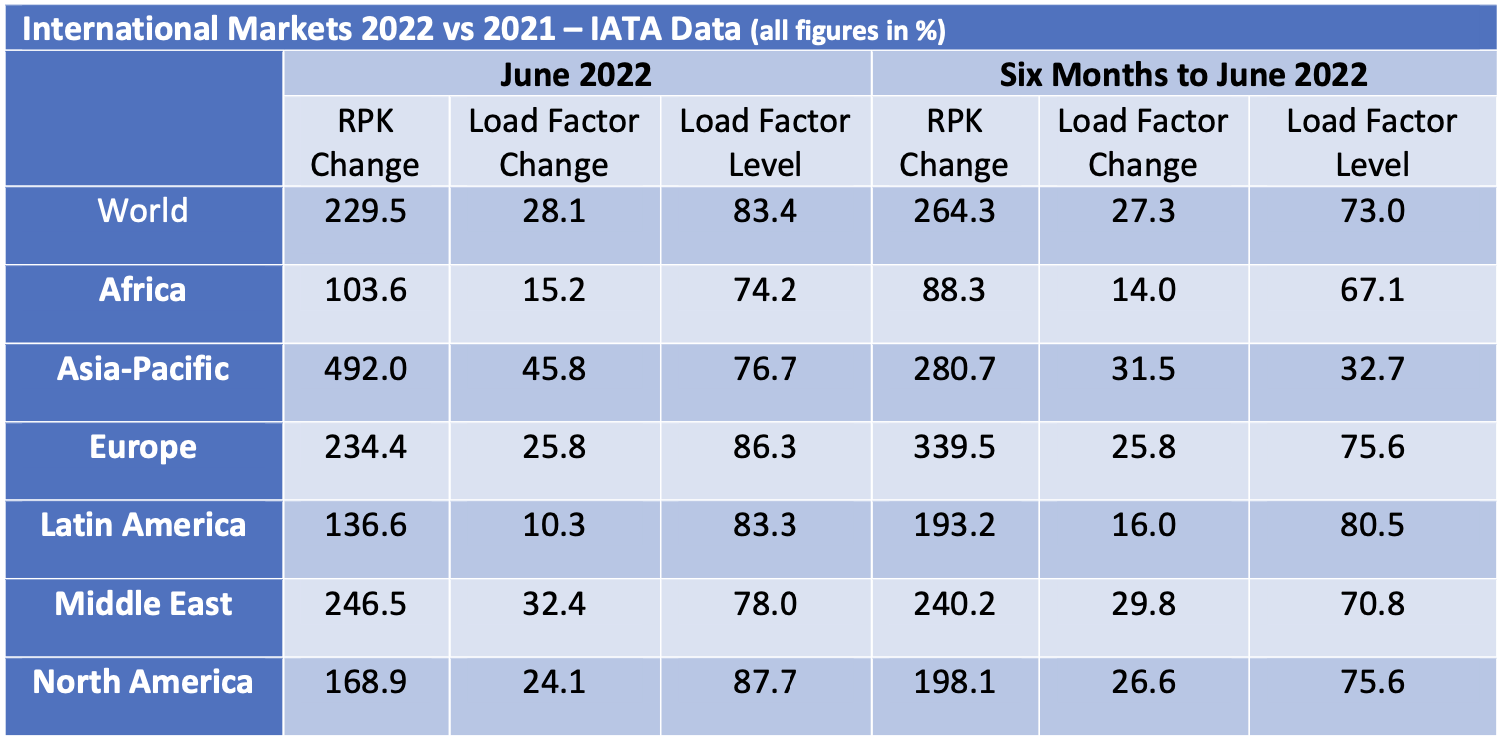
The strong recovery in air travel at the start of 2022 has continued through June although overall RPKs for the month of June remained 29.2% below the comparable figures for 2019. Europe and the Middle East are the strongest performing regions because their recovery has mainly occurred this year, whereas the Americas already achieved a significant recovery in 2021. Traffic growth in Asia Pacific remains weak mainly due to the disruptive effect of lockdowns on domestic Chinese RPKs.
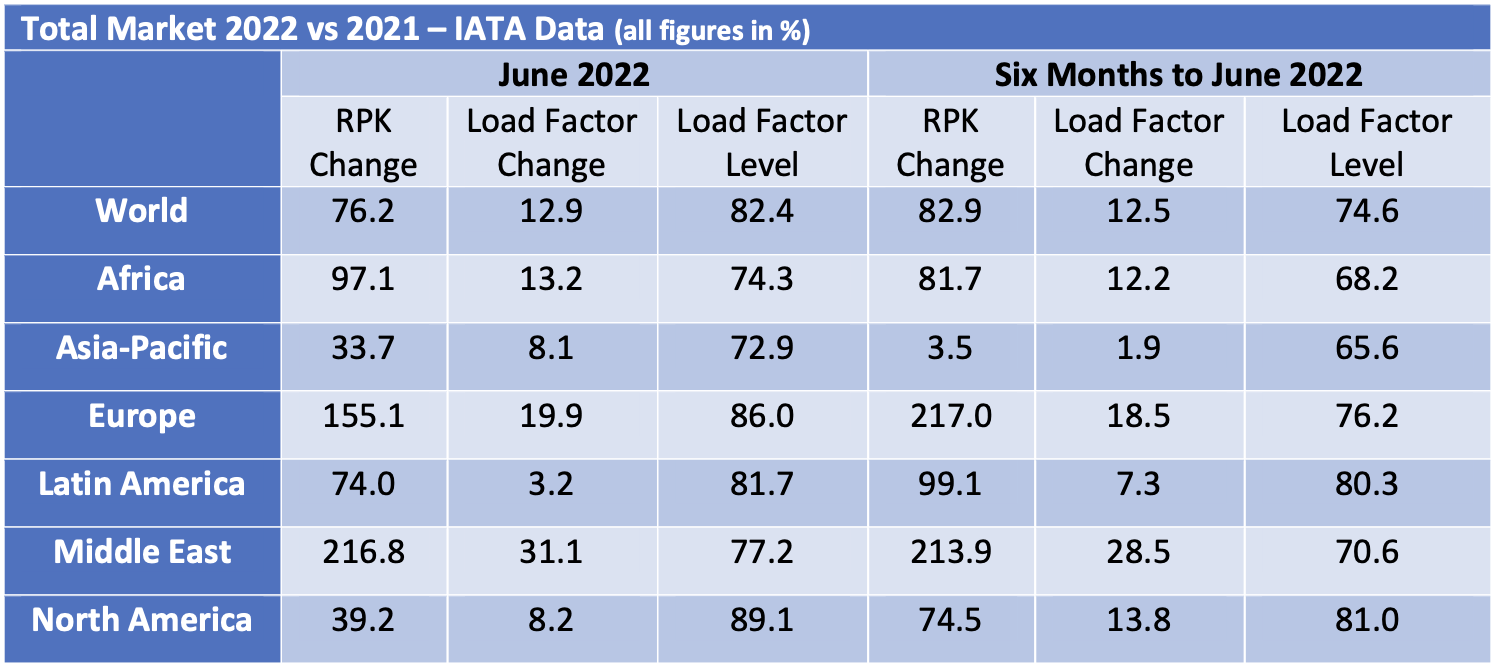
There was a much bigger increase in international traffic vs domestic traffic, mainly because the former was coming off a much lower base. The strongest international recovery was in Europe and barring further unexpected geopolitical events there is a very strong summer in prospect. It should be borne in mind that European international air travel includes much more short-haul traffic than other regions because geography limits the demand for domestic air travel outside of Russia.
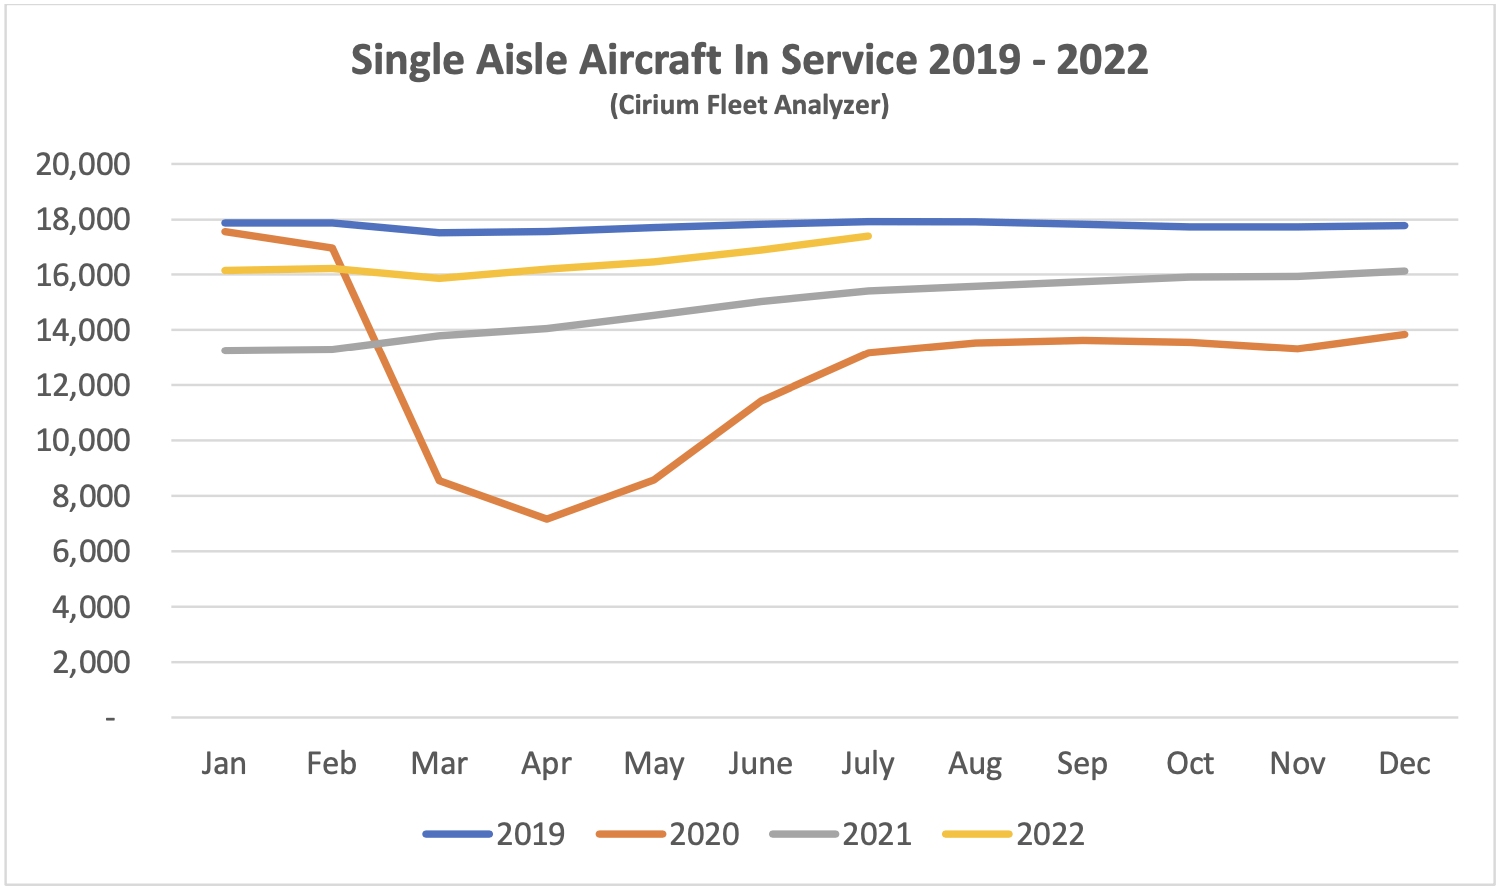
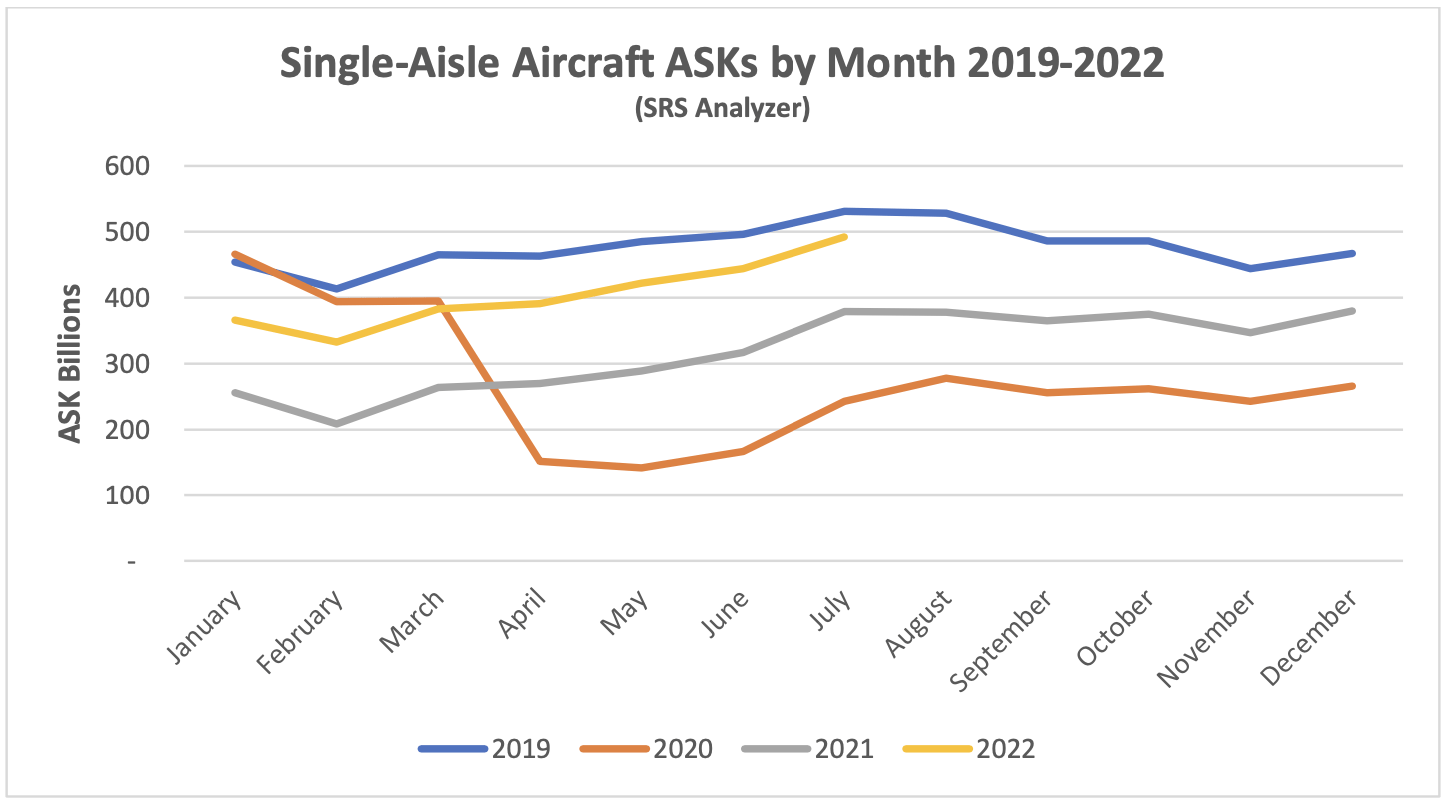
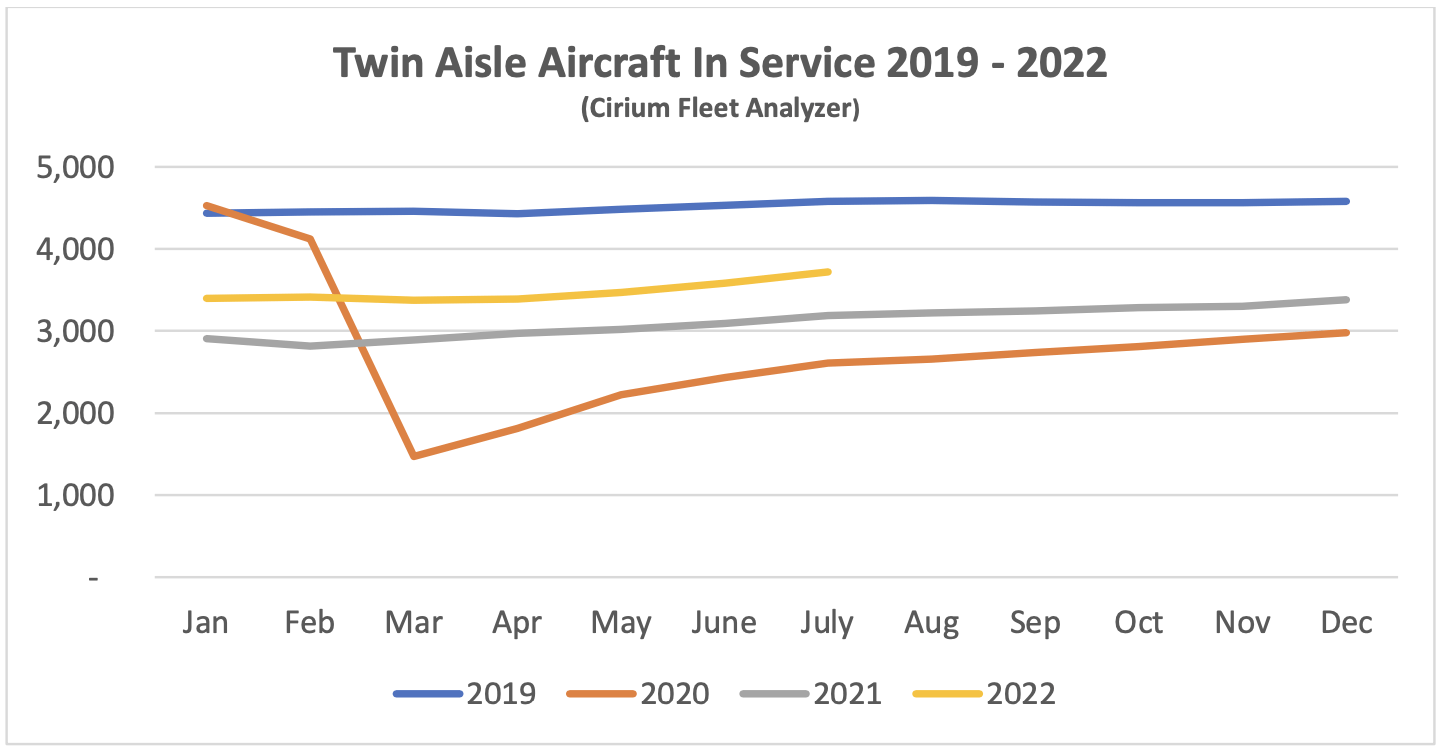
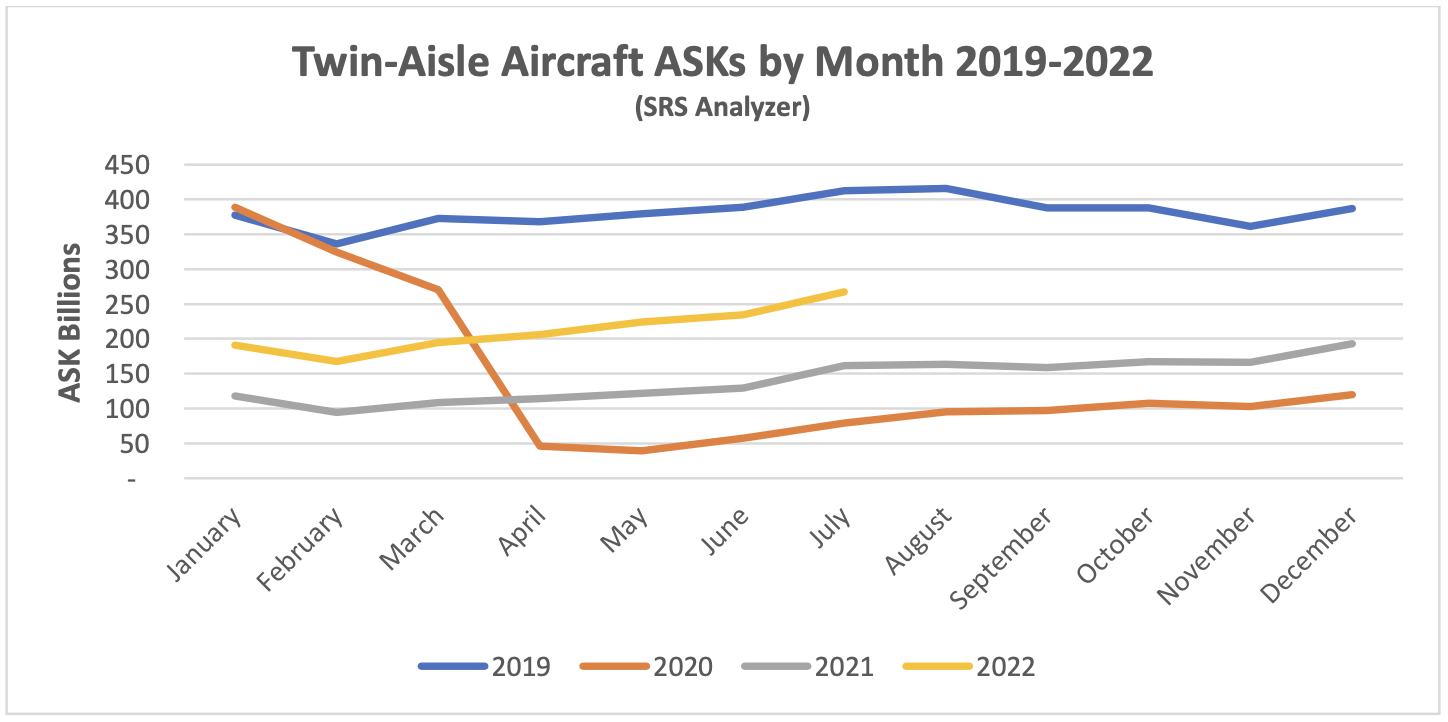
Although some short-haul aircraft serve international routes nearly all long-haul aircraft do so, and this is reflected in the relative demand for single-aisle (narrowbody) and twin-aisle (widebody) aircraft. Aircraft demand can be measured in terms aircraft in service and ASKs[3], the standard measure of aircraft capacity deployed by airlines which indicates how intensively aircraft are being flown. Single aisle aircraft in service levels are now very close to where they were in 2019 with a slightly weaker recovery in ASKs due to lower utilization. The comparable figures for twin aisle aircraft remain much weaker.
New Aircraft Supply

The latest status of Airbus’s production plans is:
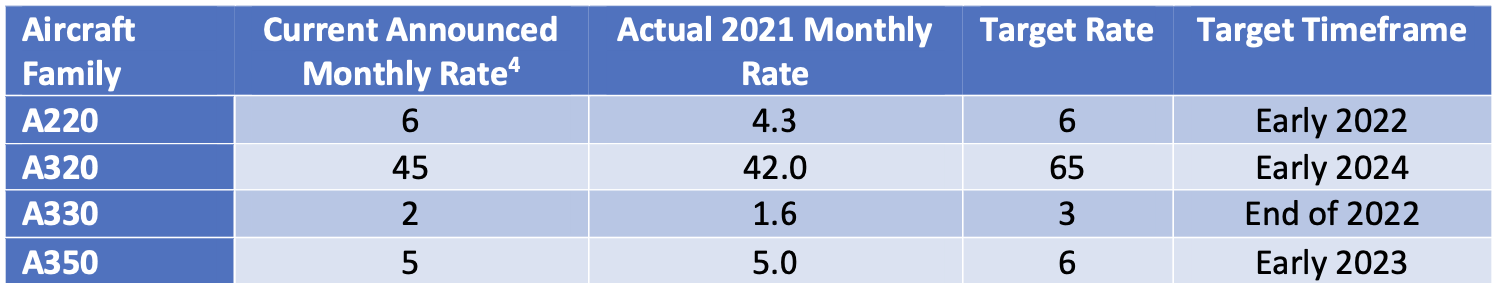
In its H1 2022 results presentation Airbus confirmed that it is aiming for an A320 production rate of 75 per month in 2025. However, due to supply chain problems it has put back the timing for its interim target of 65 per month from mid-2023 to early 2024. The A321 Neo XLR has had its target date for entry into service put back from 2023 to early 2024 and the timing for an increase in the A350 production rate has slipped from late 2022 to early 2023.
Airbus reduced its overall deliveries guidance for 2022 from 720 to 700.
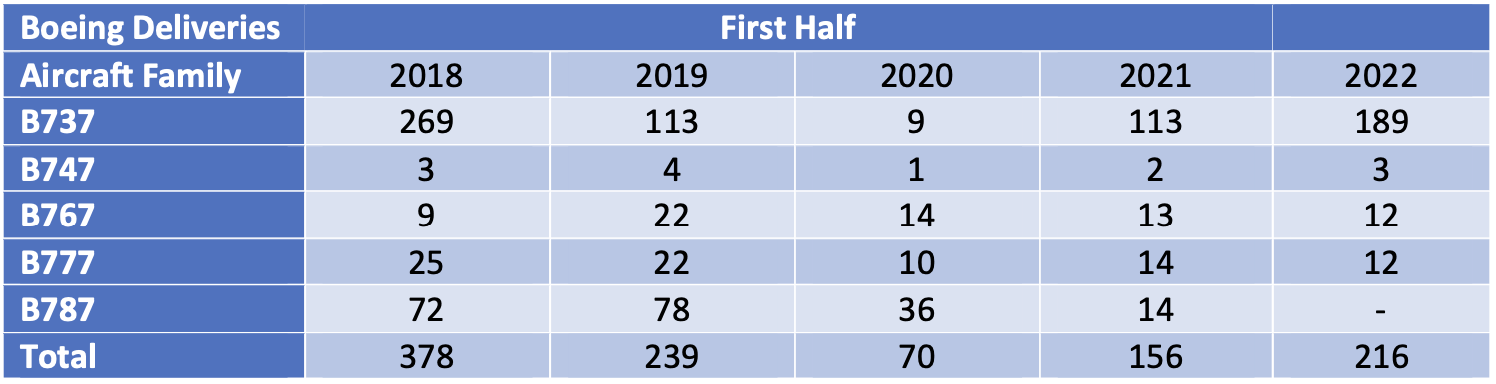
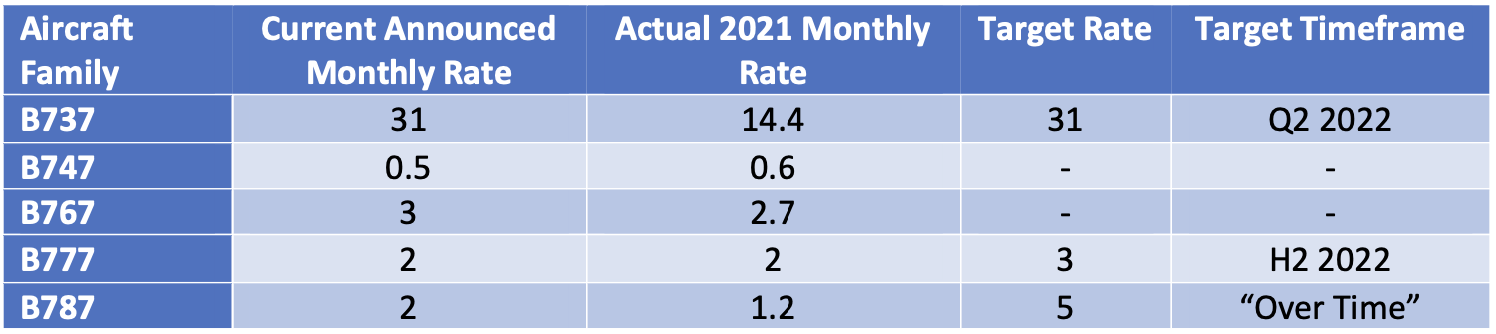
The latest status of Boeing’s production plans is:
Boeing significantly increased B737 Max deliveries in the first half of 2022 and has achieved the target monthly rate of 31 that it announced when it resumed production in 2021. Boeing’s inventory of manufactured but undelivered B737 Max aircraft is dropping very slowly, from 335 aircraft at the end of 2021 to 290 at the end of June 2022, although Boeing expects to eliminate most of this inventory by the end of 2023. Earlier discussion of an increase in production to 38 per month has been shelved due to supply chain problems.
Despite this overall success the B737 max still faces challenges. It has yet to be recertified by the Chinese authorities although this is expected to be resolved soon. Also, there is effective FAA certification deadline at the end of 2022 for the new B737 Max 7 and B737 Max 10 variants. If Boeing fails to meet this deadline these aircraft will have to be redesigned to add a new emergency alerting system, which would lead to delivery delays.
Boeing has also had quality and production problems with the B787, its main passenger twin-aisle product (nearly all B747, B767 and B777 deliveries are freighters or tankers) and has suspended deliveries since May 2021. In the last few days Boeing has announced that these issues have been resolved and deliveries will resume this month. The inventory of undelivered B787 aircraft stands at 120 and there is as yet no firm timetable for this to be eliminated. Also, entry into service for the B777X has been pushed back by a year until early 2025 because of certification difficulties with the FAA.
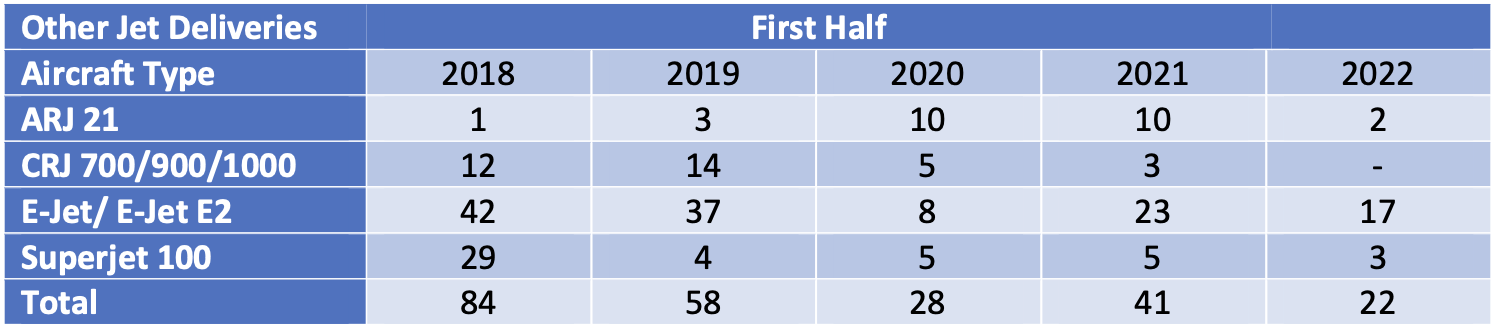
The number of commercial jets delivered by OEMs other than Airbus and Boeing has halved in the first half of 2022 compared to the same period in 2021. Modest declines for the CRJ and SSJ are due to the former ending production and the impact of sanctions on Sukhoi, in particular the announcement by the SSJ’s engine supplier Powerjet that it is withdrawing from the Russian market. The production decreases at COMAC and Embraer are more short term as the former has a strong backlog and the latter is guiding 60-70 deliveries for the full year.
Airline Industry Financial Performance
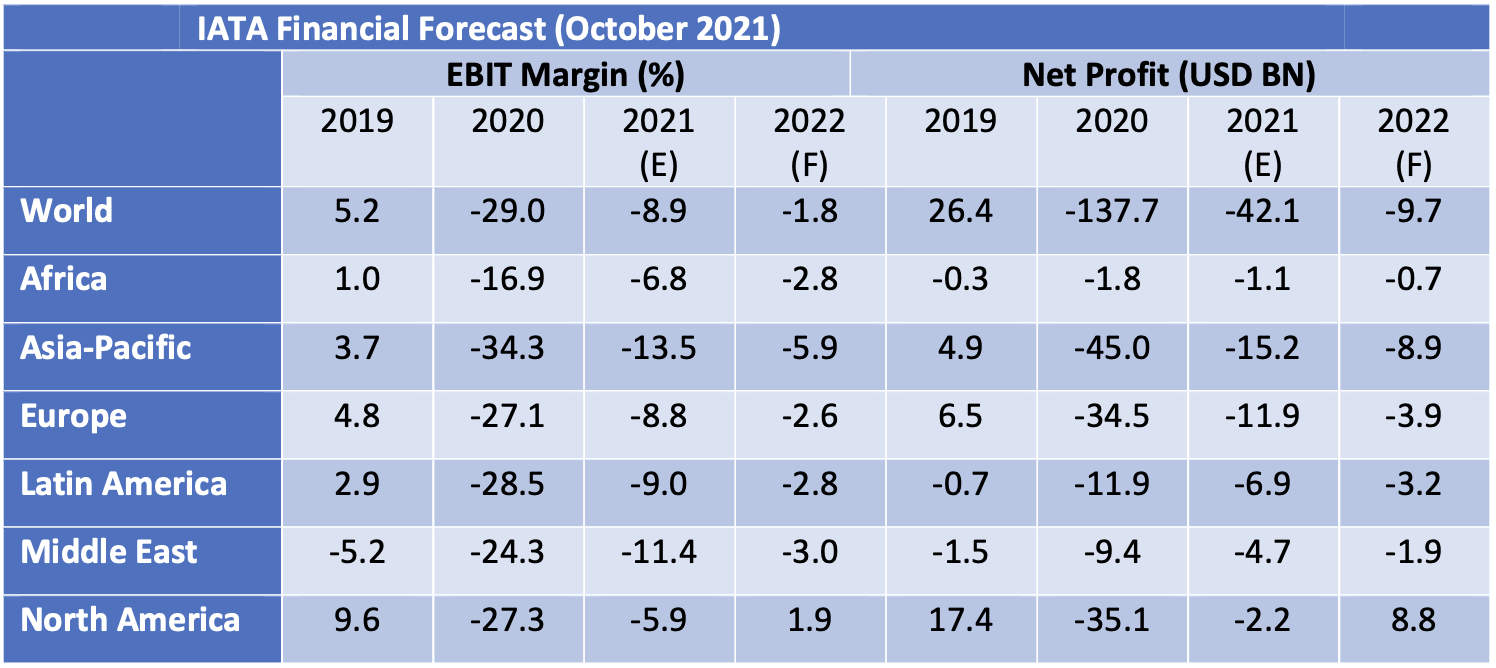
IATA’s June 2022 financial forecast shows the airline industry returning to near breakeven in 2022. North America is set to be the first region to move back into net profit and Europe is forecast to be the next best performer on an EBIT Margin basis. The forecast shows a general pattern of modest improvements compared to its predecessor in October 2021 except for a much-improved outlook for Europe and a much less favourable outlook for Asia-Pacific. Europe’s relative performance is much better than in 2021 due to positive impacts of its Covid passport scheme and the re-opening of North Atlantic travel, whereas Asia-Pacific is suffering from both lockdowns in China and more persistent government travel restrictions than in other regions.
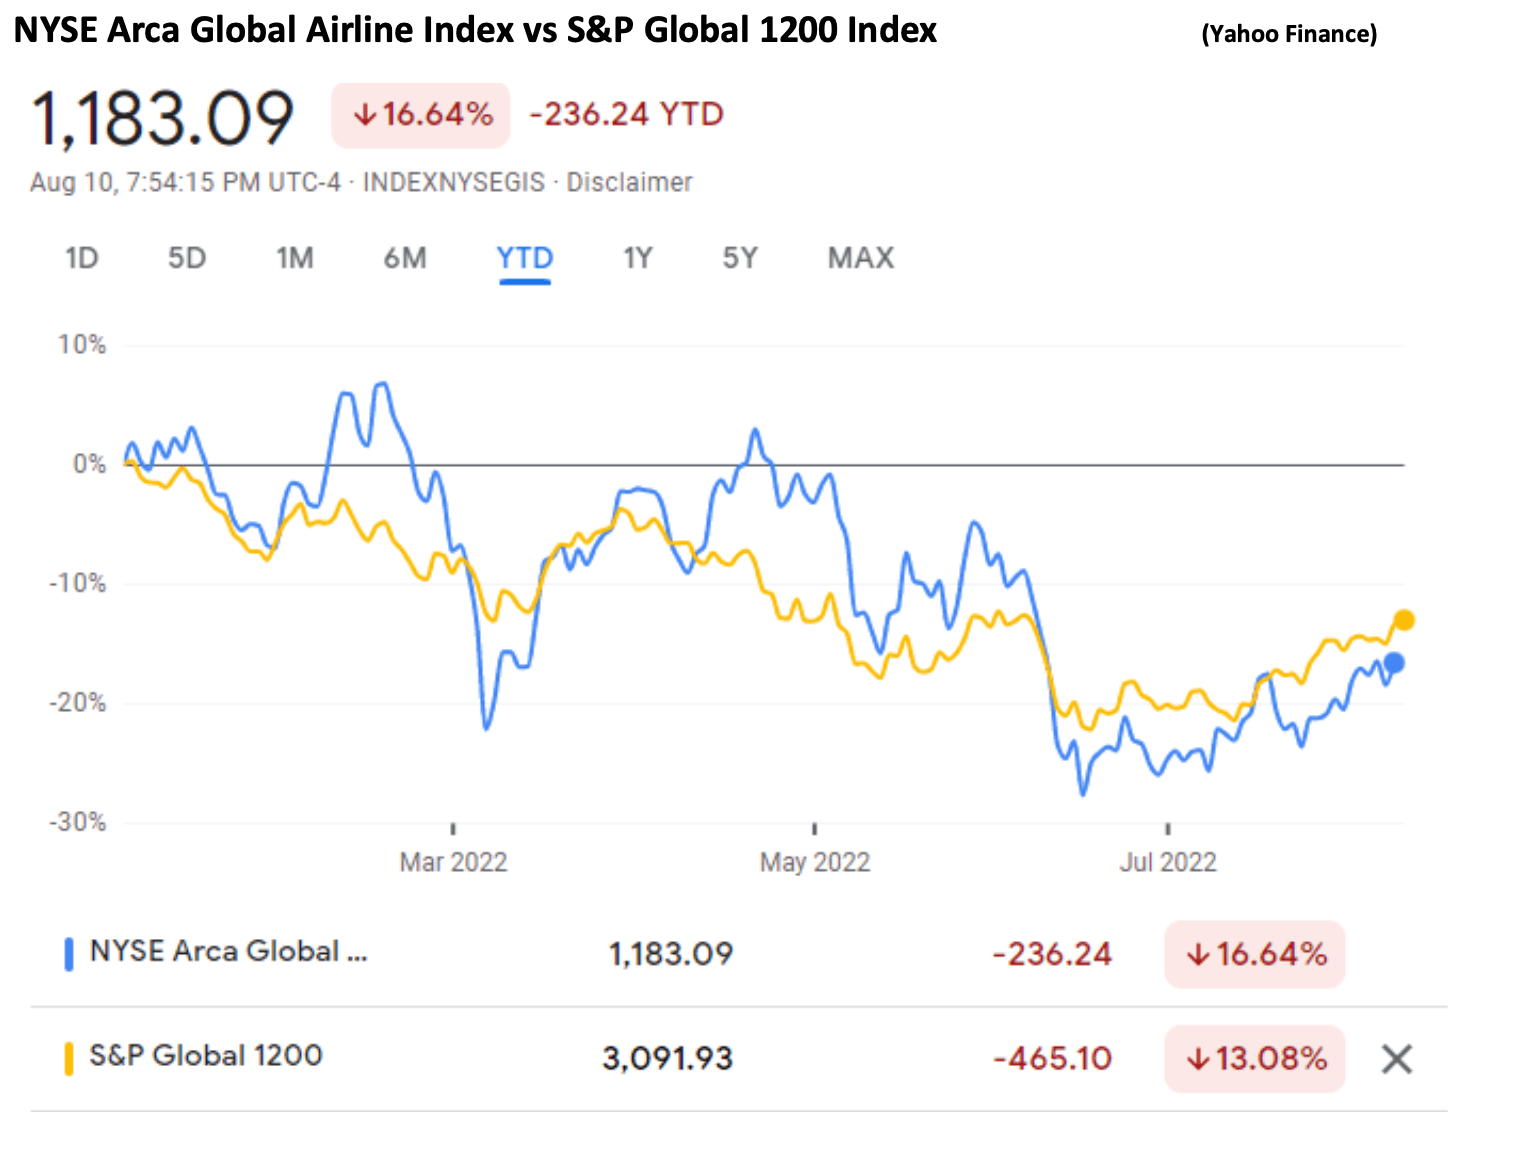
So far in 2022 airline shares have slightly underperformed the overall market. Since 2020 airlines have not recovered in line with the overall market because of the need to issue new stock to repair their balance sheets. New equity issuers have included Air Asia, Air France-KLM, Air New Zealand, American Airlines, easyJet, El Al, Flyr, Garuda, Lufthansa and TUI.
The major airline credit event in 2022 so far has been the effective confiscation of aircraft leased to Russian airlines by western lessors, which we discussed in detail in our Q1 2022 publication. There has been no fundamental change since then, although recent reports that some western aircraft are being cannibalised for spare parts is in line with our discussion of likely future developments.
In July 2022 SAS applied for Chapter 11 bankruptcy protection in the US courts. This is the only major airline bankruptcy so far this year. We have not been able to identify any significant airline failures outside Russia since the start of 2022. Also, in June Comair (South Africa) entered liquidation after a successful restructuring in 2020. These events illustrate the fragile financial condition of many airlines post-pandemic and their vulnerability to adverse events such as the pilot strike at SAS. Given the high level of fuel prices and the US Dollar there is a good chance of further failures this winter, particularly if there is a recession. According to the aviation consultancy Ishka the number of airlines in bankruptcy/restructuring in July was 11 with 623 aircraft affected[5].
Special Topic – New Aircraft Pricing
What does an aircraft purchase agreement look like?
The structure of new aircraft purchase agreements is well understood as many of these are in the public domain for example as exhibits to SEC filings by airlines and lessors, although the key economic terms are redacted.
Typical key economic terms of an aircraft purchase agreement include:
• A schedule of delivery dates – one should bear in mind that most aircraft purchase agreements are for more than one aircraft and can run to over one hundred;
• A base price per aircraft as of a specific date, normally the contract date. The calculation of this price is complex involving multiple credits against the quoted list price;
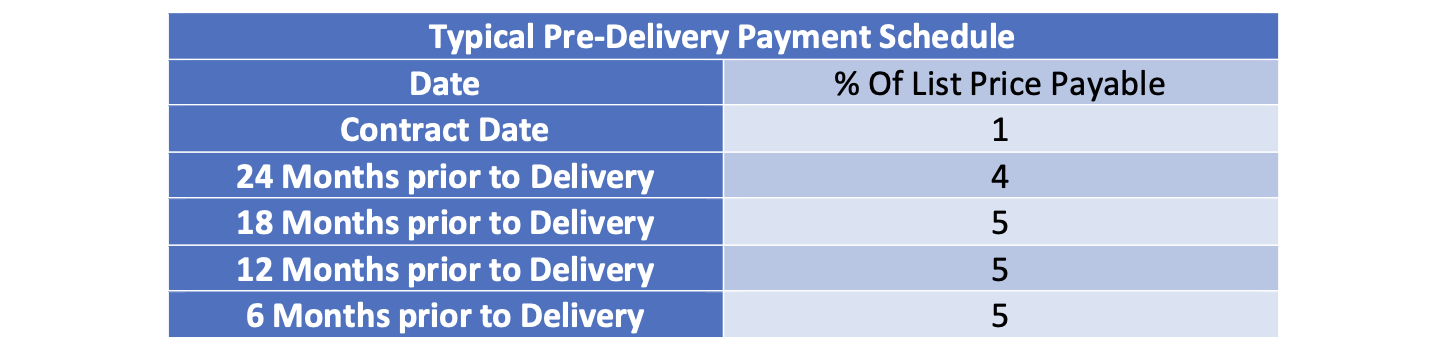
• A pre-delivery payment schedule, whereby the purchaser makes a series of payments both on the contract date and also at various periods prior to aircraft delivery. These pre-delivery payments are offset against the final purchase price;
• An escalation formula which adjusts the base price by reference to one or more inflation indices to compensate the manufacturer for increased costs between the contract date and delivery date. There is a more detailed discussion of escalation below.
Normally there will also be a separate agreement with the engine manufacturer. This might be a full purchase agreement where there are competing engine types for a twin-aisle aircraft, with a similar structure to an aircraft purchase agreement. For most single-aisle aircraft the aircraft manufacturer generally has a concession arrangement with the engine manufacturer and incorporates the engines within the aircraft purchase agreement. However, there will likely still be a less extensive side agreement between the buyer and the engine manufacturer.
Aircraft list prices
Airbus and Boeing’s aircraft list prices have been the object of increasing scepticism and/or bemusement amongst their customers over the years and the chart below tries to explain why. We have calculated inflation indices for Airbus and Boeing list prices based on the average change in list price by aircraft type. The chart presents these along with the US CPI and our proprietary estimate of actual aircraft inflation based on extensive industry research.
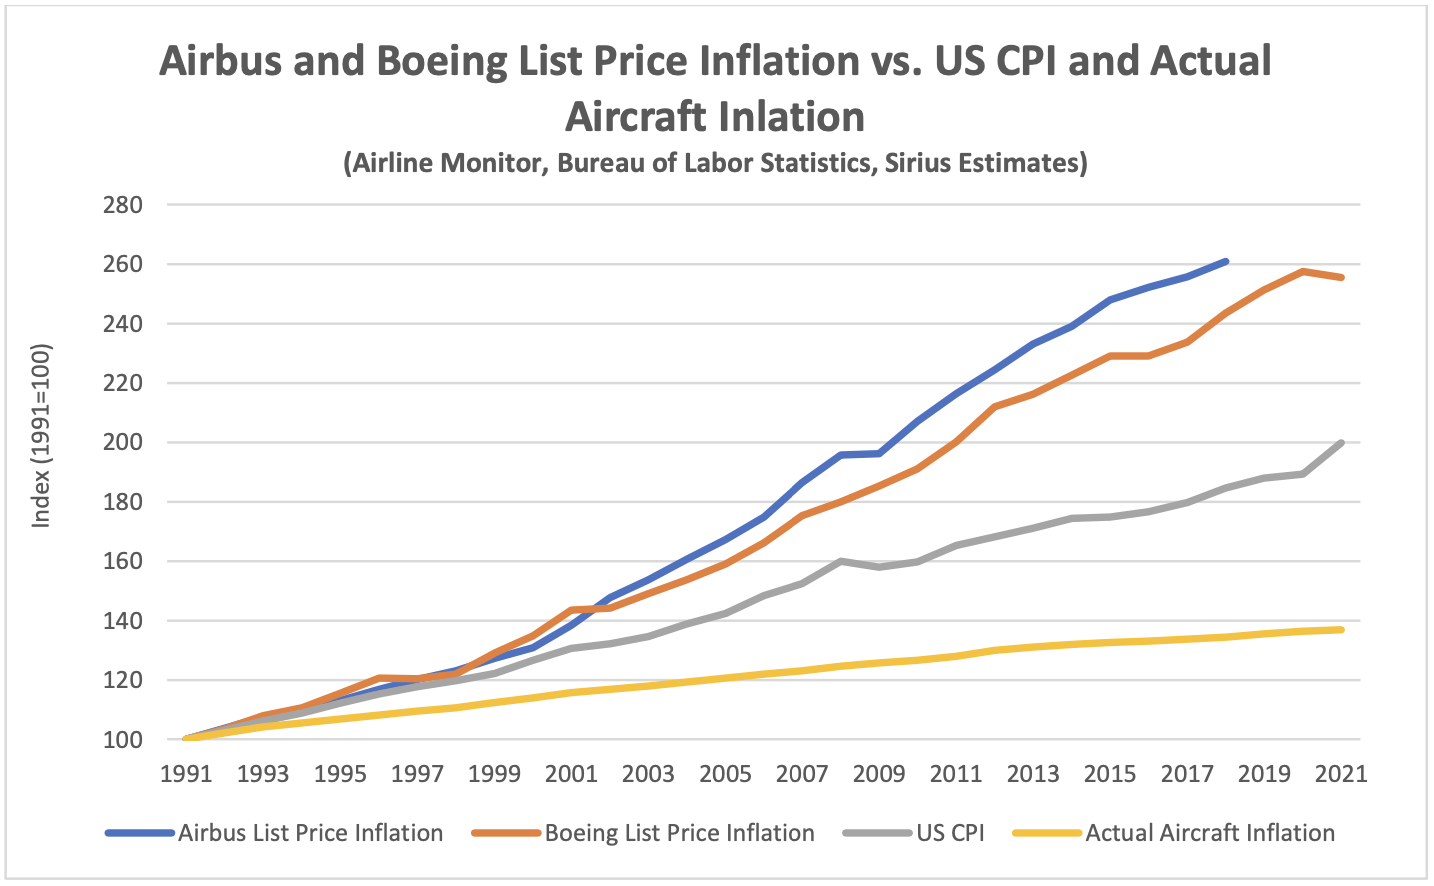
List price inflation is much higher than general inflation, which in turn has been higher than our estimate of the actual inflation in new aircraft prices. We believe the low level of actual inflation has been driven by Airbus and Boeing passing on efficiency improvements to customers in lower real prices so as to maintain market share. The cumulative effect of these differences is that typical discounts to list price are now between 50% and 60%.
The OEMs’ motivation for this behaviour is unclear but may include the following:
• Aircraft list prices have moved broadly in line with aircraft engine list prices, which are very close to actual spare engines prices (engines sold are part of an aircraft order are heavily discounted);
• Pre-delivery payments are calculated relative to list prices so high list prices help the OEMs’ cash flow; and
• Higher nominal discounts help sell aircraft.
There has been speculation that list prices can play a role in “market signalling” and where Airbus and Boeing have very similar products such as the A320-200 and B737-they have stayed quite close. However, this argument is undermined by the generally higher increases in Airbus list prices over time and the fact that Airbus stopped publishing them after 2018.
Escalation
Escalation calculations in an aircraft purchase agreement are based on a blend of one or more inflation indices. These are all US indices as nearly all commercial aircraft transactions are in US Dollars. Although there is no standard blend, a typical combination might be:
• 50% Aircraft manufacturing Wages and Salaries (Series ID: CIU2023211000000I); and
• 50% Industrial Commodities (Series ID WPU03THRU15).
Escalation is calculated on a cumulative basis over the period from contract to delivery date and is normally subject to a negotiated cap of around 3% p.a. However, if cumulative escalation is higher than around 5% p.a. the cap may fall away under an arrangement sometimes described as a “hyper- out”, designed to protect the OEM from an excessive exposure to rising costs.
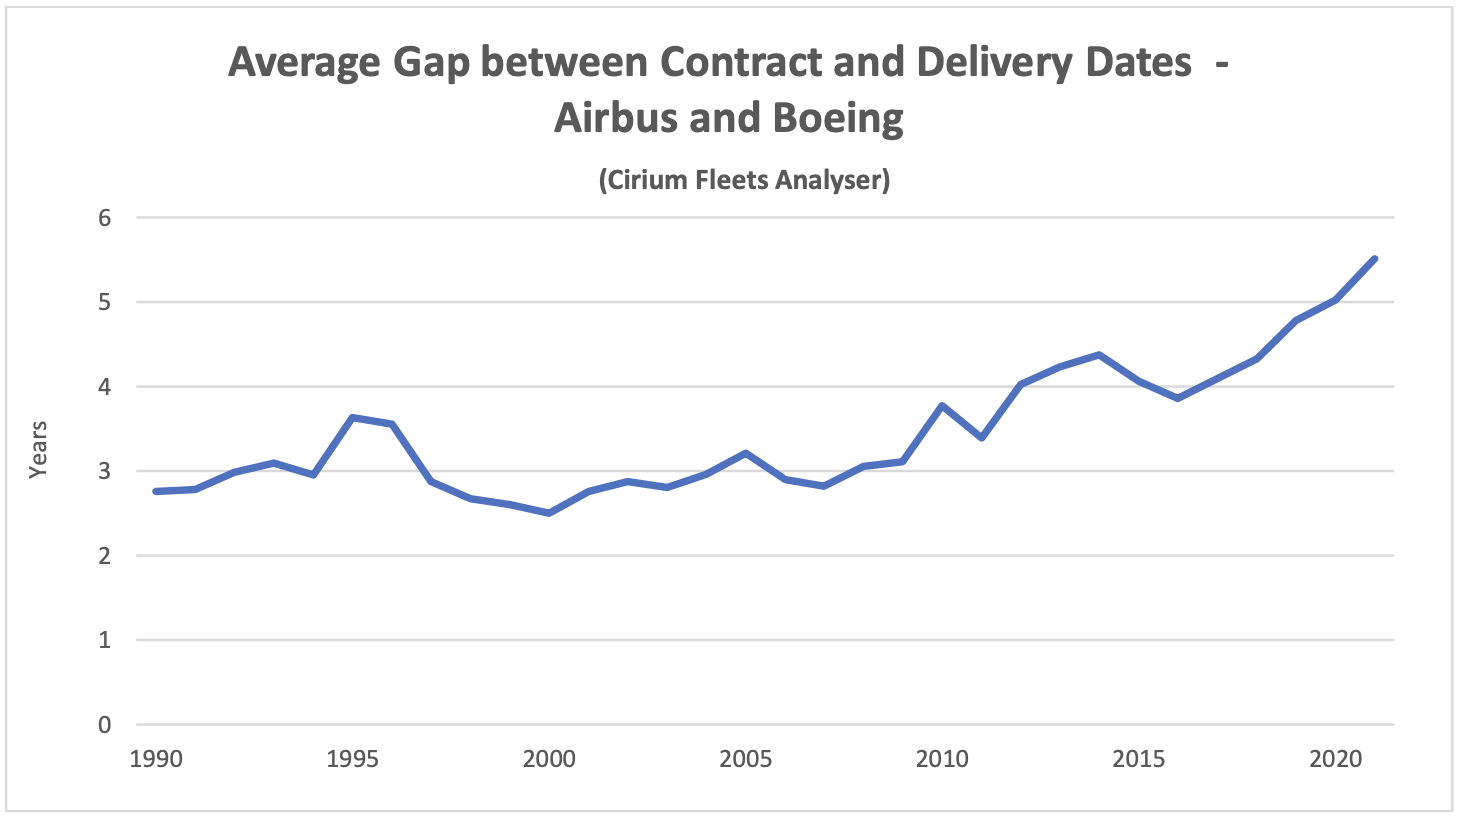
The impact of escalation on delivered aircraft prices has increased since 2010 because the gap between contract date and delivery date has increased from 3 years to nearly 6 years. This trend has been stronger since 2019 because of belayed deliveries of the B737 Max and the B787 but clearly predates these events. Where escalation is in line with actual aircraft inflation that impact is not very important, but on average escalation has been higher so the real cost of the last aircraft delivered under a purchase contract becomes significantly higher than the first.
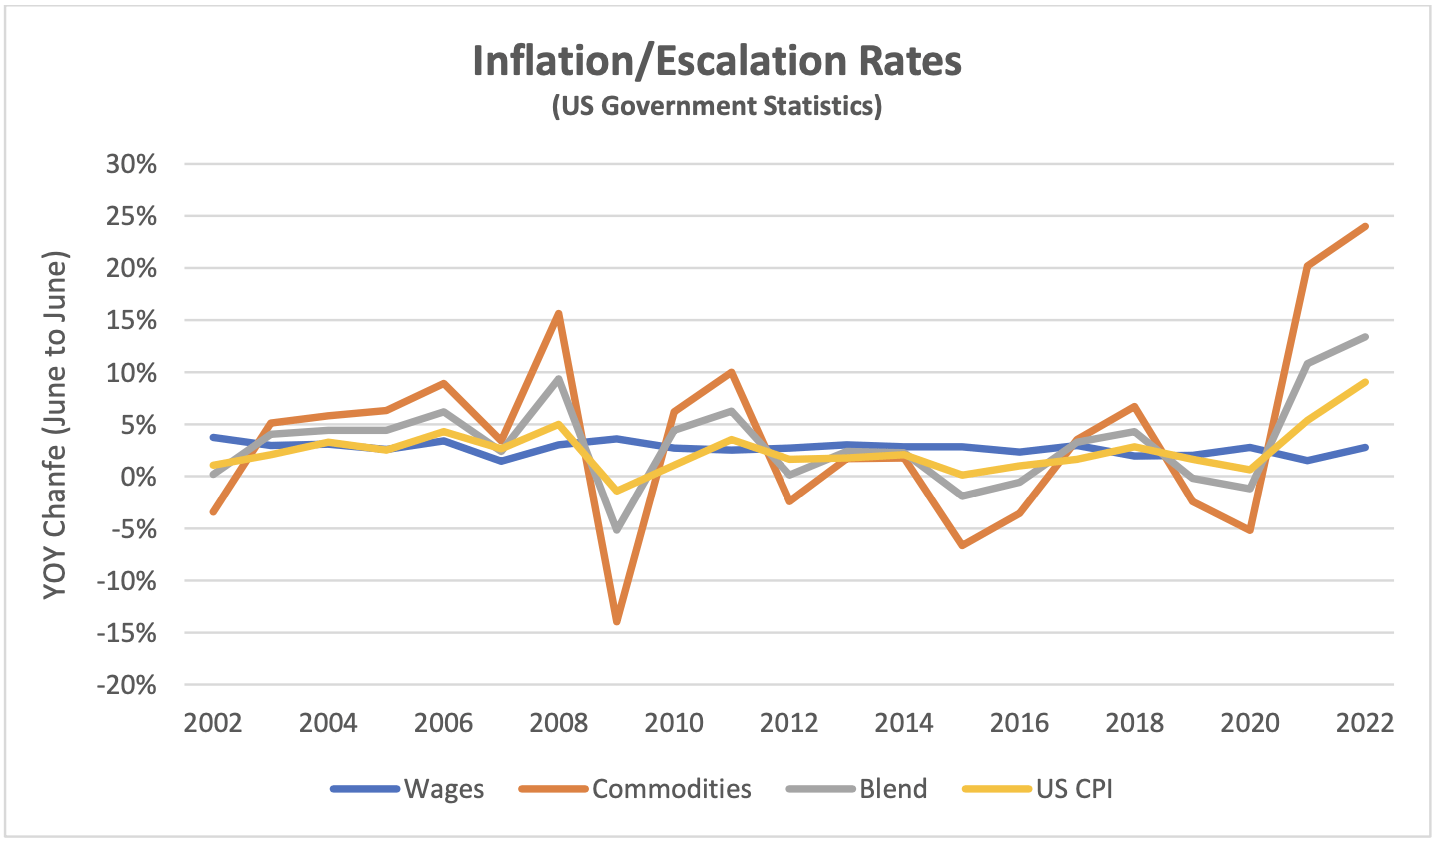
Commodity prices have been much more volatile than wages or general inflation, so the blended escalation rate has also been volatile. Recent spikes in commodity prices have led to speculation that some purchase contracts may have their “hyper-outs” triggered. The chart above shows the annual change in the wage and commodity price indices listed above together with a 50/50 blend and the US CPI for comparison purposes.
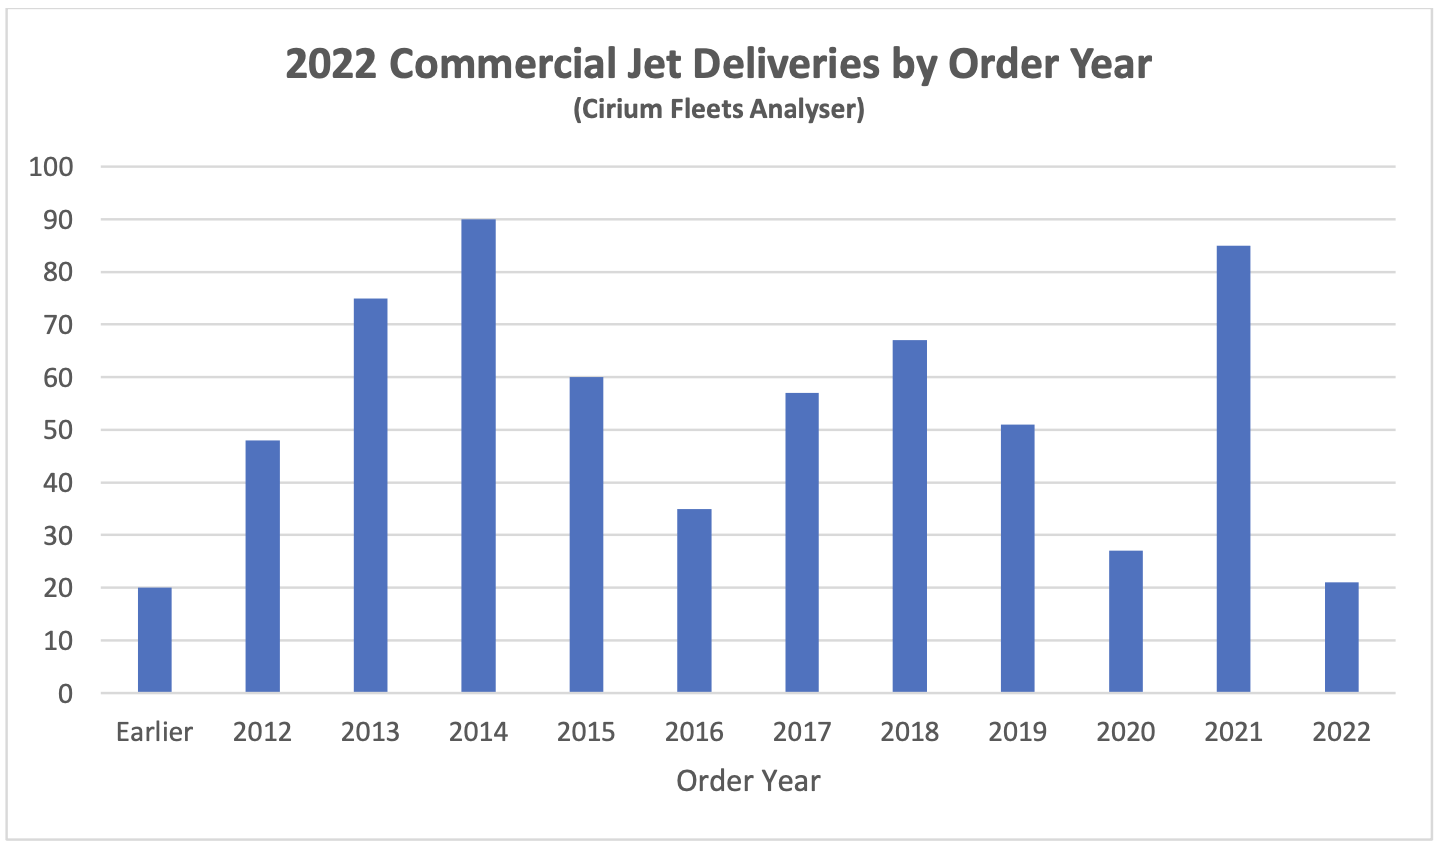
The extent to which aircraft buyers are exposed to “hyper-outs” is a function of when they placed their orders because escalation is calculated on a cumulative basis. The chart below shows the escalation CAGR[6] through 2022 for the previous 8 years (if the average gap between order and delivery is six years there will be some aircraft delivering that were ordered 8 years or even longer ago).
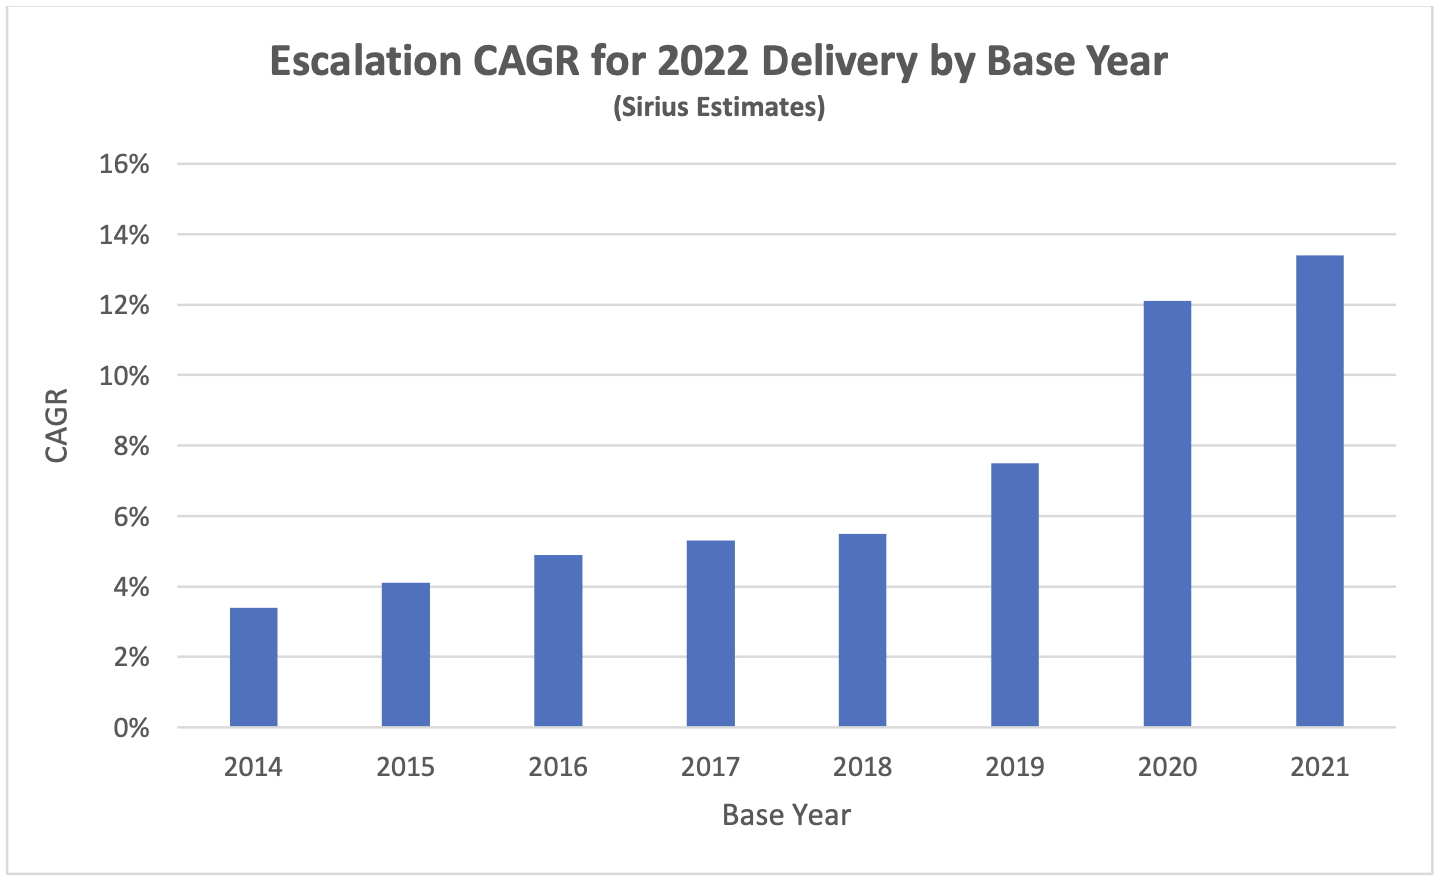
Although our escalation formula is only illustrative, we believe it is broadly representative of market practice, and this analysis suggests the following:
• Most buyers will be paying escalation up to their cap;
• There should be relatively little impact on buyers who ordered before 2019; and
• Buyers that ordered after 2018 will be impacted, particularly if they ordered in 2020 or
2021.
There may not be an enormous aggregate impact on average aircraft delivery prices from these developments, mainly because right now there are not many aircraft delivering that were ordered in 2020 and 2021. Also, those aircraft that were ordered in these years (and 2022) probably became available as a result of airline defaults and sanctions on Russia, which means that the new buyers would have had had the opportunity to renegotiate various contractual terms including escalation.
If increases in commodity prices persist then there will be a major impact on aircraft delivery prices in the next few years, particularly if wage growth picks up as well. This could happen even if general inflation becomes more subdued because industrial commodities are a fairly small part of an increasingly service-orientated economy. However, commodity prices have a history of high volatility including a number of precipitous falls so such a development is far from certain.
Disclaimer
This document is for informational purposes only. It is not intended as advice or a recommendation with respect to any transaction. The recipient of this document shall be solely responsible for making its own independent investigation and appraisal of any transaction. No market or company data or other information is warranted or guaranteed by Sirius Aviation Capital as to its completeness, accuracy, or fitness for a particular purpose, express or implied, and such data and information are subject to change without notice. Any comments or statements made herein reflect the assumptions, views, and analytical methods of the persons that prepared this document as of its date of preparation, and do not necessarily reflect the views of Sirius Aviation Capital. Sirius Aviation Capital may have issued, and may in the future issue, other communications that are inconsistent with, and reach different conclusions from, the information presented herein. Sirius Aviation Capital specifically disclaims any obligation to update this document, or any comments or statements contained herein.
[1] The crack spread refers to the overall pricing difference between a barrel of crude oil and the petroleum products refined from it. It is an industry-specific type of gross processing margin.
[2] Sources: IATA, Platts
[3] ASKs is the acronym for available seat kilometres, which is the product of the number of seats flown and distance flown.
[4] Airbus normally quotes its production rates based on an 11.5-month year for single-aisle aircraft and an 11- month year for twin-aisle aircraft.
[5] Fleet totals are based on Cirium Fleets Analyser data as of July 2022
[6] Compound Annual Growth Rate