Industry Update Q1 2025
- Special Topic – Airline Industry Default History Through 2024
- Macro-Economic Background
- Traffic and Aircraft Demand
- New Aircraft Supply
- Airline Industry Financial Performance
Airline Industry Default History Through 2024
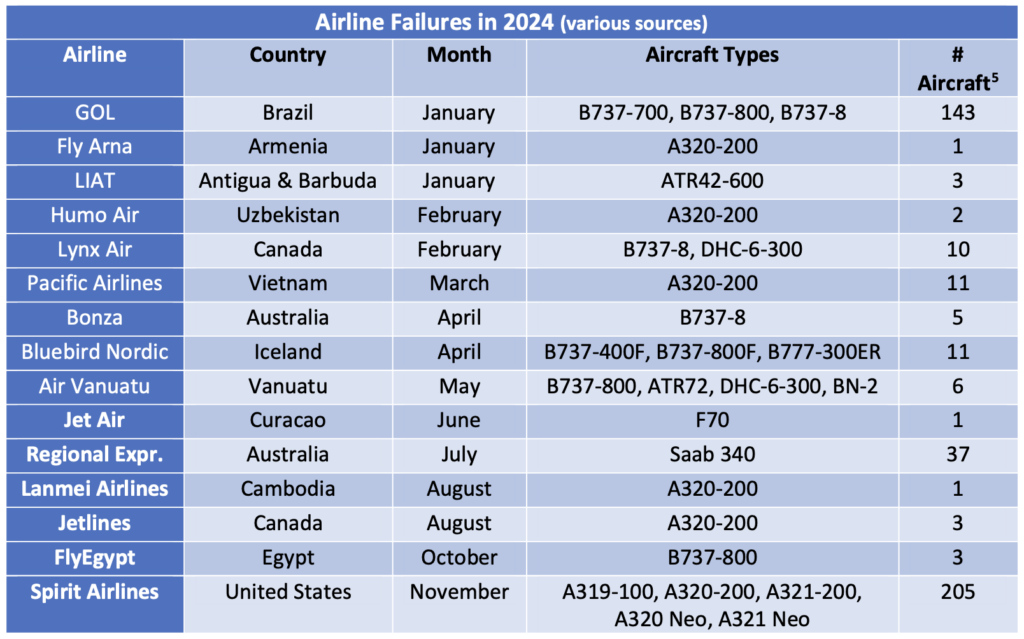
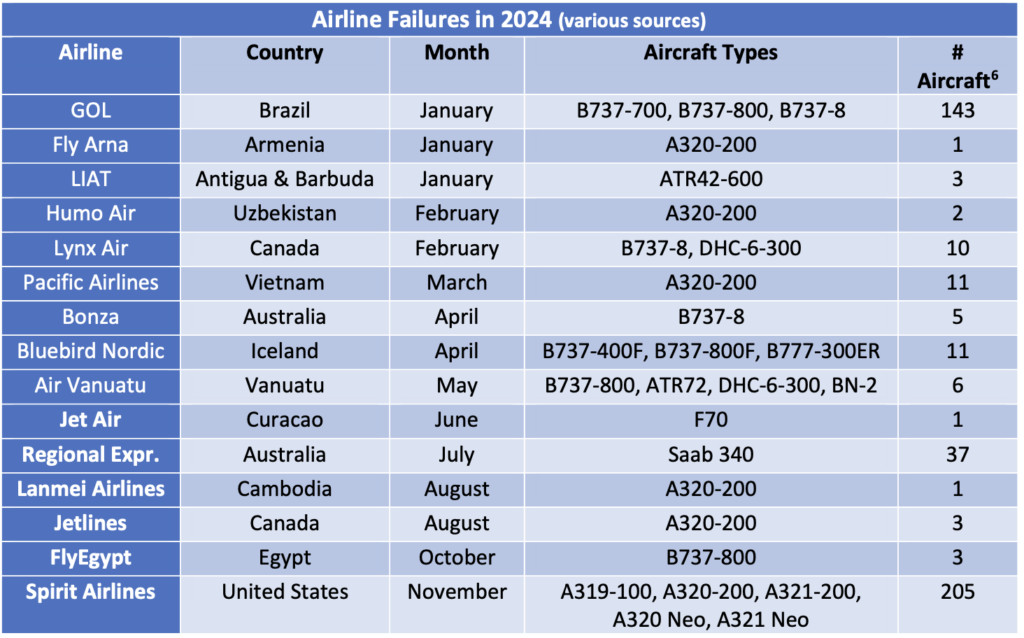
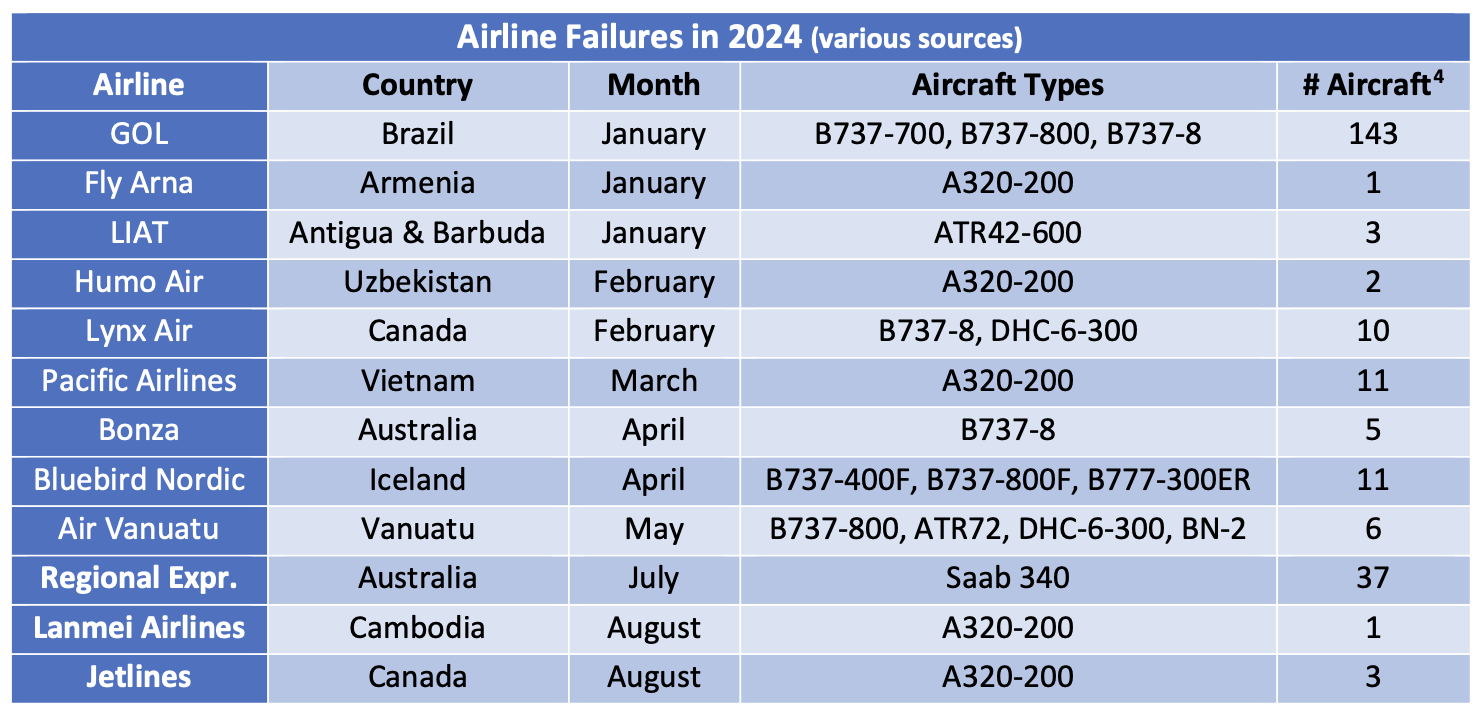
Before putting 2024’s default experience in its historical context the table below shows the final list of airline failures we have been able to identify for the year. We have excluded CSA, OTT Airlines and Vistara as these airlines ceased operations due to merger and Air Malta – the latter ceased operations but was immediately succeeded by KM Malta Airlines, also owned by the government of Malta and operating at least some of the aircraft previously operated by Air Malta. We classify this as an orderly wind-down rather than a default.
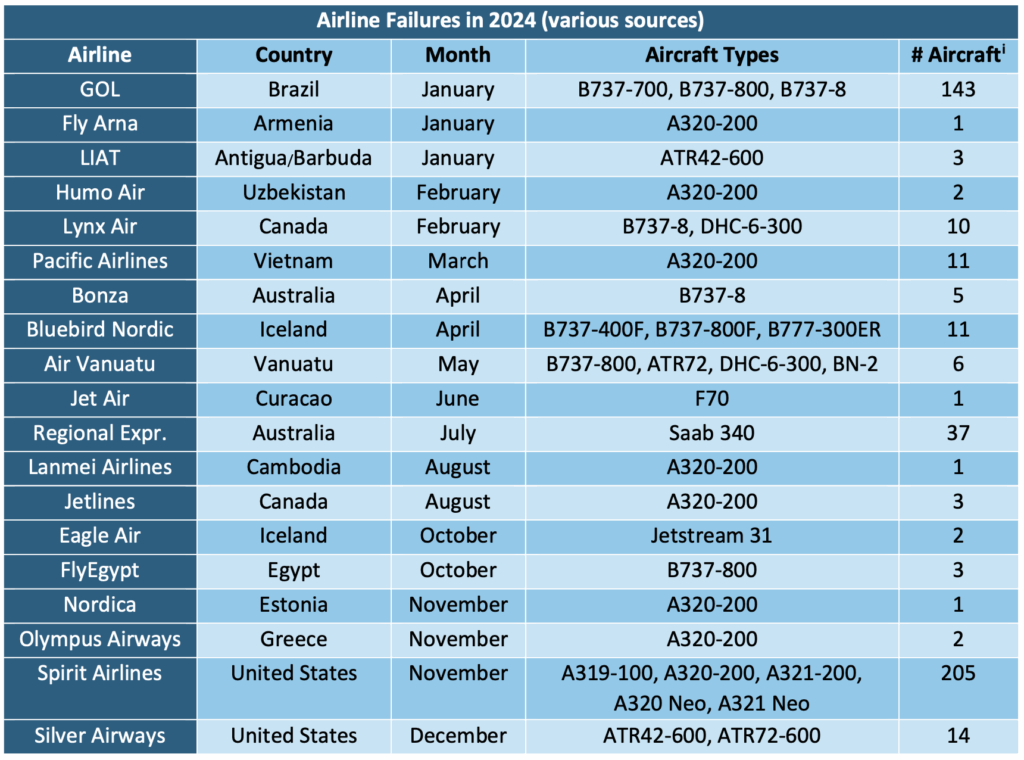
The map below shows these defaults were dispersed geographically but defaults by numbers of affected aircraft were highly concentrated in the Americas, accounting for 379 out of 461aircraft (82%). The big driver of defaults in North America was the difficult business environment for low-cost airlines and in Latin America it was the hangover from the airline defaults that occurred in the pandemic. The airlines that restructured through bankruptcy at this time obtained a sufficient competitive advantage that those which did not ultimately have had to follow.

Sirius produces proprietary estimates of global airline defaults because we think there are important issues around credit risk that arise at the industry level as well as at the level of the individual airline, and we cannot find any alternative source with the coverage we would like. The appendix to this report gives a detailed description of our methodology – probably the most important point to bear in mind is that we exclude small airlines for the sake of practicality so that only 8 of the 19 airlines listed in the table above are included.
The rating agencies produce historical statistics by industry, but their universe of rated airlines is quite small (typically 25-30 airlines at any given time) as they only cover airlines that make use of debt capital markets funding.

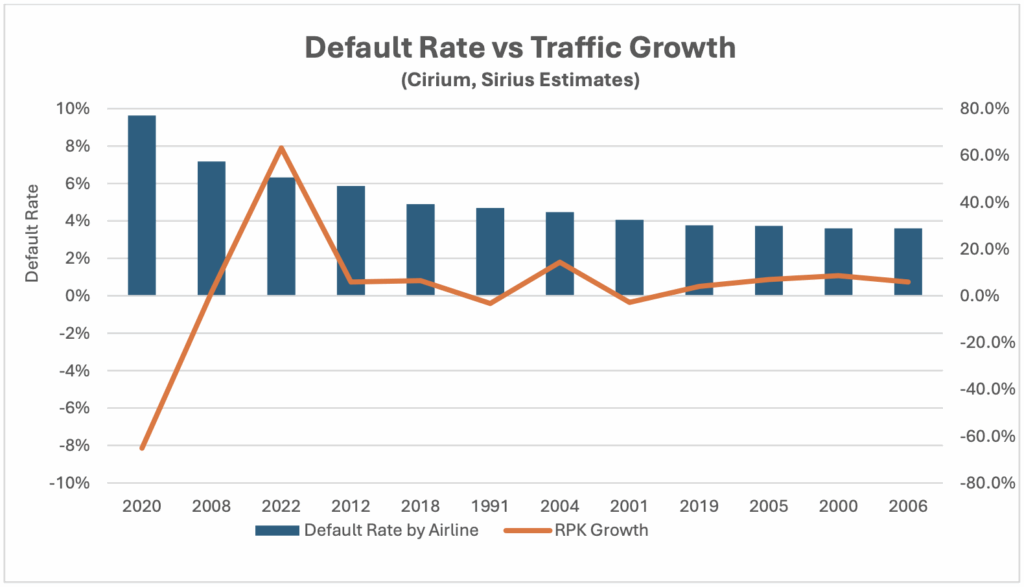
Like 2023, 2024 saw a more normal level of defaults following the shocks of the pandemic in 2020[1] and Russia’s expropriation of lessor-owned aircraft in 2022. 2024’s default rate by airline was 3.7% compared to an average of 3.4% p.a. from 1990 and the default rate by aircraft was 2.0% compared to an average 2.9%. This means that the average defaulter had a smaller than normal fleet which is good news for financiers who had to remarket aircraft. The historic correlation between these two default rates is quite low at 0.36, reflecting the divergence caused spikes in defaults by aircraft when very large airlines such as the US majors enter bankruptcy. The analysis presented below focuses on defaults by airline to make for a more digestible read and the pattern of outcomes is broadly like that for defaults by aircraft.
One notable feature of our estimated default rate is that it is not highly correlated with traffic growth. The chart below compares the default rate by airlines with traffic growth for every year where defaults were above average with the highest default rates on the left. Traffic declined in only 3 of the twelve years concerned.
Another significant and related result is that default rates by region are not strongly correlated as can be seen in the table below. This should not really be surprising as analysis of traffic growth and airline profits by region shows a similar pattern.
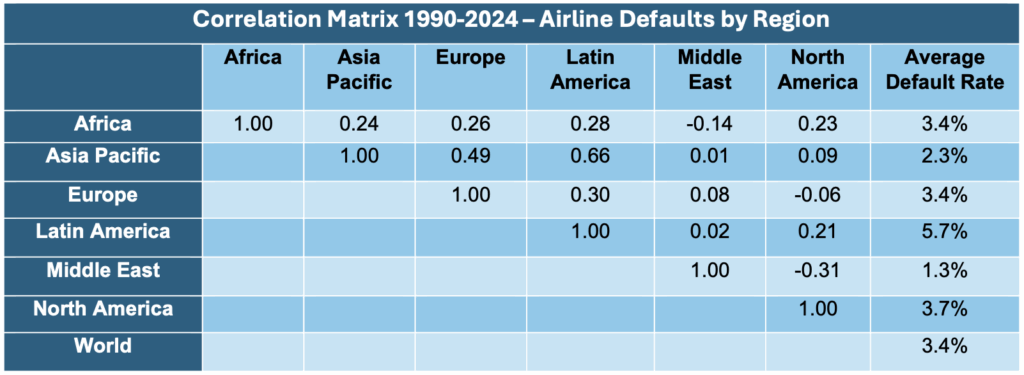
We believe this lack of correlation is a key explanation of how most aircraft lessors are financially robust across the cycle despite serving a single relatively risky industry. 2024’s experience in terms of defaults by aircraft is an example how defaults are often skewed by region.
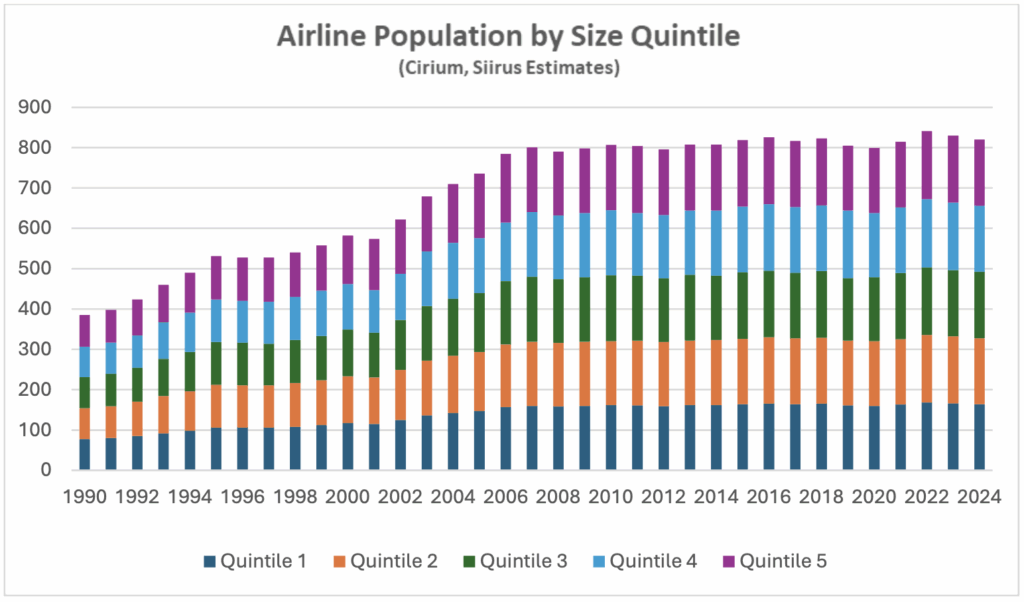
We also try to see what impact airline size has had on default rates. To do this we divide airlines into quintiles based on size as measured by number of seats, with each quintile representing roughly the same number of airlines. The chart below shows the population of airlines by quintile which has been quite stable since the late 2000s. During this period, bigger airlines have grown faster than smaller airlines resulting in a more concentrated industry.
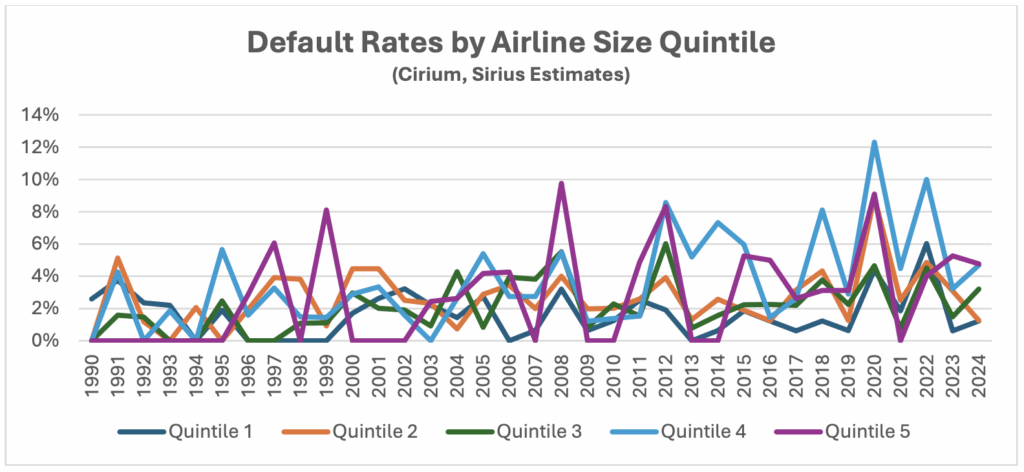
The default rates by quintile as presented in the chart below are visually confusing but the numbers in the following table help to put some structure around the results.
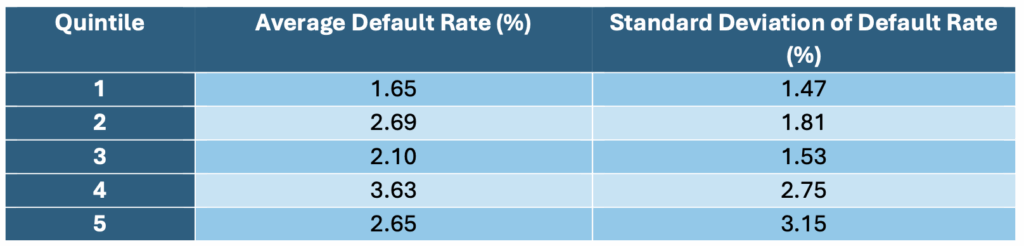
The table shows that the biggest airlines have the lowest and least volatile default level – volatility matters because it is harder to manage a default rate that is “spiky”. Once we go to the other quintiles there is no observable relationship between size and default rate, but there is a definite upward trend in volatility as airlines become smaller. Overall, our analysis suggest size has a limited influence on creditworthiness, and it would be wrong to assume that the lower default rate for larger airlines makes them “investment-grade” by a flawed analogy with credit ratings. The airlines in Quintile 1 have a default rate of 1.7% vs 3.4% for all airlines – for purposes of comparison the average default rate for S&P investment-grade bond issuers was 0.1% p.a. vs 3.9% p.a. for speculative-grade for the same period.
It’s also worth considering whether a broader data set might have implications for how the rating agencies look at the credit status of the airline industry. Although the universe of airlines with public ratings is small, the rating agencies conduct a lot of private ratings as part of rating aircraft ABS transactions. Although these private ratings remain confidential, general feedback is typically that average credit ratings for the airlines in these portfolios is “high B/low BB” i.e. middling speculative grade.

A comparison of our estimated airline default rate with the default rate for all bond issuers rated speculative grade by S&P shows airlines with both a lower default rate (3.4% p.a. vs 3.9% p.a.) and lower volatility (1.7% standard deviation vs 2.7%). It looks unlikely that the rating agencies are being overly optimistic about airline credit quality, but the most striking difference arises in volatility where it seems the benefit of geographical diversification more than offsets the benefit of industry diversification (we assume that the S&P issuer universe is concentrated in the US).
Qualifications and Conclusions
One should bear in mind that the nature of a lessor’s credit exposure to an airline is different to that of a bondholder because the lessor typically has the benefit of asset ownership and a lease security package that may include cash security deposits, letters of credit and other features. This has allowed lessors to grant significant forbearance to airlines at various other times as well during the pandemic.
Despite these limitations on making fair comparisons between our airline default estimates and historic bond defaults we believe these results are striking none the less, particularly on the positive benefits of geographic diversification, the limitations of size effects and the lower volatility of airline defaults compared to speculative grade bond issuers.
Regular Topics
Macro-Economic Background
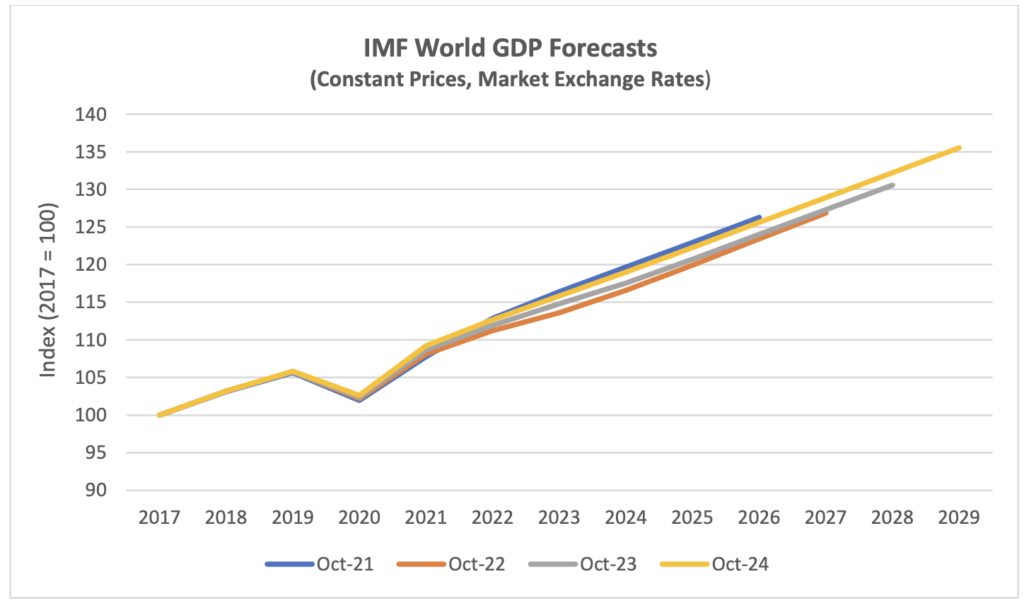
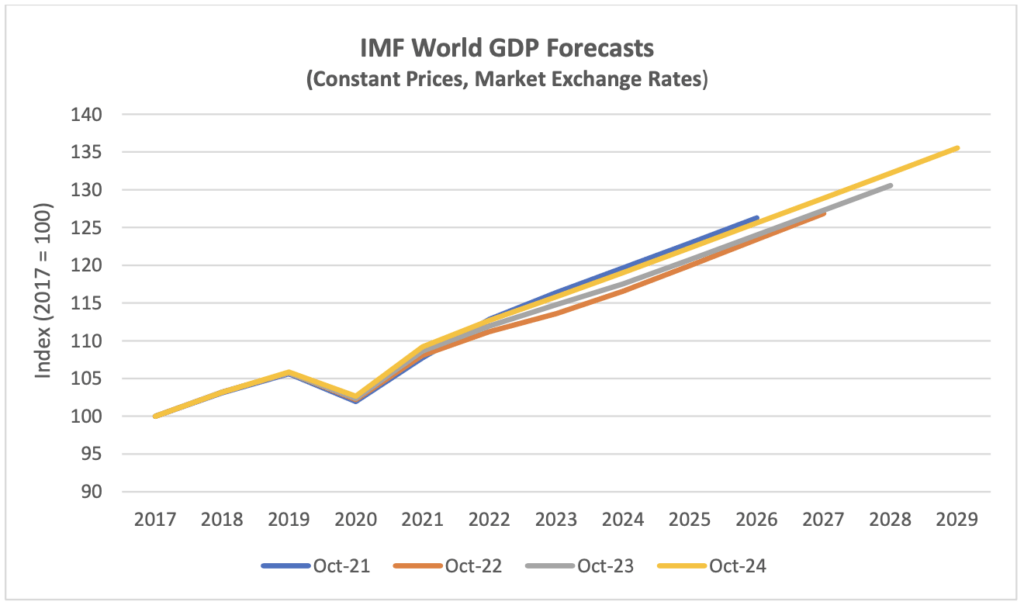
Despite the “trade wars” initiated by the US this year the IMF has not materially changed its World GDP forecast in its latest World Economic Outlook published in April, and its first forecast for 2030 shows a similar level of growth to prior years.

Economic growth is a key driver of long-term growth of air travel. However, since early 2020 its impact has been overshadowed by the fall and recovery in traffic associated with the pandemic. In time the influence of overall economic conditions on air travel is likely to reassert itself, but industry forecasts published by Airbus, Boeing and IATA assume much higher rates of traffic growth than GDP growth over the rest of the 2020s as the former catches up to its long-term trend (see our Q1 2024 Industry Update for a more detailed discussion).

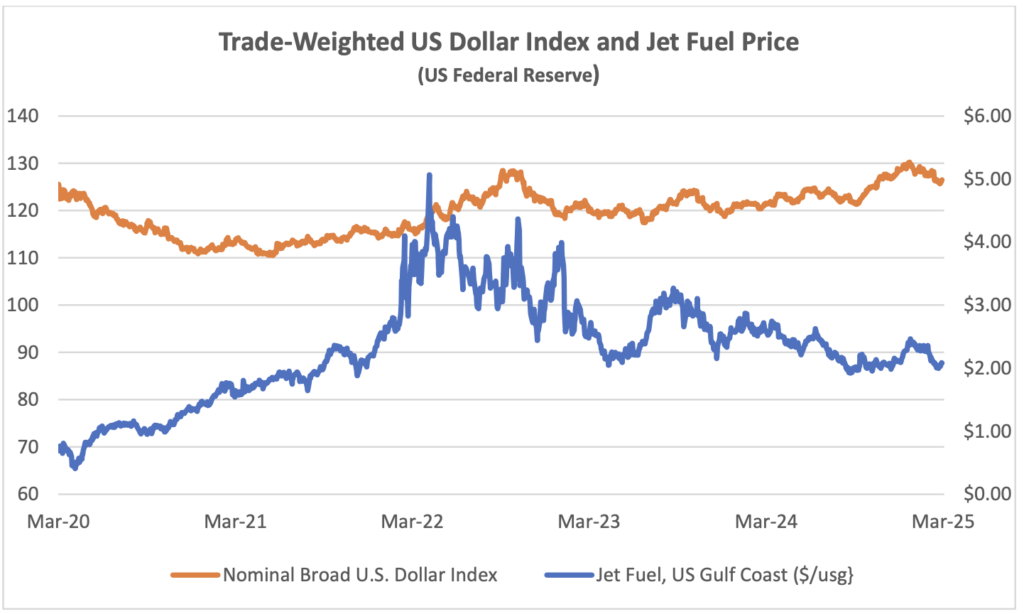
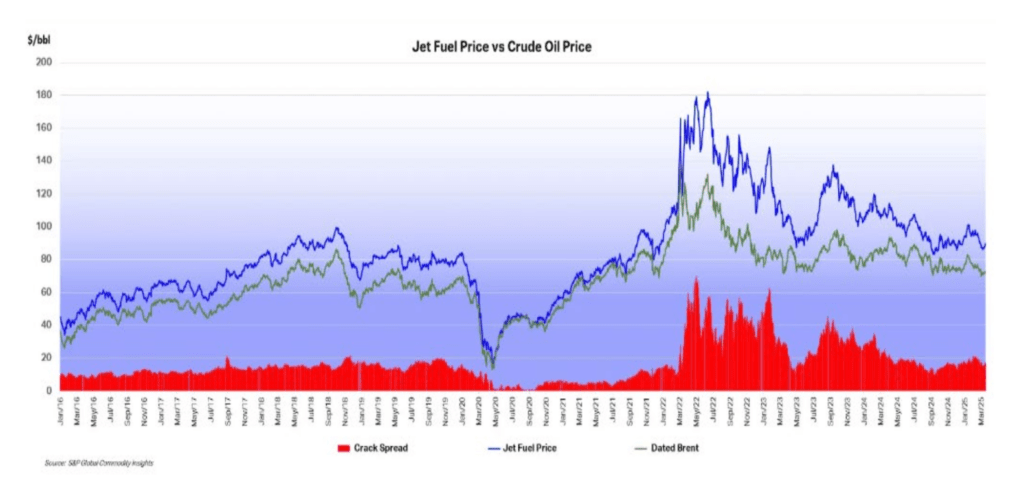
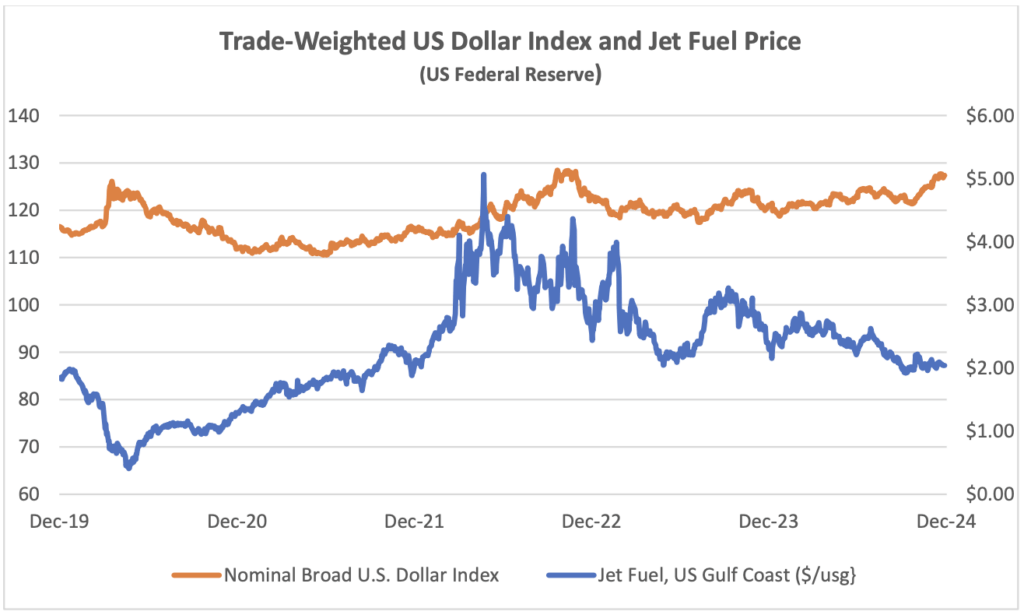
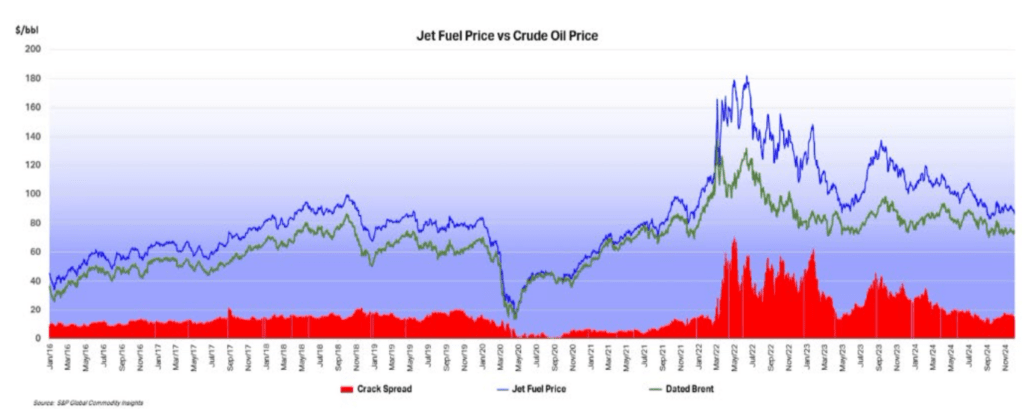
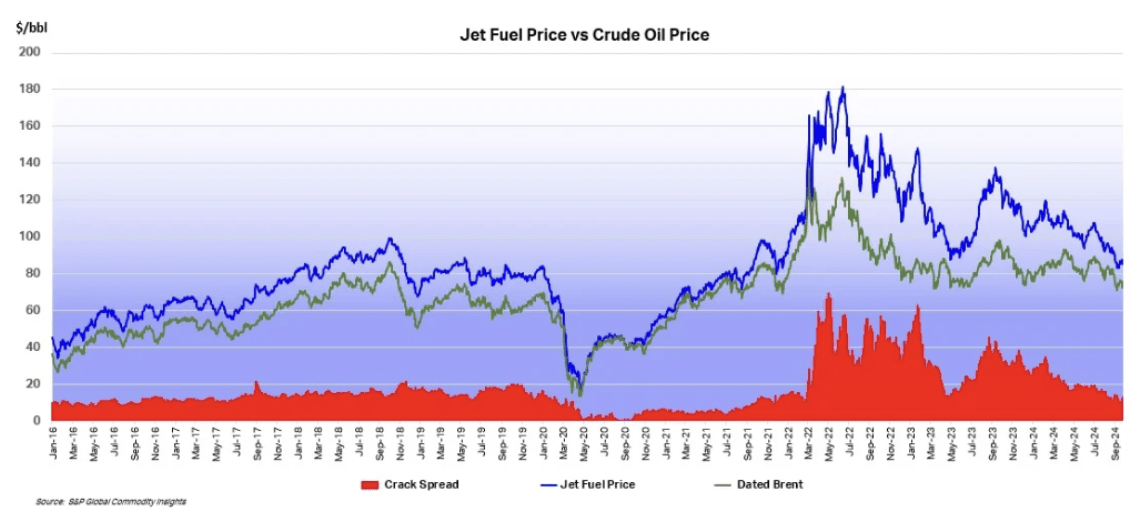
Two key macro variables have been moving in favour of the airline industry in recent months. The cost of jet fuel has fallen below $2.00 per gallon, mainly due to a fall in the price of crude oil as the crack spread remains quite high at c. $17 per barrel. IATA estimates that fuel accounted for 29% of total industry costs in 2024, and the current prices is 15% below the average for 2024 so this will be a very welcome change if sustained. There will probably be a lag for many airlines in seeing the impact of cheaper fuel in their financial results as they will have hedged their costs forward for periods of up to around a year. The US Dollar has also weakened which also helps airlines outside the US for dollar-denominated costs such as fuel, aircraft rents and aircraft spares.
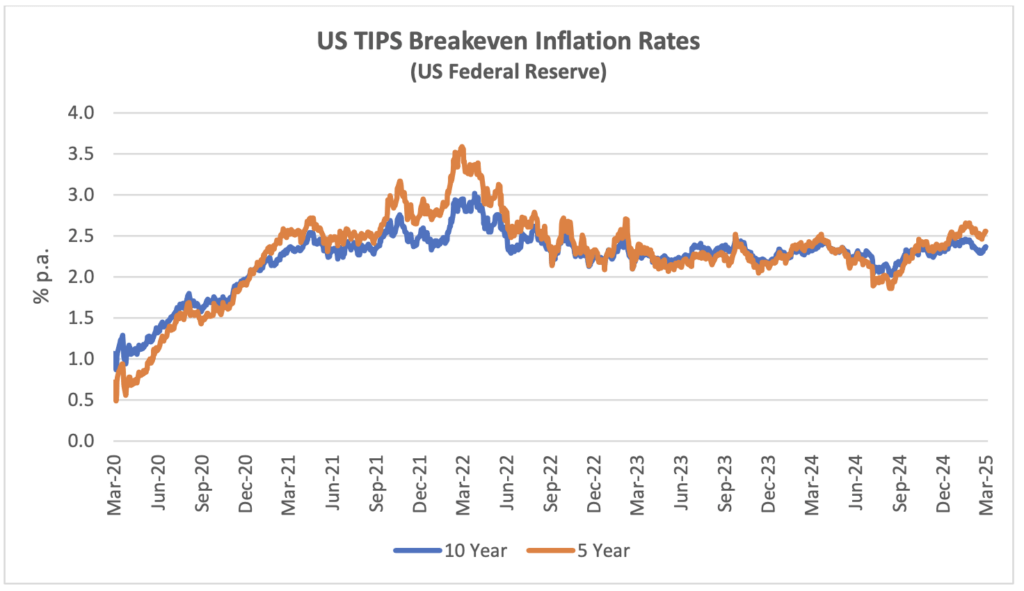
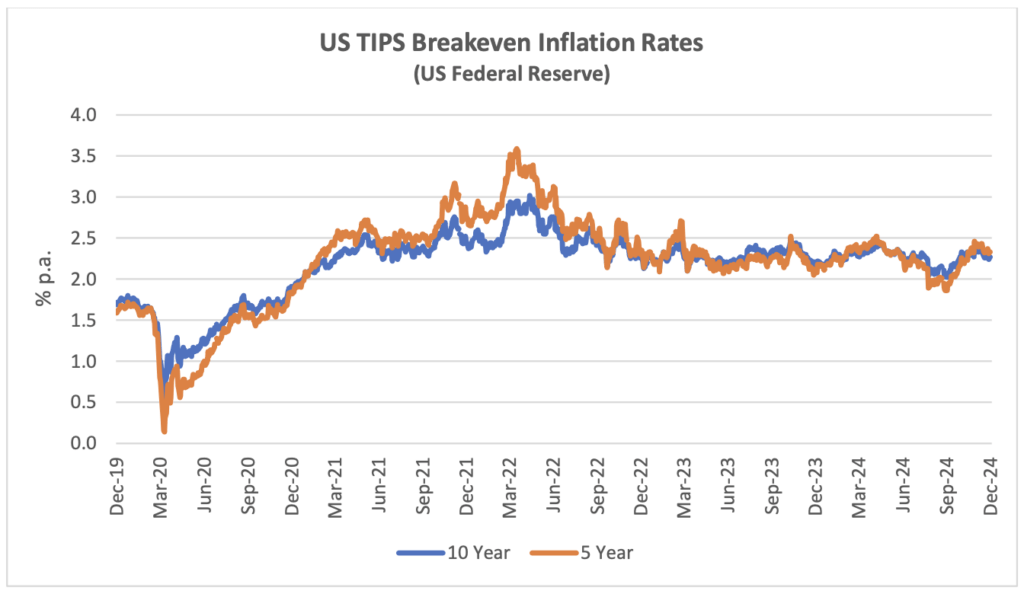
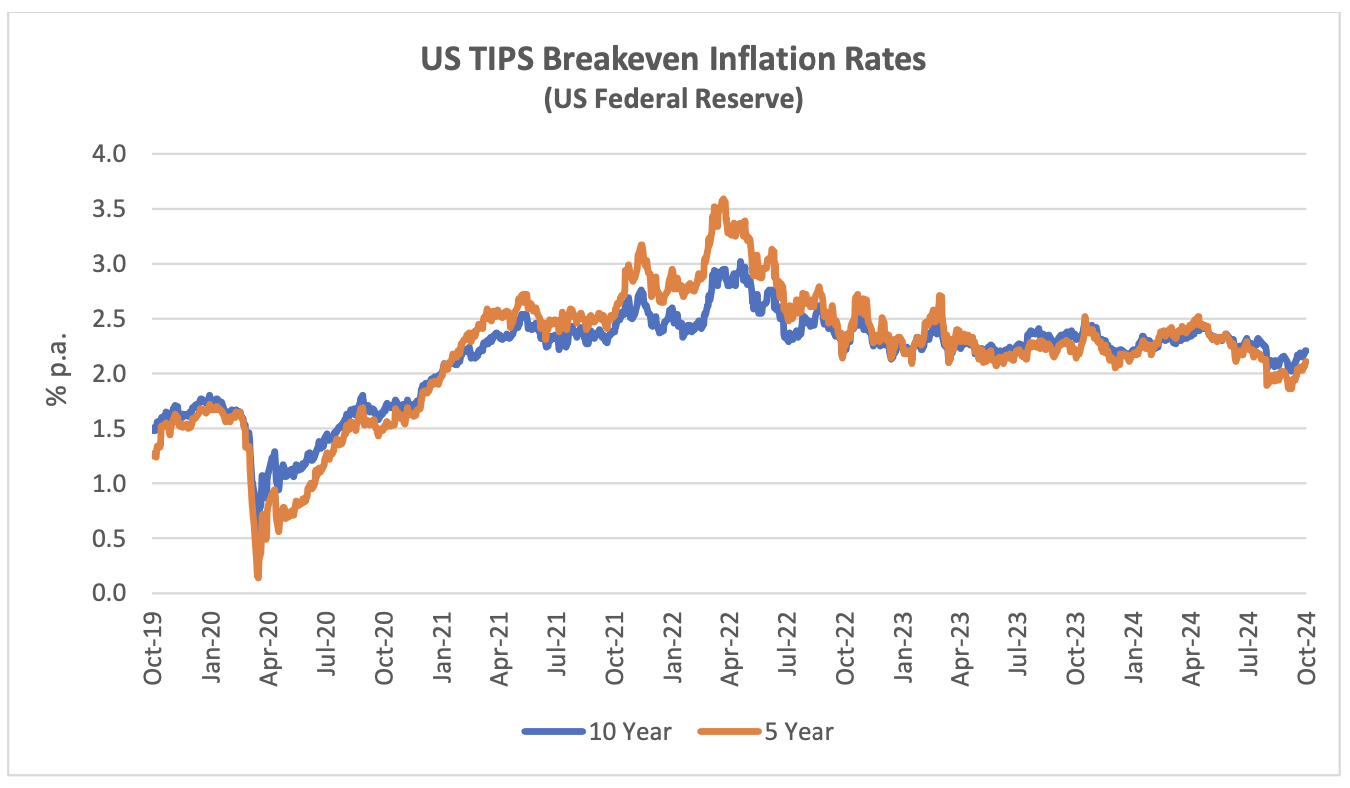
Another indicator that is potentially important to aircraft investors is the breakeven inflation rate on US Treasury Inflation-Protected Securities (TIPS). This indicator measures inflation expectations and it matters because used aircraft values are strongly influenced by the cost of new aircraft and over time this cost is linked to US Dollar inflation. In the short term this linkage is driven by escalation clauses in aircraft purchase contracts and in the long term by the general input cost environment for the aircraft manufacturers. The chart below compares the breakeven rate for 10-year and 5-year TIPS.
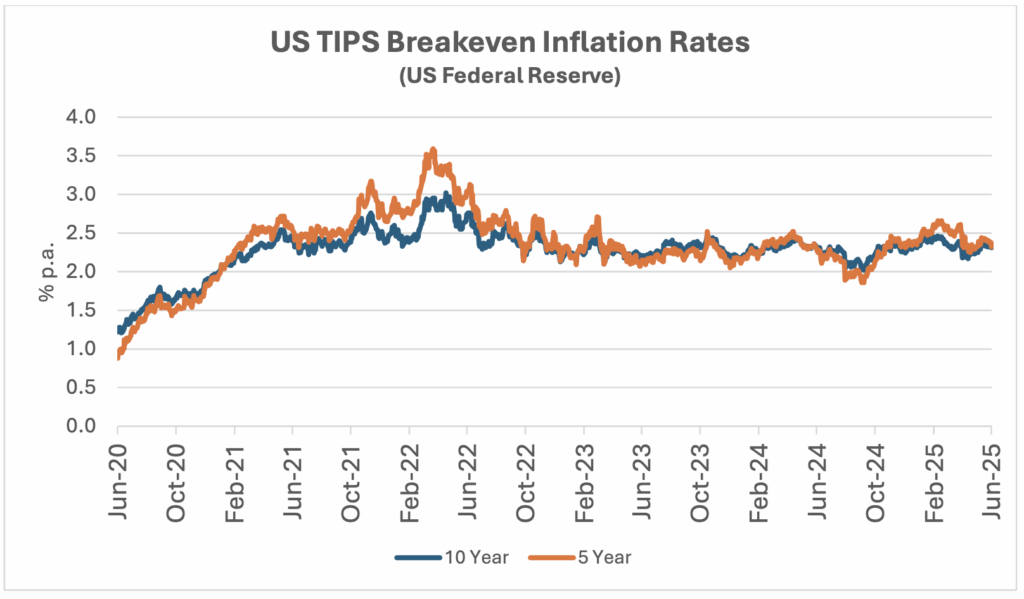
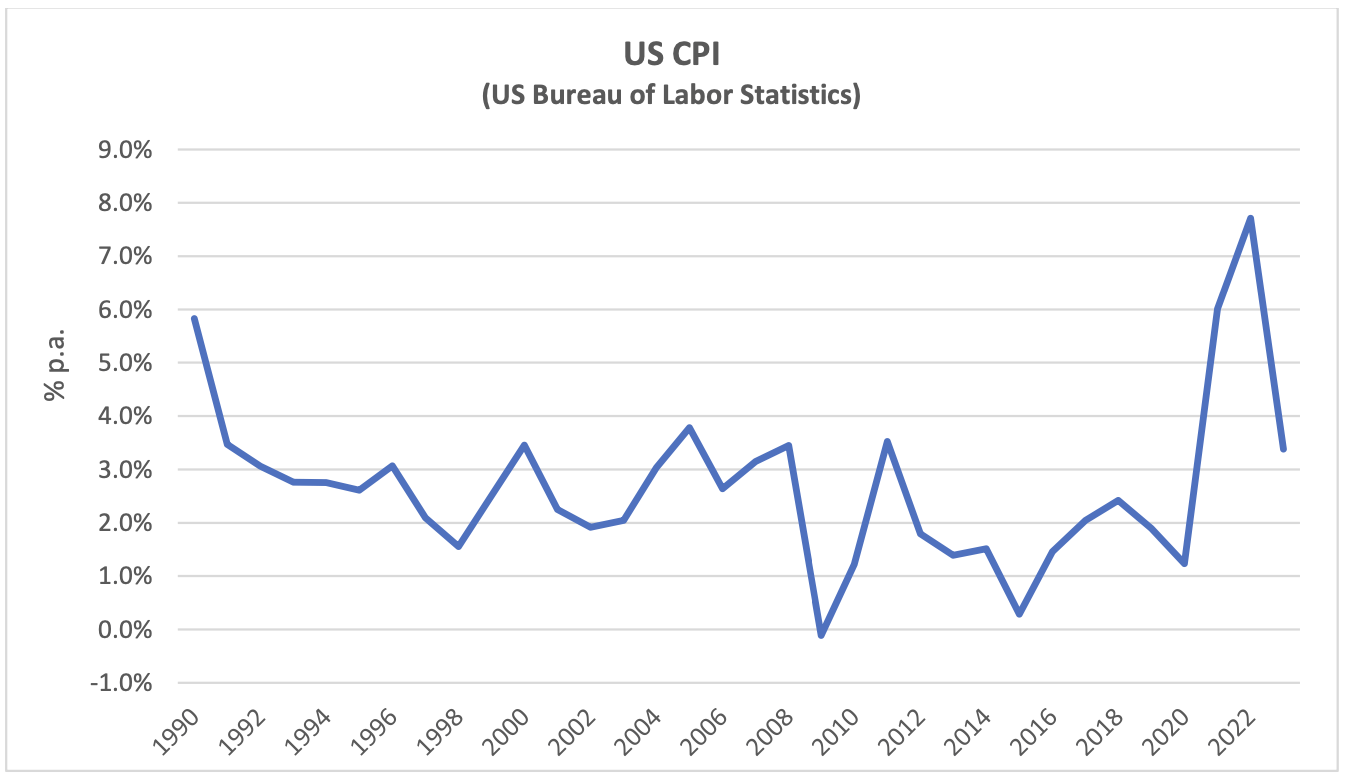
Although medium or long-term inflation expectations have never gone higher than 3.5%, actual inflation experience has been much higher in the last few years. This has led to higher appraised values for new aircraft. If tariffs are applied to aircraft and/or aircraft components tis is likely to increase the cost of new aircraft.
Traffic and Aircraft Demand
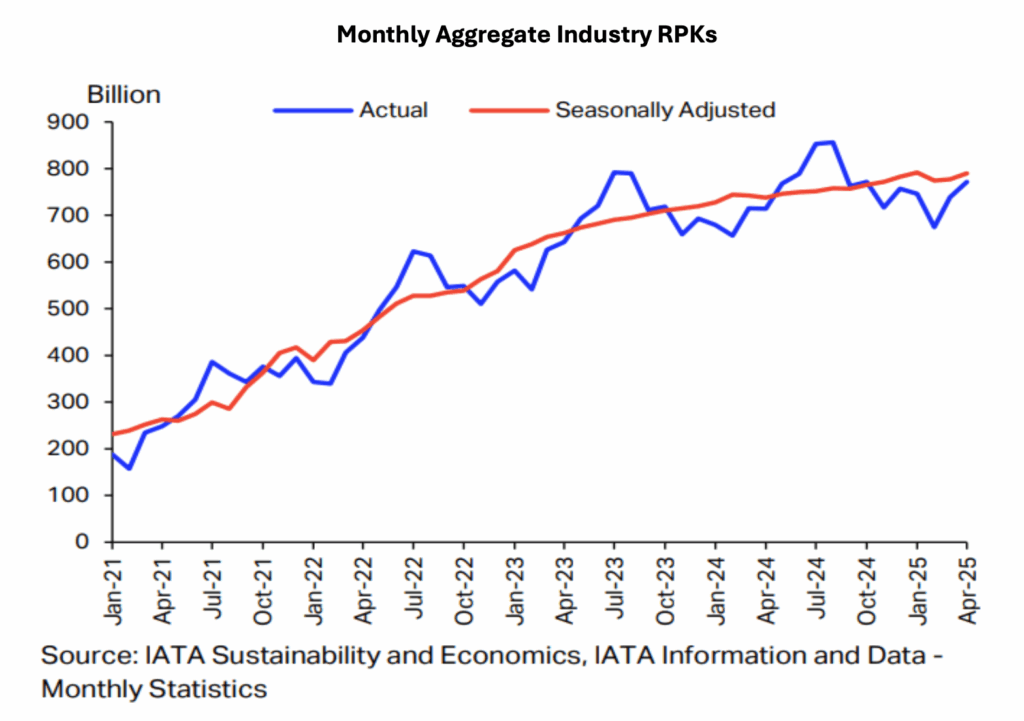
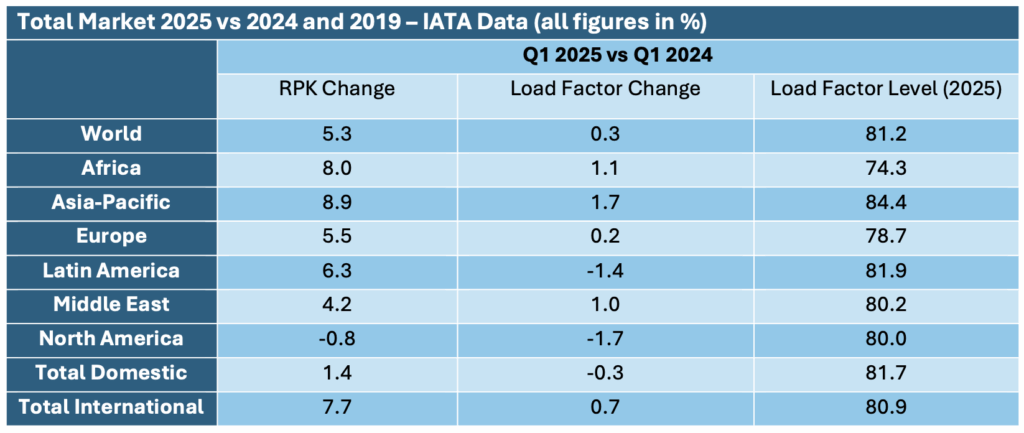
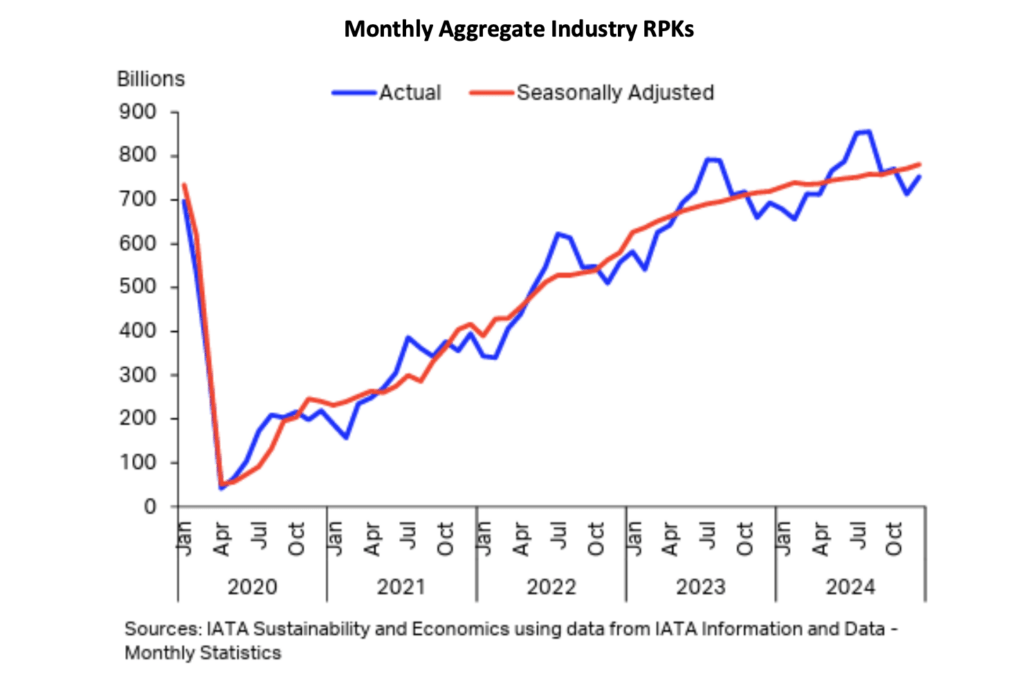
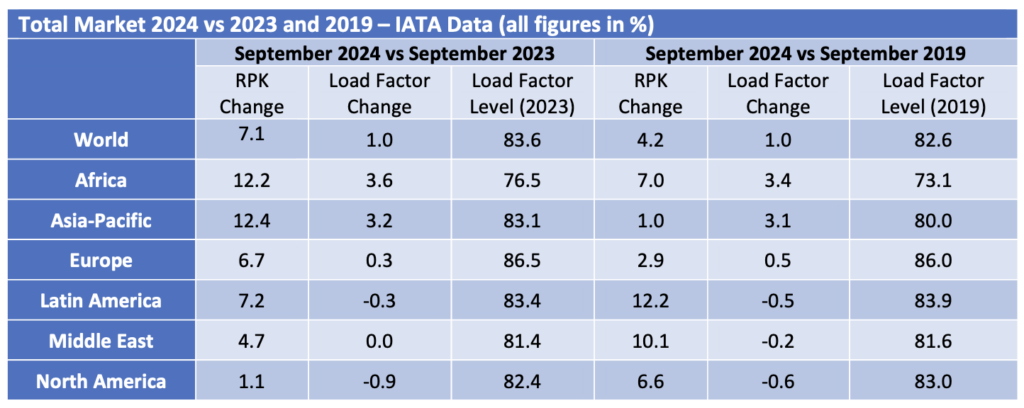
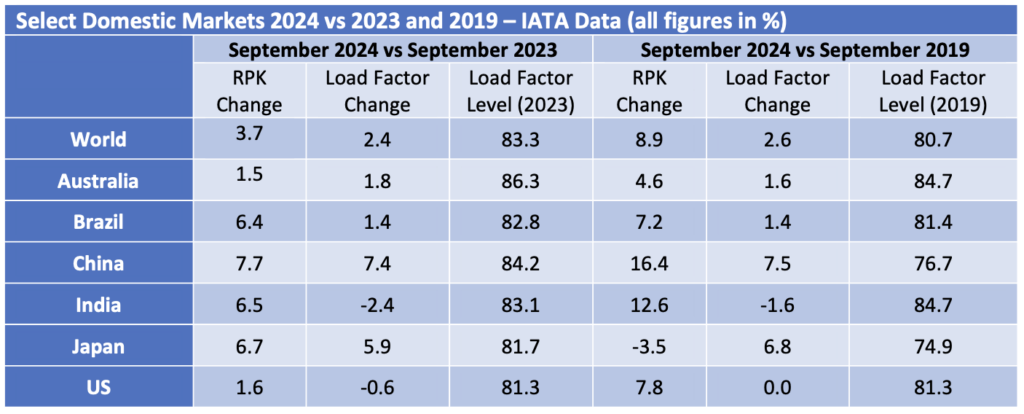
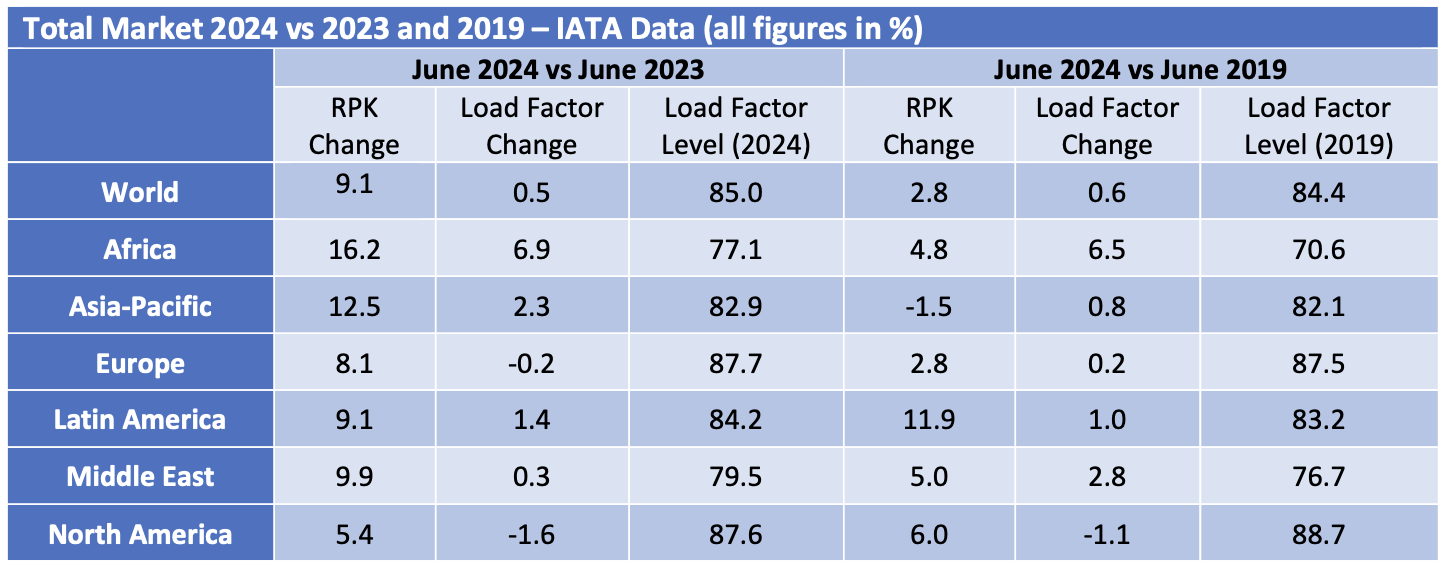
After a very strong January traffic global growth became relatively weaker, although RPKs[2] for the first quarter overall were up 5.3% and a slightly lower increase in ASKs[3] allowed for a modest improvement in load factor. The key growth driver was international traffic in Asia-Pacific which has lagged other markets in its post-pandemic recovery. This was significantly offset by weakness in both domestic and international North American traffic where volatile economic policy in the US appears to have had a negative impact on consumer confidence.
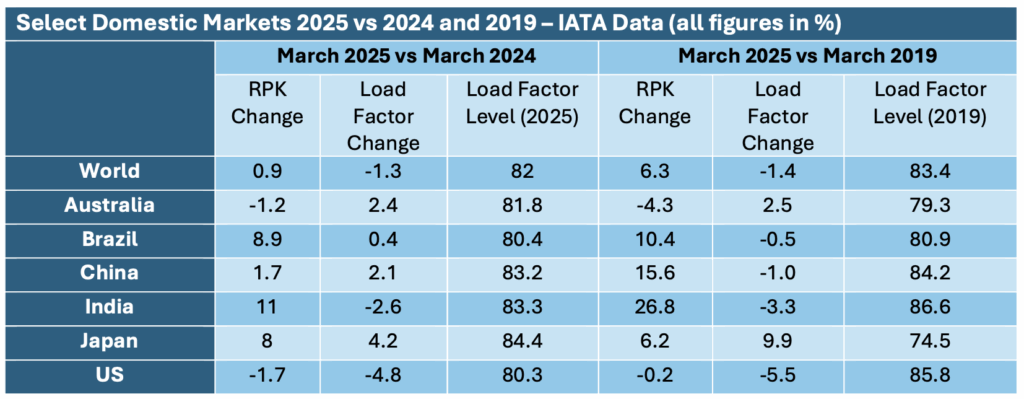
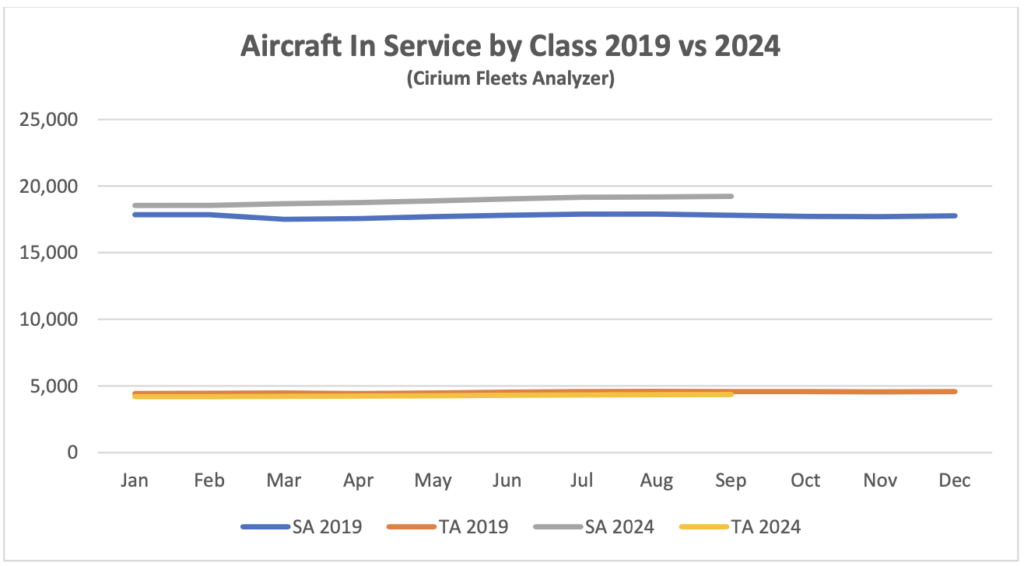
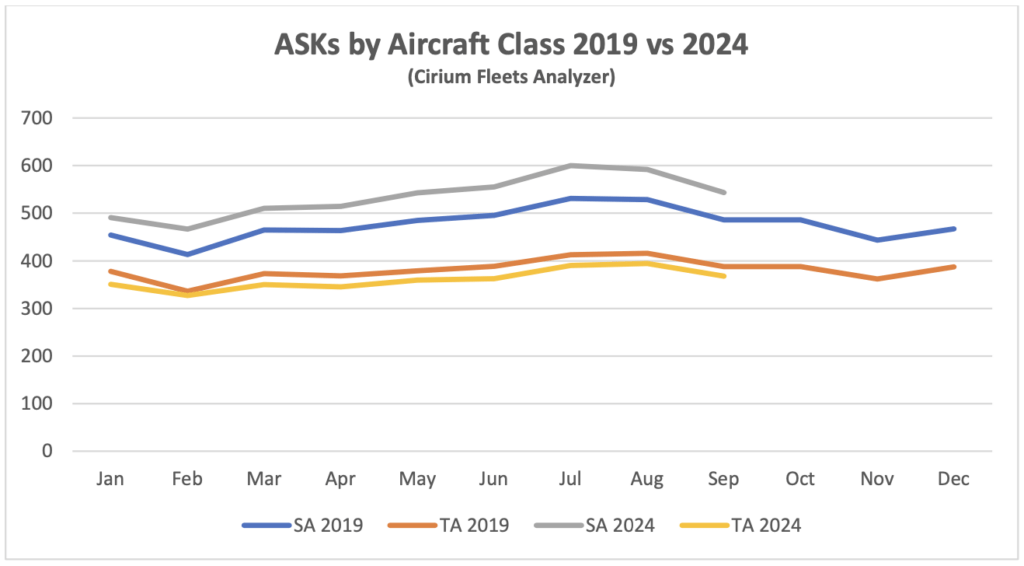
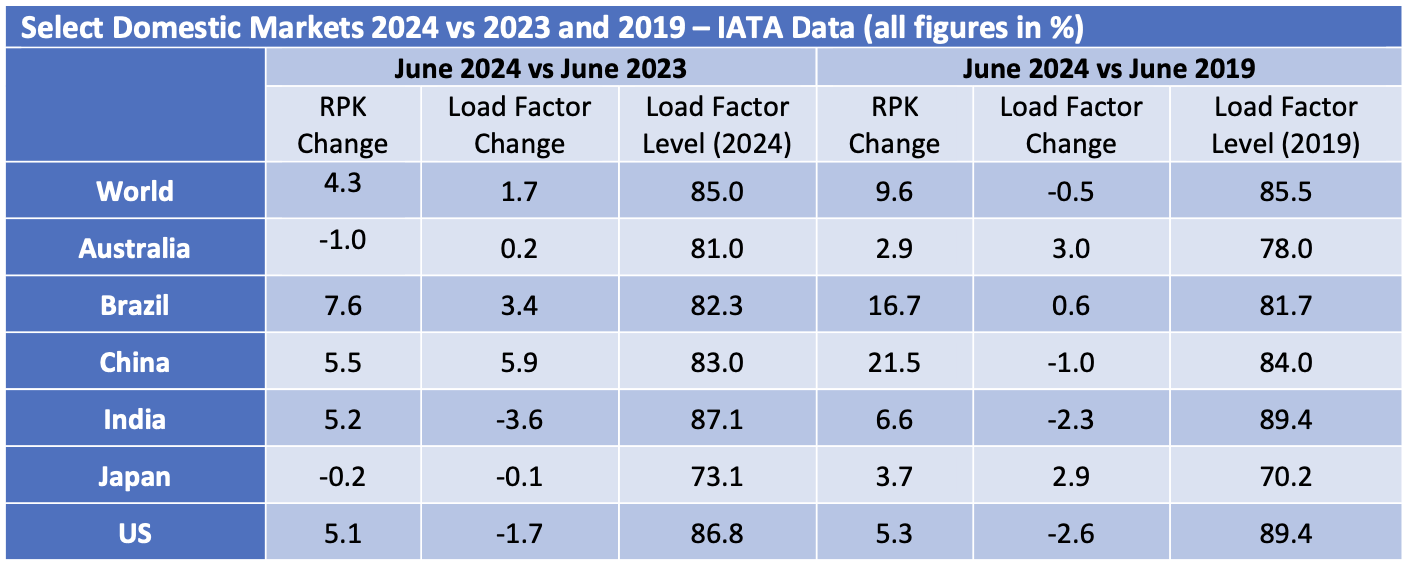
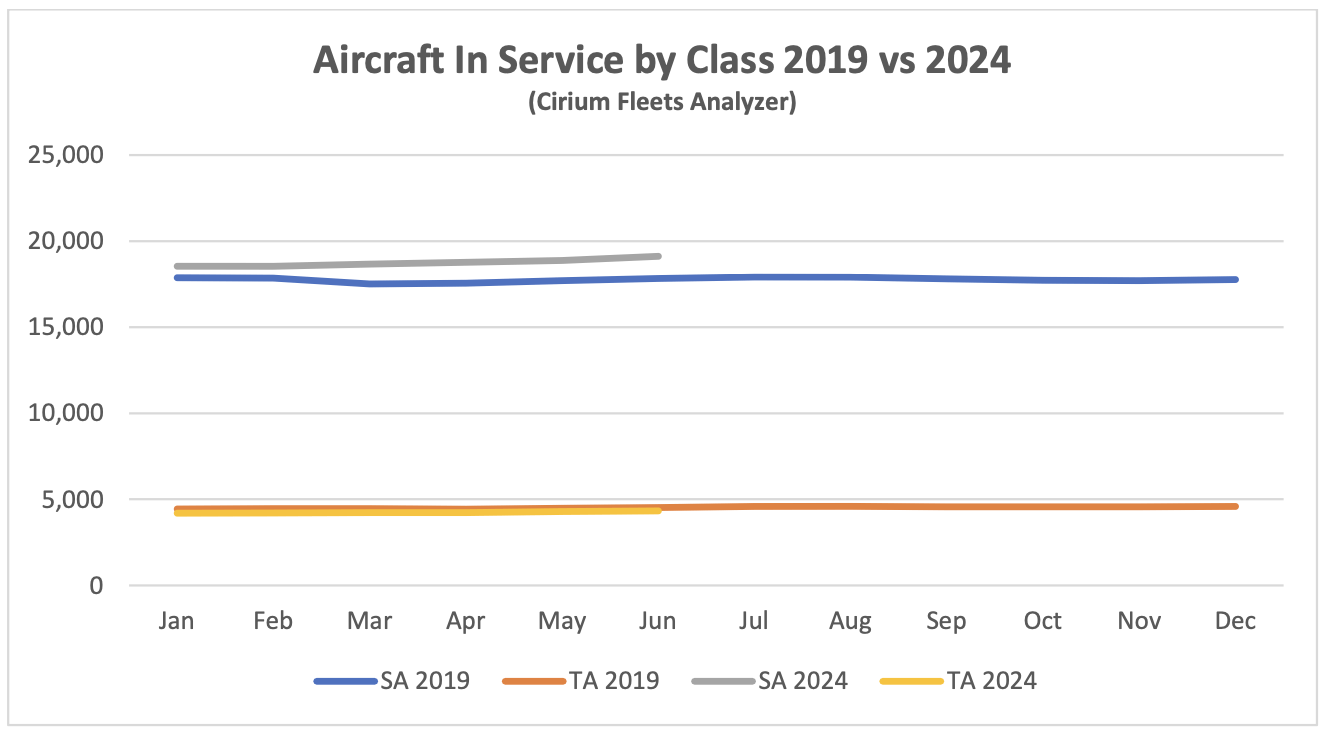
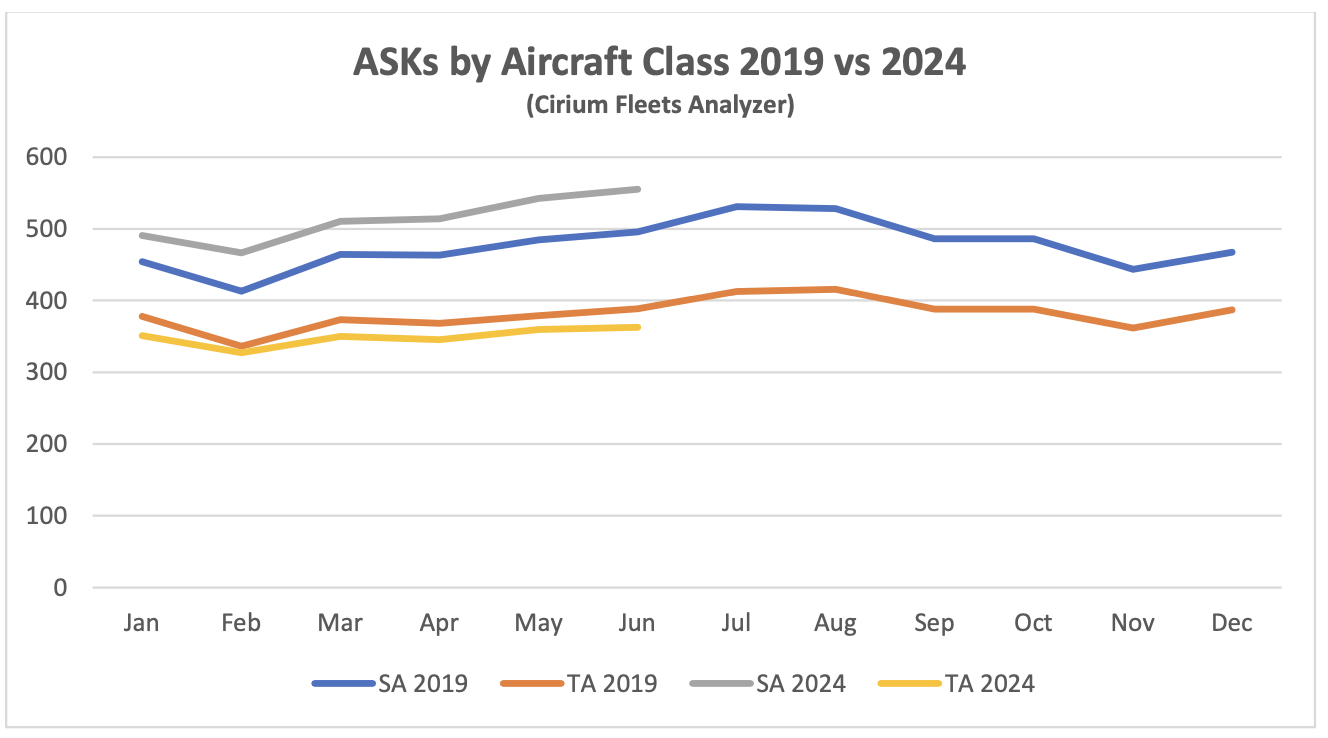
Although some short-haul aircraft serve international routes nearly all long-haul aircraft do so, and this is reflected in the relative demand for single-aisle (narrowbody) and twin-aisle (widebody) aircraft. Aircraft demand can be measured in terms of aircraft in service and ASKs, the standard measure of aircraft capacity deployed by airlines which indicates how intensively aircraft are being flown. Single aisle aircraft demand on both metrics is higher so far in 2025 than in 2019 whereas twin-aisle aircraft are in line.
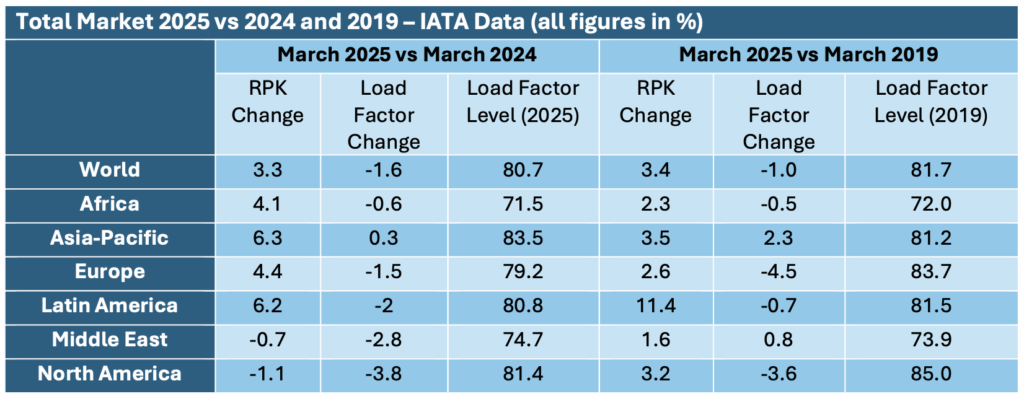
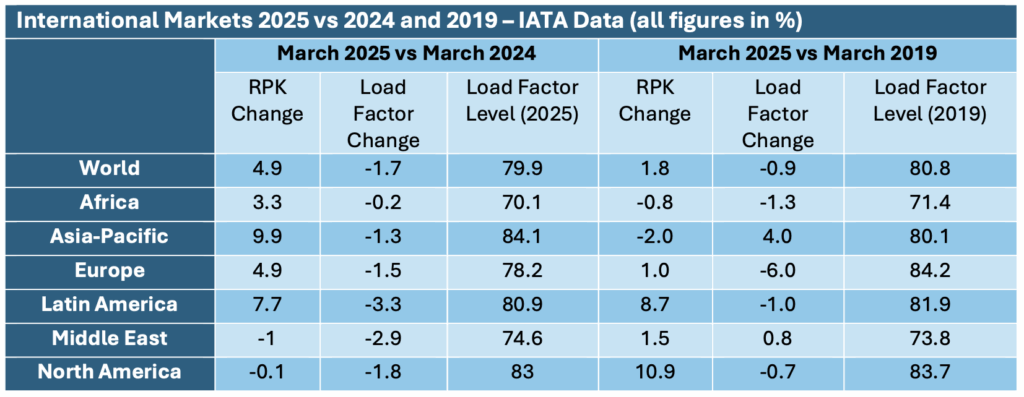
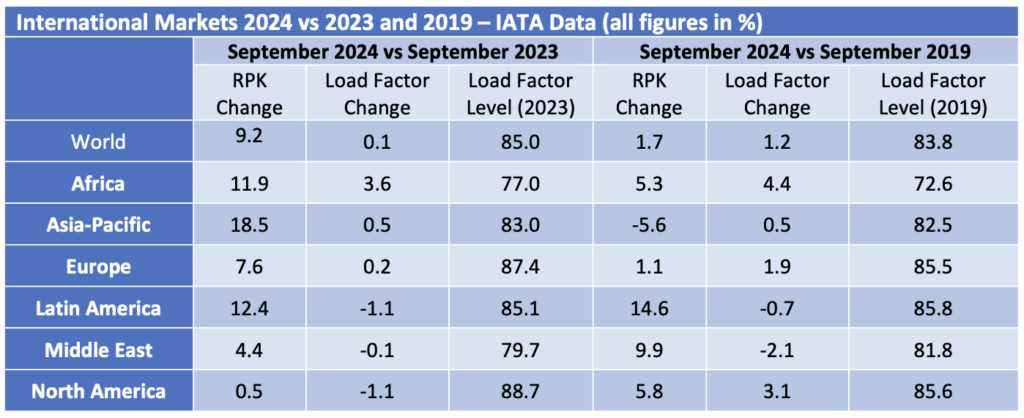
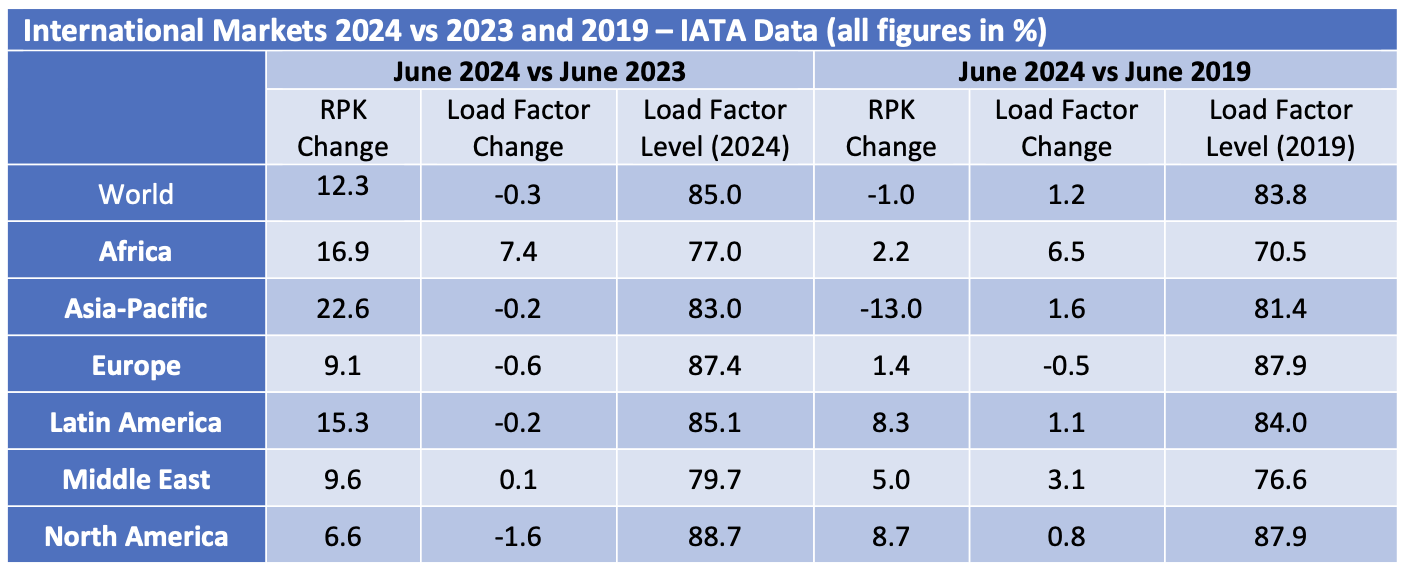
The softer recovery for twin-aisle aircraft is mainly due to weak traffic to and from, and within the Asia-Pacific region. The figures by region in the tables above are based on airline domicile, so weak Europe to Asia traffic reduces recorded international RPKs in other regions. This short-term effect is accompanied by a very gradual long-term increase in single-aisle aircrafts’ share of global airline capacity at the expense of twin-aisle aircraft, which is caused by better operator economics and an increase in the number of markets where single-aisle aircraft can be deployed because of the greater range of new technology aircraft such as the A320 Neo and the B737 Max.
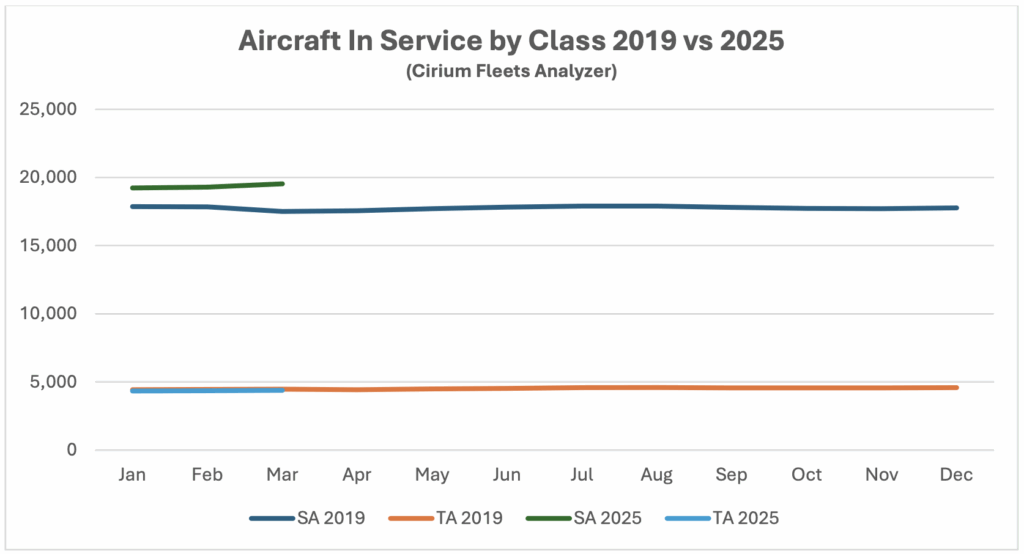

Full recovery has yet to be achieved for twin-aisle aircraft, mainly due to weak traffic to and from, and within the Asia-Pacific region. The figures by region in the tables above are based on airline domicile, so weak Europe to Asia traffic reduces recorded international RPKs in other regions. Twin-aisle aircraft in service has shown a greater improvement relative to 2019 than ASKs which suggests that aircraft are being returned to service with lower utilisation in anticipation of continued recovery.
New Aircraft Supply
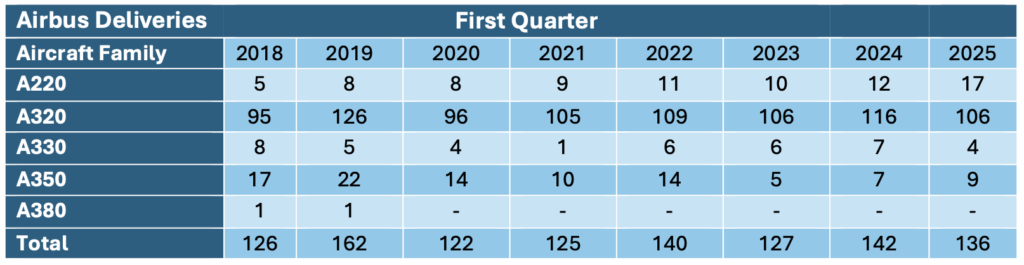
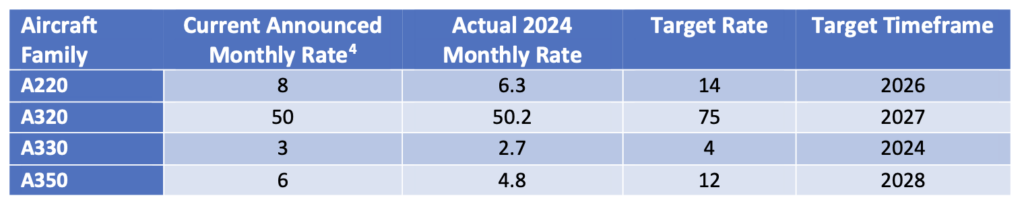
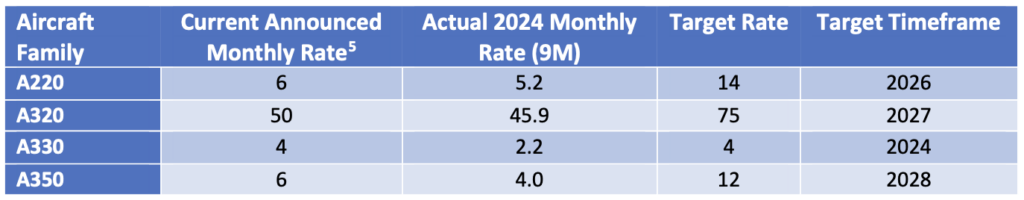
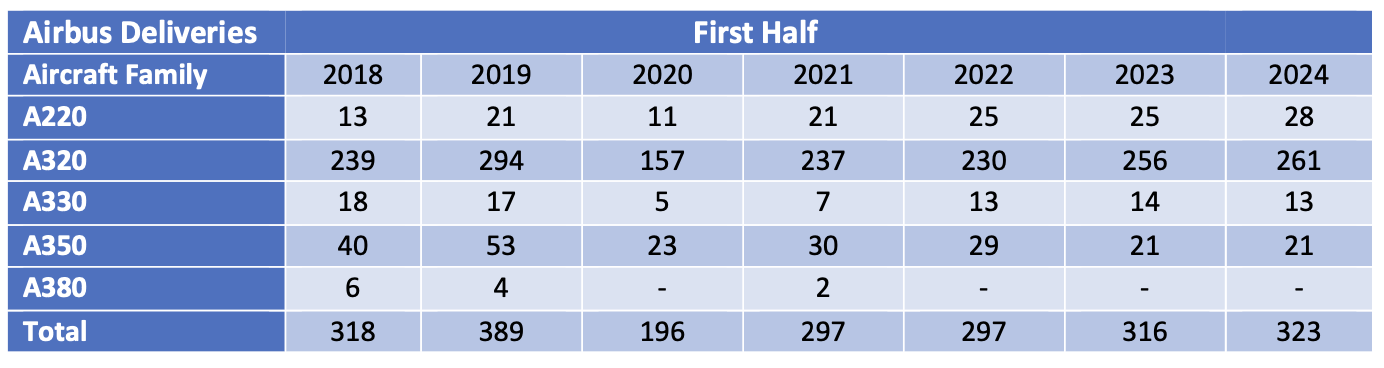
Airbus delivered slightly fewer aircraft in Q1 2025 than in Q1 2024 mainly due to continuing supply chain constraints which were aggravated by the acceleration of some CFM International LEAP engine deliveries into Q4 2024 to meet last year’s delivery target. According to Cirium there is evidence of an increased level of aircraft rolled out of final assembly, but which have not yet flown which indicates that Airbus has a reasonable prospect of meeting its 2025 delivery target of 820 aircraft subject to resolving its supplier issues.
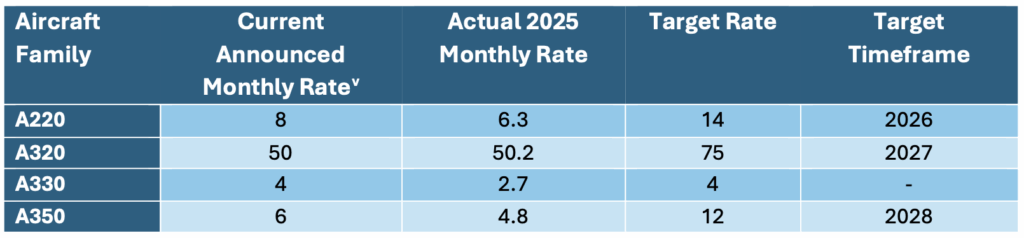
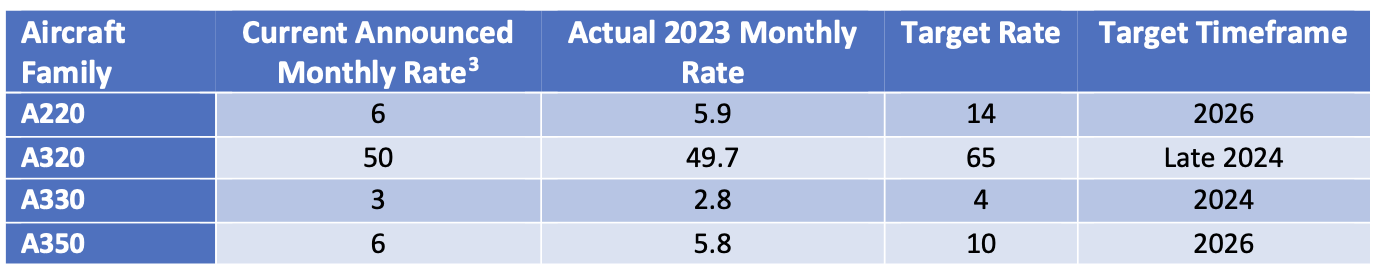
There has been no change in Airbus’s production plans (the current production figures in the table above include some external estimates as well as official Airbus guidance). Where Q1 actual deliveries are lower than current production rates this is most likely due to the typical fall back after the “Q4 rush”.
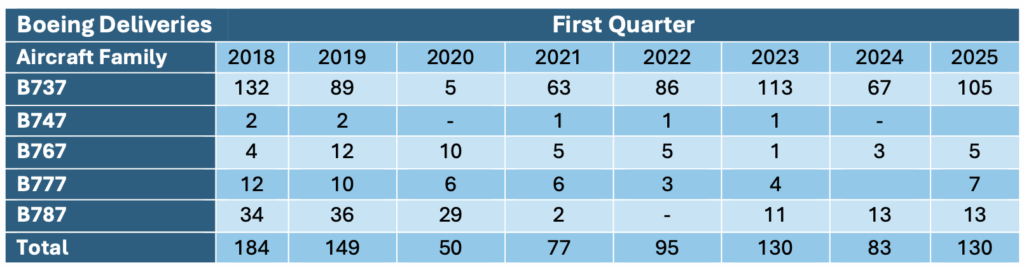
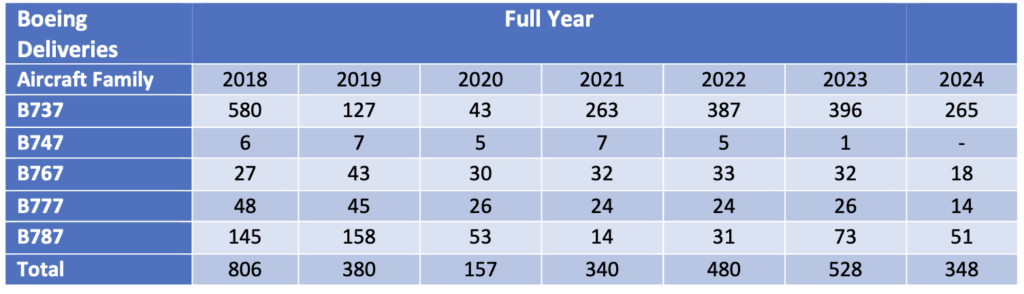
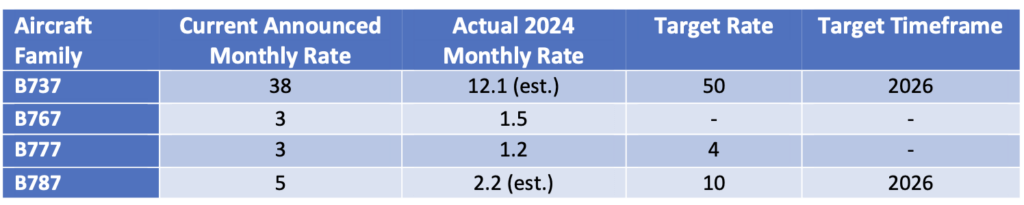
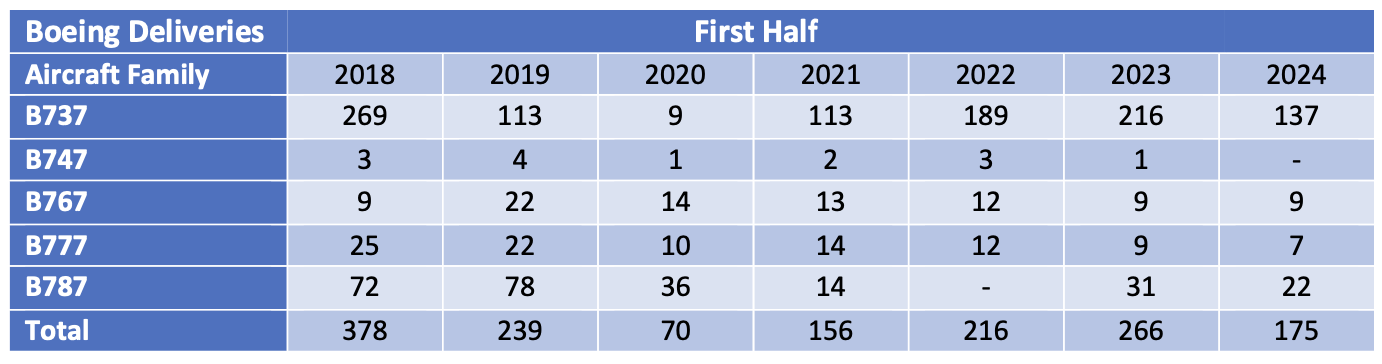
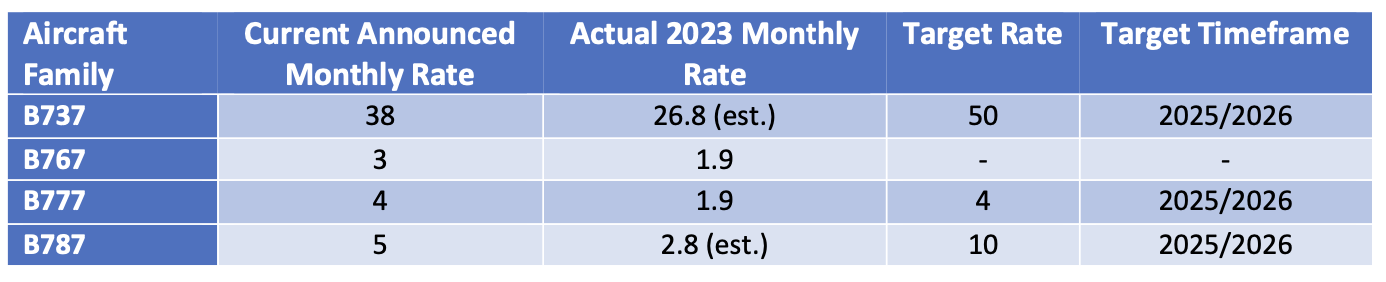
Boeing’s deliveries increased significantly year-on-year although at least some of these were accounted for by reductions in the number of aircraft in inventory. Boeing disclosed a drop of 20 in its B737 inventory in Q1 which we have deducted from Q1 deliveries to arrive at our estimated monthly actual production rate of 28.3. However, our approach relies on incomplete information as the inventory figures quoted by Boeing are in respect of aircraft produced prior to 2023 and there could well be other aircraft in inventory manufactured later. We have made another estimate for the B787 where the Q1 inventory reduction was 5 aircraft although this is subject to the same qualifications as for the B737.
When reporting its Q1 results in April Boeing’s CEO Kelly Ortberg said that the B737 production rate is up to 31 per month and they are working towards the FAA-mandated maximum production level of 38 per month with a medium-term target of 50. The production target for the B787 is an increase from 5 to 7 by the end of 2025 with a further increase to 10 in 2026.
One additional complication for Boeing is the status of aircraft contracted for sale to Chinese airlines who have refused delivery because of tariffs. Boeing said in April that they have 50 B737s and 4 B787s scheduled for delivery to Chinese airlines in 2025. Where an aircraft is not completed there should be relatively little downside for Boeing because other customers will likely take them given the large backlog for both aircraft types. Where the aircraft are completed there would be significant expense and delay to change to a different customer’s specification, but this can be done. Obviously, the situation around tariffs is subject to a lot of uncertainty and this problem may be resolved through political negotiations.

The broader impact of actual and potential tariffs on aircraft manufacturers is very hard to envisage at the time of writing as the global nature of their supply chains creates a lot of complexity compared to e.g., cars. Already certain exemptions for major components have been announced such as the Chinese government’s exemption for CFM engines supplied to COMAC.

Airline Industry Financial Performance

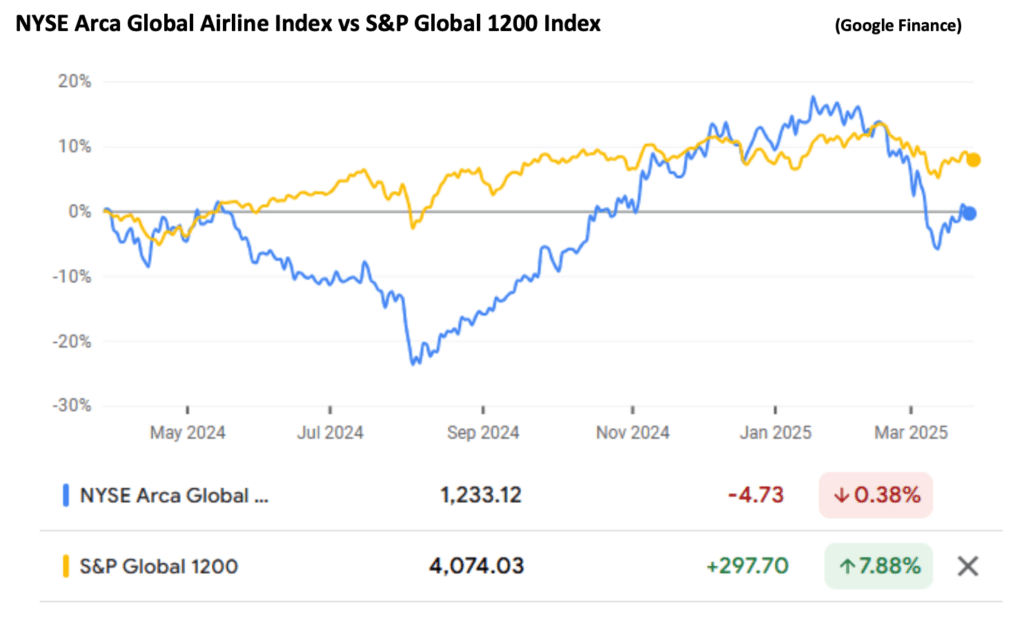
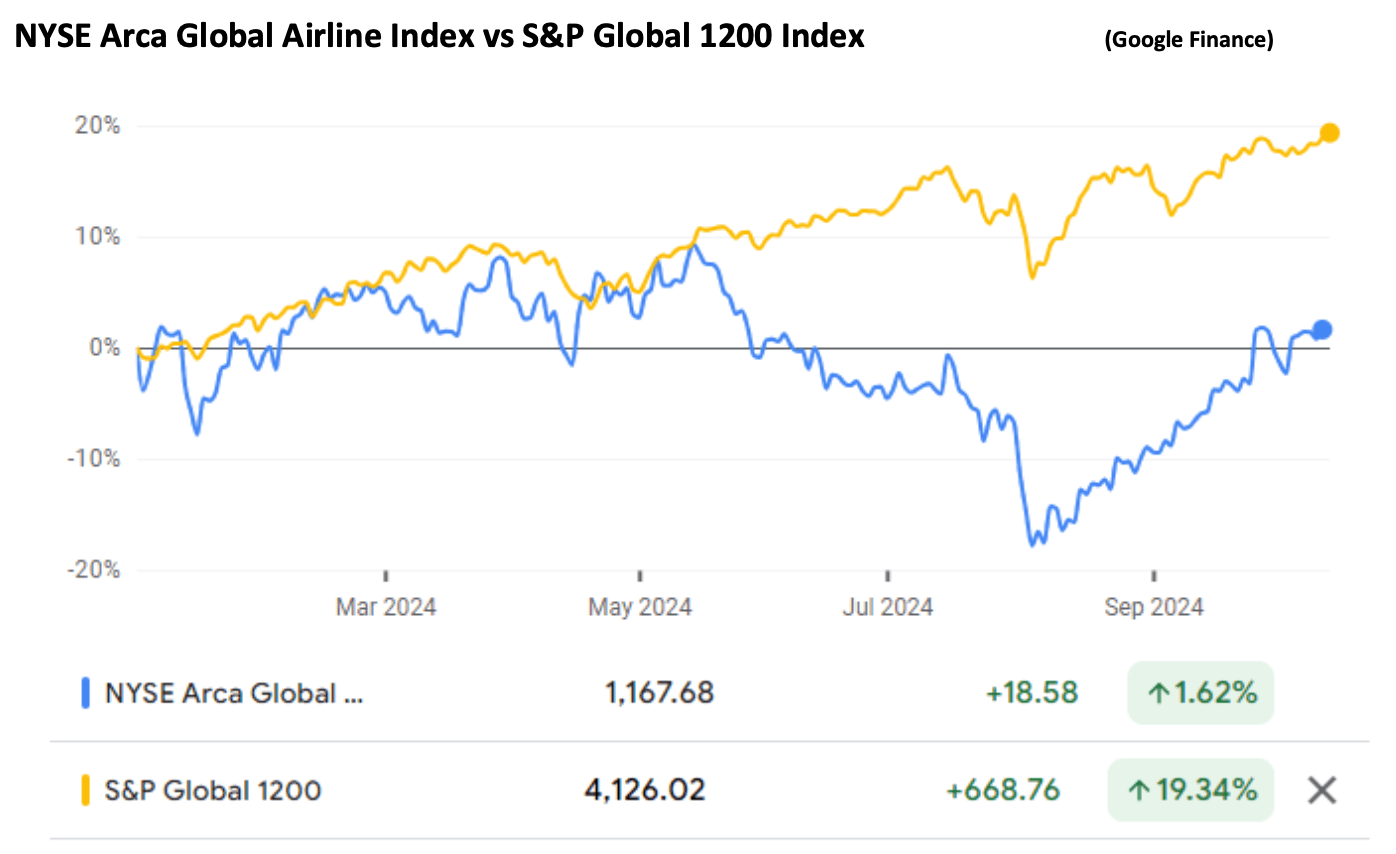
Airline stocks fell more heavily than the overall market in April, which is not surprising as the NYSE Arca Global Airline Index is heavily weighted towards US airlines and the latter have published several profit warnings on the back of weak travel demand.
There had been very few airline failures so far in 2025 until Azul filed for bankruptcy last month. Of the two largest bankruptcies in 2024 Spirit exited from bankruptcy in March and Gol will likely follow in June. Azul’s bankruptcy is another example of how difficult it is to avoid this procedure if all one’s competitors have availed of it (see above). Our historical analysis suggests that there will be more financial distress over the rest of 2025 than has occurred to date.

Appendix – Airline Industry Default Study Methodology
Our study has some limitations mainly driven by practicality. We only cover all airlines that have operated more than 5 passenger jet aircraft at any year end since 1970 according to Cirium Fleets Analyser. This reduces the number of airlines we need to research from 2,914 with no size cut-off to 1,163, but we still cover 98% of the passenger jet fleet by units.
We also limit our statistical analysis in time to start in 1990 because certain key characteristics of the industry changed around this time, notably deregulation and the rise of aircraft leasing as a source of capital. Going back to 1970 would lower our estimated average annual default rate but we believe that conditions prior to 1990 were not comparable.
We due diligence the history each airline based on public sources and record defaults captured by this research. We also add defaults for airlines in emerging market countries that experience sudden fleet reduction as the events caught by this rule may well represent informal defaults that occur without court proceedings. Our final output is adjusted defaults which combines both research-based and rules-based defaults after eliminating mergers and double-counts. The number of adjusted defaults is c.50% higher than for research-based defaults alone. We measure adjusted defaults based on the number of airlines and the number of affected aircraft. Our airline fleets data source is Cirium Fleets Analyzer.
- Airline population limited to airlines with 6 or more aircraft at year end during study period – There are 1,163 airlines that had a fleet of 6 or more aircraft out of 2,914 total airlines
- Historic default events are Research based, or Rules based.
- Research based events are derived from study of relevant academic/government publications and online resources (Airlines for America, Wikipedia)
- Single airlines can default on multiple occasions
- Cessation/suspension of operations assumed to result in default unless there is clear evidence that this was not the case
- Every single airline with its own licence (“AOC”) counts as a default e.g., both the LATAM and Avianca groups filed for bankruptcy in 2020, and as a result each of their subsidiaries, which also had distinct licences, experienced a default and is counted separately
- Research based events are derived from study of relevant academic/government publications and online resources (Airlines for America, Wikipedia)
- A Rules based event only occurs for airlines based in an emerging market country (per World Bank classification) where default processes are assumed to be more informal. A Rules based event occurs if:
- An airline with 15 or more aircraft has a year-on-year fleet reduction of 20% or more, or
- An airline with less than 15 aircraft has a year-on-year fleet reduction of 3 or more aircraft
- Some events are eliminated if research shows there clearly was no default i.e. Copa Airlines Colombia
- An airline cannot default two years in a row e.g. bankruptcy shortly followed by cessation of operations in the following year is treated as a single default
- Adjusted Defaults by Airline are the combination of Research Based and Rules Based events which are filtered to eliminate mergers and duplication of events.
- Adjusted Defaults by Aircraft take the fleet size the year before the defaults occurs, not the max fleet size for the airline.
[1] Although 2020 was a record year for defaults there were also significant rent deferrals granted by lessors to airlines which can reasonably be considered as additional payment delinquency that is not captured by our methodology. As most of these deferred amounts have been repaid this was a strong case of enlightened self-interest on the part of the lessors, although this is clearer with hindsight than it was at the time.
[2] RPKs is the acronym for revenue passenger kilometres, which is the product of the number of paying passengers times distance flown.
[3] ASKs is the acronym for available seat kilometres, which is the product of the number of available seats flown times distance flown.
Disclaimer
Industry Update Q4 2024
- Special Topic – Aircraft Economic Life
- Macro-Economic Background
- Traffic and Aircraft Demand
- New Aircraft Supply
- Airline Industry Financial Performance
Aircraft Economic Life
As we discuss in more detail below 2024 was another very weak year for new aircraft deliveries. The recent decline is unprecedented as the delivery trough was 723 aircraft, 45% of the prior peak of 1,619, but on this metric, it is not much more severe than the decline of the early 1990s where the trough was 385, 50% of the prior peak of 771 (these figures include McDonnell Douglas although it had not yet been acquired by Boeing).
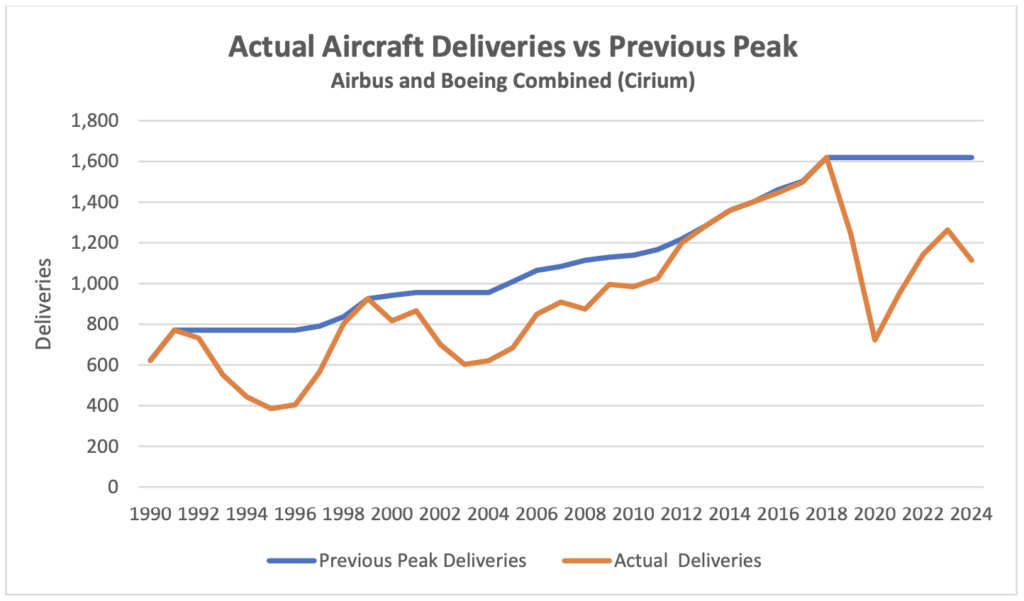
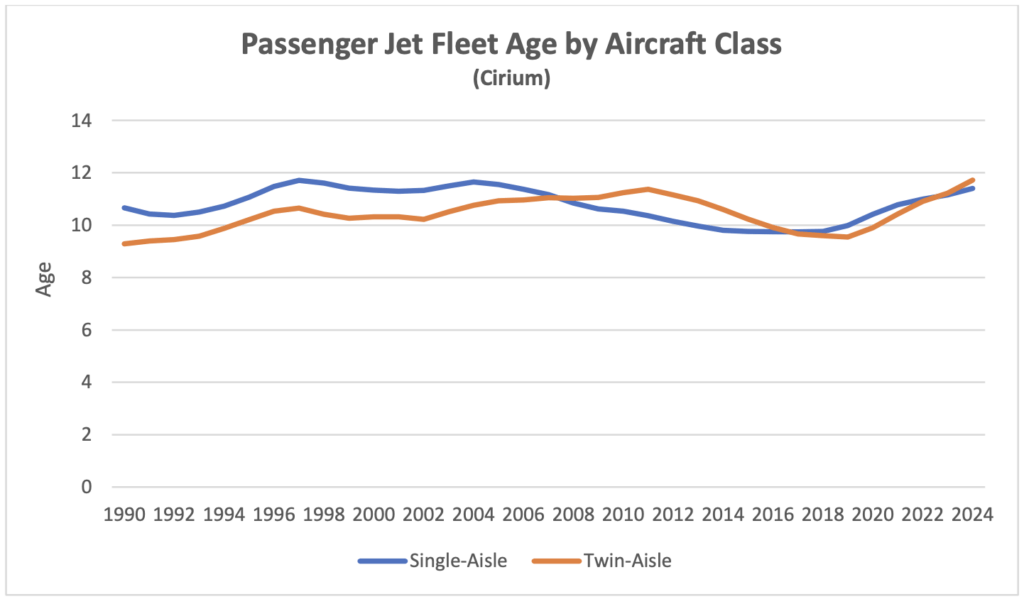
It took until 1998 for deliveries to exceed the level achieved in 1991. We are now in 2025, which is also 7 years after peak deliveries, but we are probably still some years away from the level achieved in 2018. There is strong evidence of increased demand for used aircraft because of the shortfall in new capacity and as one would expect the average age of aircraft has increased (the charts below refer to passenger aircraft only – although some passenger aircraft have their lives extended by conversion to freighter and other uses the numbers are relatively small).
As one might expect a low level of new aircraft deliveries has led to an increase in average fleet age, which is now as high as it has ever been since 1990 for both single-aisle and twin-aisle aircraft (twin-aisle average aircraft age has gradually increased relative to single-aisle aircraft as the latter had a “head start” with entry into service 6 years before the first twin-aisle delivery).
This increase in fleet age suggests it’s worthwhile to look at trends in aircraft retirals as these should be related. This raises the question of what the most useful data is to look at. If one considers the number of aircraft retirals, both in absolute terms and as a percentage of the world fleet, the results do not show any particular trend after 2010 – the increase prior to 2010 is largely due to the maturing of the world fleet as hardly any aircraft had been retired prior to 1990 other than obsolete early technology types.
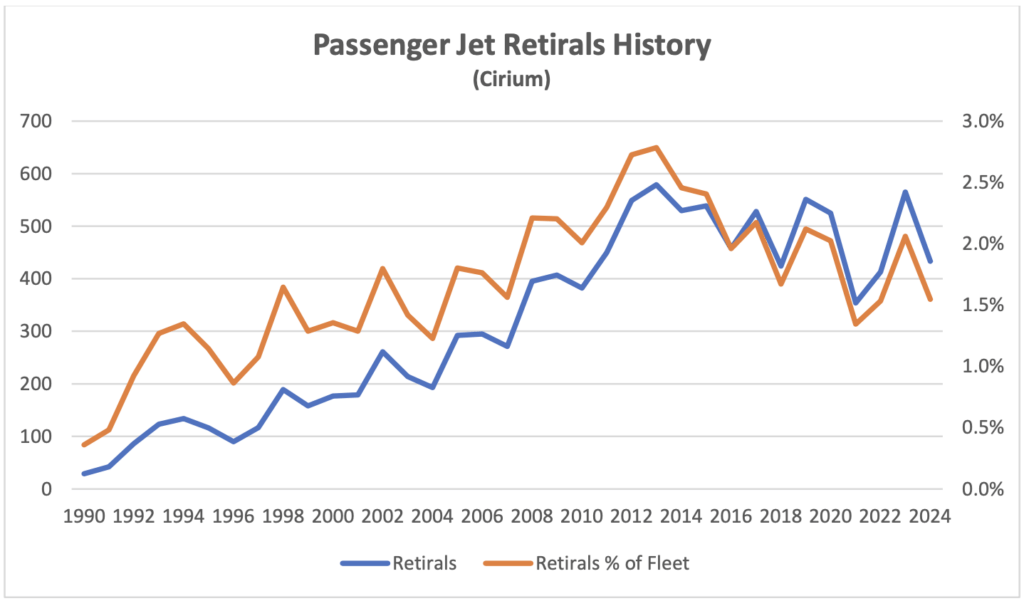
A more helpful way to analyse retirals data is to look at average age at retiral where a much stronger pattern emerges with a “plateau” from around 2001 to 2008 with a gradual decline thereafter. This helps to explain why retiral volumes are volatile – if retirement ages only change very gradually but the level of historic new aircraft delivery volumes was volatile it follows that retiral volumes will also be volatile. It is also noteworthy that retiral ages are consistently higher for single-aisle aircraft because they are less exposed to several important risks especially improvements in technology which have a greater relative impact for aircraft that fly long-haul.
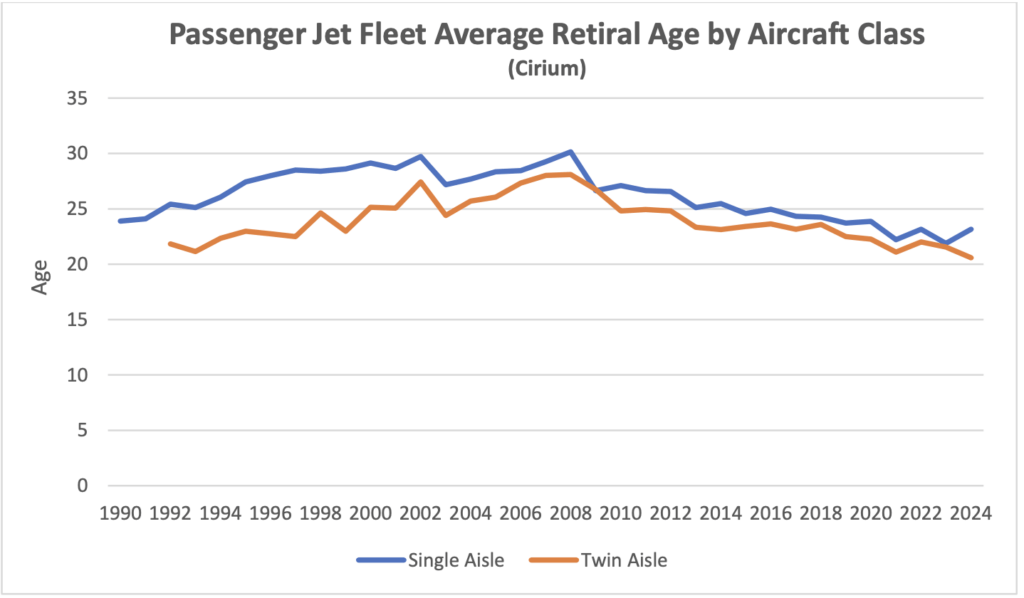
The impact on retiral age of reductions in new aircraft deliveries in the early 1990s and from 2019 has been very different. In the 1990s there was a sharp increase in age at retiral which one would expect given the drop in deliveries and increase in average fleet age. Although both these conditions have also prevailed since 2019 the long run drop in average age at retiral that started in 2008 has broadly continued.
We believe that the most important cause of this difference is the increased share of the fleet owned by lessors. As investors seeking to maximise the present value of their assets, lessors are typically reluctant to commit additional capital to redeploy an aircraft with a new airline operator once it reaches c. 18 years old because there is very little time in which to recoup this investment.
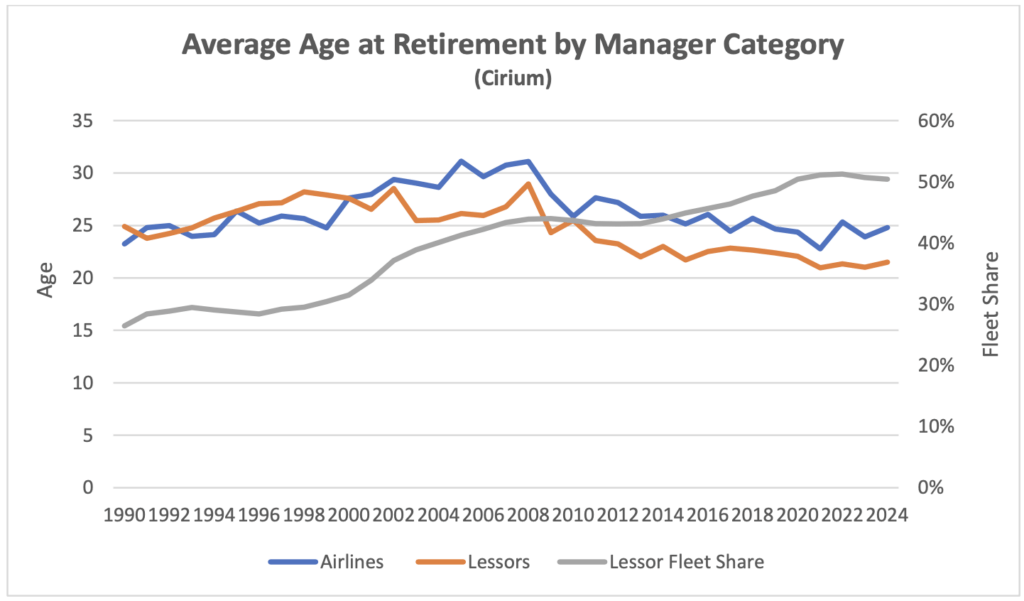
Lessors consistently retire aircraft at younger age than airlines as the redeployment cost issue does not arise for the latter.
The key factors affecting a lessor’s decision whether to reinvest are the break-up value of the aircraft and the cost of redeployment. Break-up values have been increasing relative to value in use for many years, mainly because the value of an aircraft’s principal components, its engines, have been increasing in relative terms. In 1998 engines accounted for c. 25% of the cost of a new aircraft whereas in 2024 the proportion was over 50%.
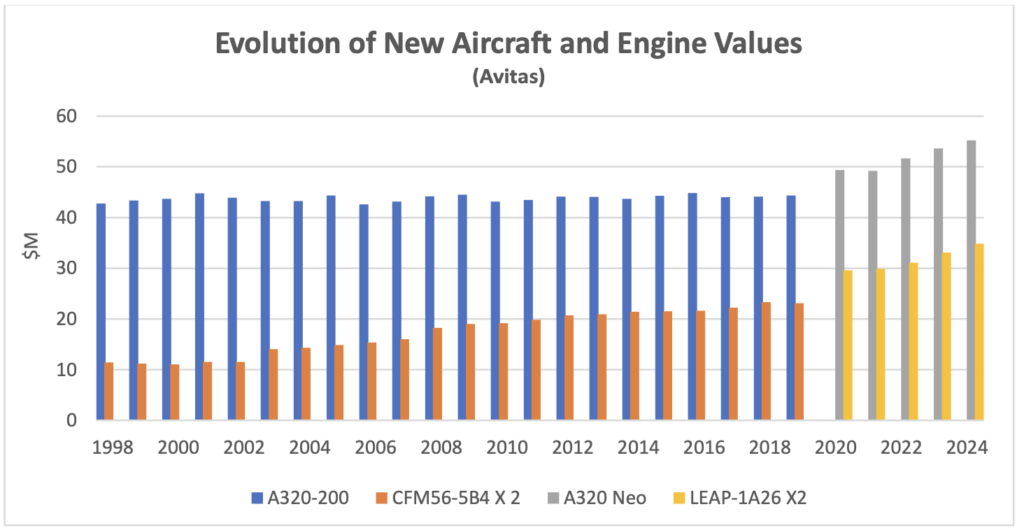
Break-up value is largely driven by engine values, which are in turn very dependent on the value of engine spare parts. The engine manufacturers have an effective monopoly on new spare parts and have historically enjoyed significant pricing power until c.10 years from when the relevant aircraft type ceases production. For many years engine spare parts prices have increased by 6-7% p.a. while new aircraft prices have increased by 1.0-1.5% p.a.
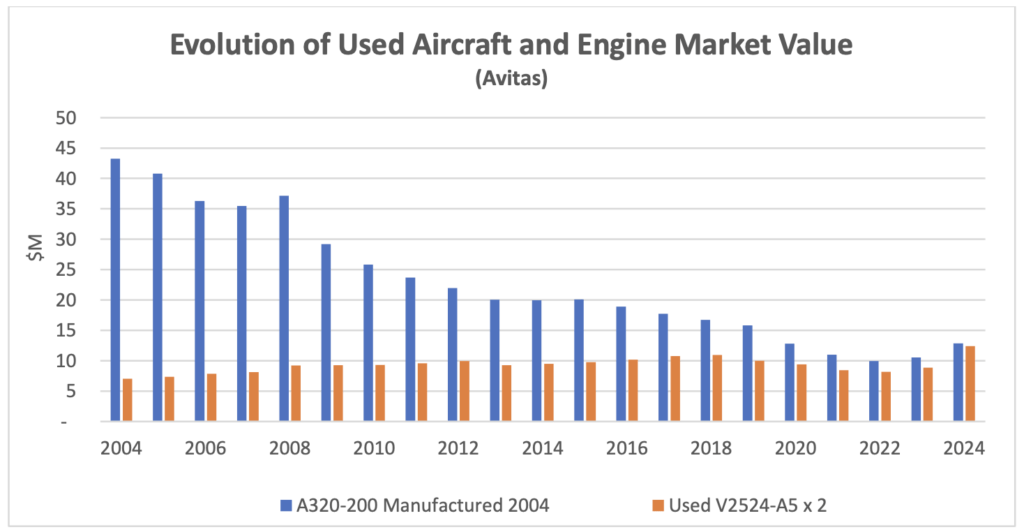
These trends have created a situation where stand-alone engine values can exceed an aircraft’s value including engines well before the point where the aircraft has reached its potential service life. Where an existing airline operator is happy to extend a lease, a lessor will have very little cost associated with extending its revenue stream and is likely to choose this option so not all aircraft will be broken up at the same age.
One way to test the importance of break-up values is to look at what has happened with different members of the A320 Ceo and B737 NG families. Break-up values are very similar for all family members, but the larger models command higher rents, so if break-up values matter, we should expect to see smaller types retired earlier and in greater numbers. The chart below shows how the different family members have performed through 2024 and supports this view. Smallest to largest aircraft types are presented left to right.
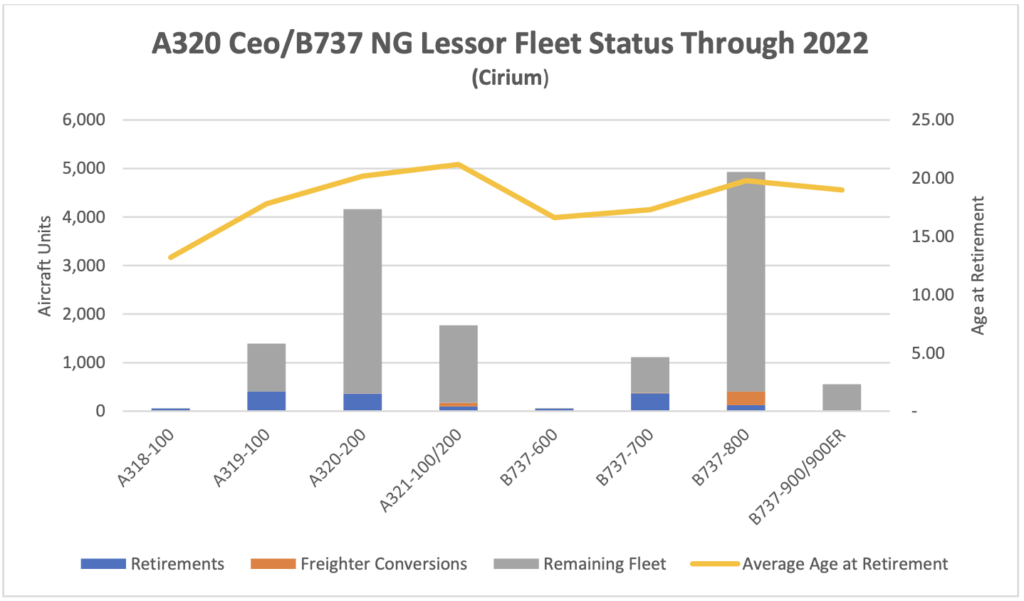
We believe the “pull factor” of attractive break-up values has been the main driver of reduced age at retiral for single-aisle aircraft but not for twin-aisle aircraft. It should be borne in mind that not all engine types have the same level of marketability. The CFM56 and V2500 engine types associated with the A320 Ceo and B737 NG aircraft families[1] are overhauled by several different market participants who compete to buy used engines. Most twin-aisle aircraft engines are subject to a total care agreement with the engine OEM which also dominates maintenance activity, so market dynamics are much less favourable for engine owners.
There are also major differences in relative redeployment costs because twin-aisle passenger cabins are more heavily branded and customised. A 12-year-old A320-200 with an Avitas market value of $22M would be very unlikely to cost more than $1M to redeploy, whereas an A330-300 of the same age with an Avitas market value of $31M could cost anything from $15M to $25M. Based on this we believe that falling ages at retiral for twin-aisle aircraft are more a function of “push factors”.
Whatever the causes the fall in deliveries and the continued reduction in age at retiral has created a very unusual distribution of aircraft by age compared to any time since 1990. Aircraft aged 5 to 20 years old account for an unprecedented fleet share and if anything, this is likely to increase.
![]()
These unusual circumstances have not led to a “capacity crunch” so far. This is mainly because global RPKs remain well below their long-term trend (see our Industry Update for Q1 2024 Traffic Growth Outlook). Airlines have been very keen to extend leases as much because of uncertainty surrounding the timing of future deliveries as because of any immediate shortage of capacity.
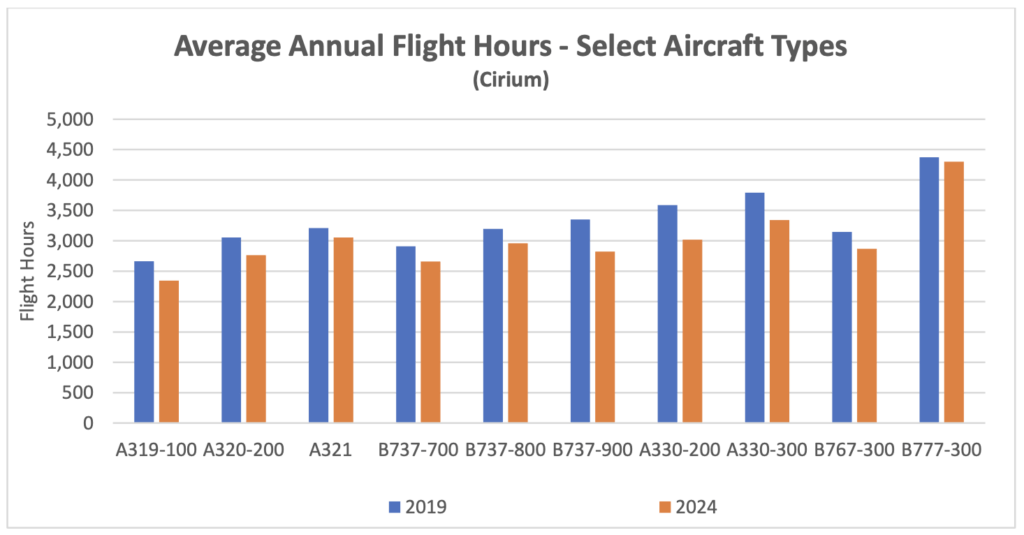
As a cross-check on the fleet data in the charts above we have looked at the utilisation of the aircraft types that are key constituents of the 5–15-year-old fleet. In all cases flight hours are lower than in 2024 than in 2019 with a greater gap for twin-aisle aircraft. A modest reduction in flight hours should be expected as these aircraft types were largely out of production around 2019 so on average, they were 5 years older in 2024 and aircraft productivity reduces with age. Load factors also influence aircraft productivity, and these were slightly higher in 2024 compared to 2019 (see below). To conclude it seems likely that either a continuing shortfall in new aircraft deliveries or a recovery in traffic towards its long-term trend (or a combination of the two) could lead to a significant tightening in the aircraft market.
Macro-Economic Background
The IMF’s January 2025 update to its World Economic Outlook had very similar projections for global GDP growth as in October 2024. The chart below compares the 2024 forecast with its three most recent predecessors. The forecast horizon moves forward each year, so it is helpful to create indices that help visualise the rate of change – obviously steeper is better. The October 2024 forecast was notably more positive than the previous two years. The next full WEO will be published in April 2025, and it will be interesting to see if their view has changed given the threat of significant disruption of international trade.
Economic growth is a key driver of long-term growth of air travel. However, since early 2020 its impact has been overshadowed by the fall and recovery in traffic associated with the pandemic. In time the influence of overall economic conditions on air travel is likely to reassert itself, but industry forecasts published by Airbus, Boeing and IATA assume much higher rates of traffic growth than GDP growth over the rest of the 2020s as the former catches up to its long-term trend (see our Q1 2024 Industry Update for a more detailed discussion).
The US Dollar has recently surpassed its previous 2022 peak, creating pressure for airlines outside the US for dollar-denominated costs such as fuel, aircraft rents and aircraft spares. The price of jet fuel has remained volatile, but it has continued its gradual decrease from February 2024. This reduction has mainly been driven by a reduction in the “crack spread” from c.$30 to less than $17.
Another indicator that is potentially important to aircraft investors is the breakeven inflation rate on US Treasury Inflation-Protected Securities (TIPS). This indicator measures inflation expectations and it matters because used aircraft values are strongly influenced by the cost of new aircraft and over time this cost is linked to US Dollar inflation. In the short term this linkage is driven by escalation clauses in aircraft purchase contracts and in the long term by the general input cost environment for the aircraft manufacturers. The chart below compares the breakeven rate for 10-year and 5-year TIPS.
Although medium or long-term inflation expectations have never gone higher than 3.5%, actual inflation experience has been much higher in the last few years. This has led to higher appraised values for new aircraft. If tariffs are applied to aircraft and/or aircraft components this is likely to increase the cost of new aircraft.
Traffic and Aircraft Demand
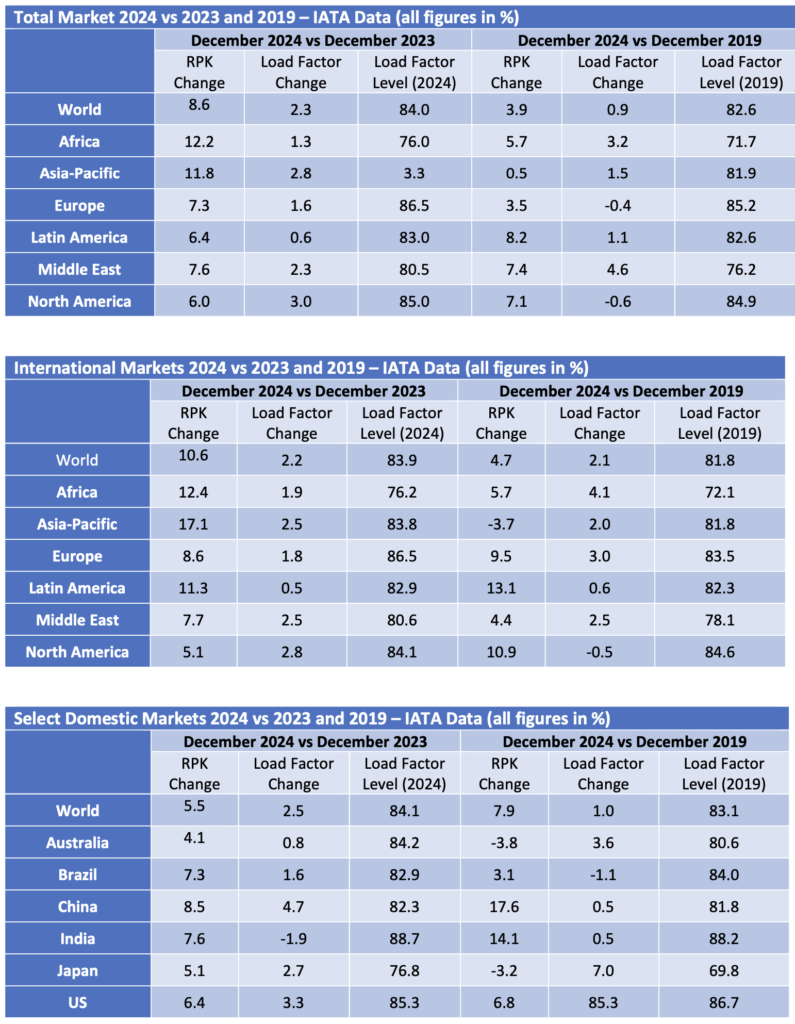
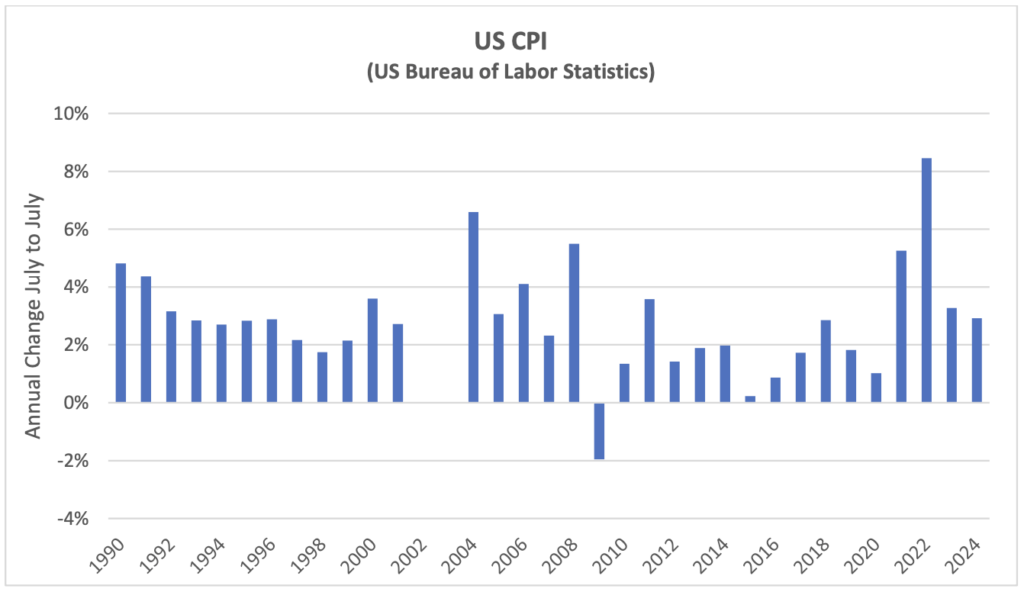
During 2024 RPKs [2] grew 10.4%, slightly faster than ASKs[3] leading to an improvement in load factor, and broadly in line with IATA’s full year forecast of 11.2%. 2024 also was the first year where total RPKs exceeded 2019. Growth by region was strongest in Asia-Pacific mainly because its recovery has been delayed compared to the rest of the world due to the relative persistence of pandemic-related government travel restrictions. International traffic growth was higher than domestic for the same underlying reasons.
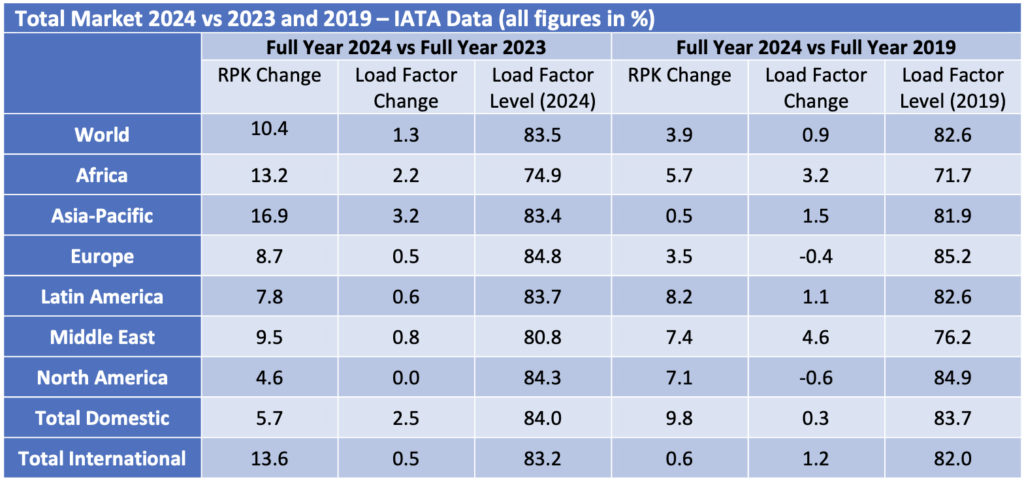
The month of December 2024 was a bit weaker than expected (the IATA forecast referenced above was updated just weeks before the end of the year). However, growth improved significantly in January 2025, suggesting that December’s figures did not presage a persistent weakening trend.
Although some short-haul aircraft serve international routes nearly all long-haul aircraft do so, and this is reflected in the relative demand for single-aisle (narrowbody) and twin-aisle (widebody) aircraft. Aircraft demand can be measured in terms of aircraft in service and ASKs, the standard measure of aircraft capacity deployed by airlines which indicates how intensively aircraft are being flown. Single aisle aircraft demand on both metrics is higher so far in 2024 than in 2019 whereas twin-aisle aircraft are marginally weaker by aircraft in service and lagging more in terms of ASKs. The difference between the two metrics may be down to the gradual move away from very large aircraft such as the B747 and A380 towards the smaller B787 and A350, resulting in fewer ASKs per aircraft unit. It is hard to see the TA 2024 data series because it is only very marginally lower than TA 2019.
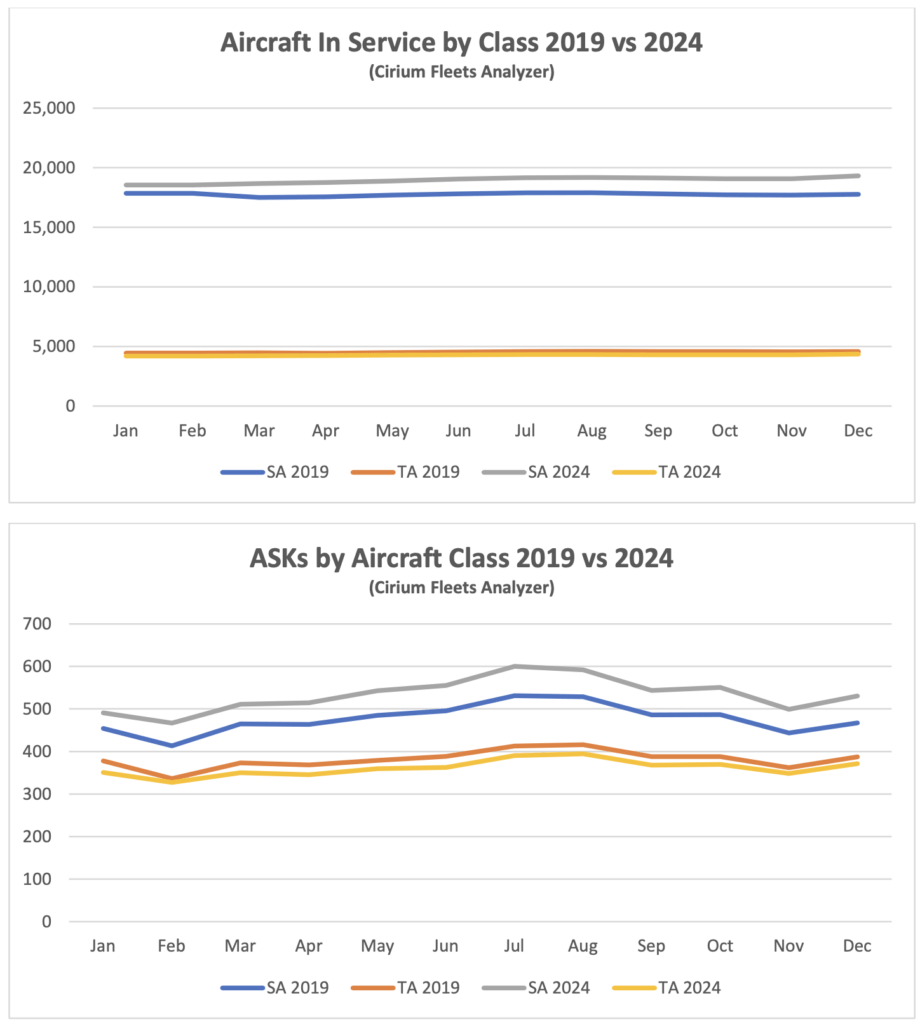
Full recovery has yet to be achieved for twin-aisle aircraft, mainly due to weak traffic to and from, and within the Asia-Pacific region. The figures by region in the tables above are based on airline domicile, so weak Europe to Asia traffic reduces recorded international RPKs in other regions. Twin-aisle aircraft in service has shown a greater improvement relative to 2019 than ASKs which suggests that aircraft are being returned to service with lower utilisation in anticipation of continued recovery.
New Aircraft Supply
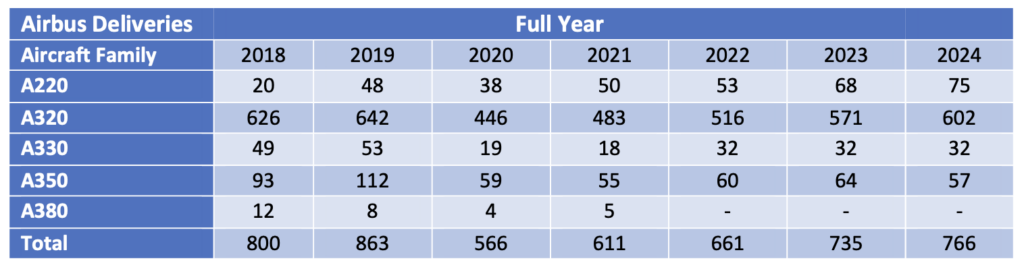
Airbus achieved 766 total deliveries in 2024, very close to its revised target of 770, and is guiding a 7% increase to 820 in 2025. The only change to medium-term production targets by model was a delay of the projected entry into service of the A350 freighter to the second half of 2027. The Airbus CEO Guillaume Faury singled out supply chain problems at Spirit Aerosystems as causing delays in production increases for the A200 and A350.
The status of Airbus’s production plans is:
Boeing’s deliveries fell in 2024 because of the impact of a strike by members of the IAM and the FAA’s oversight of its production processes. Its inventory of B737s produced prior to 2023 fell from 175 to 55, implying that only 145 aircraft were built and delivered in 2024. The B787 inventory decreased from 50 to 25, implying that 26 aircraft were built and delivered in 2024. It is worth noting that these estimates assume that Boeing is using consistent definitions for inventory numbers which may not be accurate. Boeing plans to deliver all aircraft in inventory by the end of 2025.
Boeing has stopped providing official production guidance, so the monthly rates below come in shades of grey. Its long-term target for B737 production is 56 per month but this is clearly several years away. Fitch reports that B737 production is currently running at 20 per month, and the company plans to reach its maximum permitted rate of 38 by the middle of the year with a possible increase to 42 by year end subject to FAA approval. It plans to raise B787 production to 7 per month by the end of 2025 and to 10 by the end of 2026.
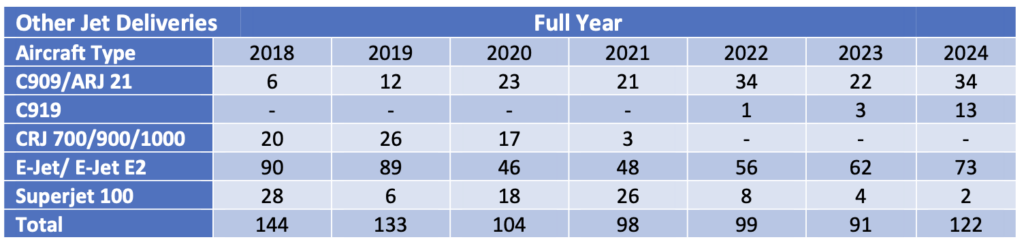
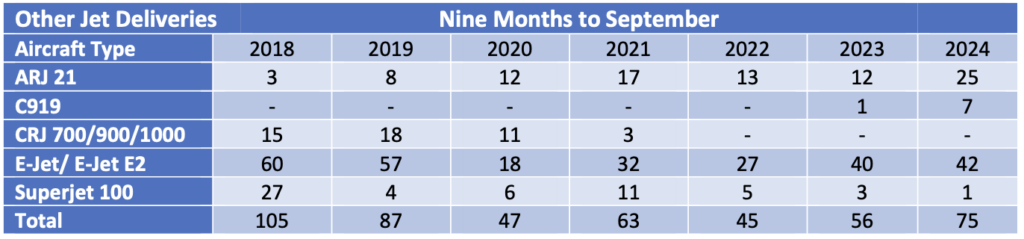
The number of commercial jets delivered by OEMs other than Airbus and Boeing showed a significant increase in 2024 which is likely to continue in 2025. Embraer increased commercial jet deliveries to 73 in 2024 and is guiding total deliveries between 77 and 85 in 2025. COMAC of China achieved a significant increase in C909 (a rebrand of the ARJ 21) and C919 deliveries to a combined 47 aircraft in 2024. Although there is no indication in any change of the current C909 production rate of 3 aircraft per month, company announcements indicate plans to deliver 30 C919s in 2025 and an increase in capacity to 50 aircraft a year.
Airline Industry Financial Performance
Airline shares rallied very strongly from Q3 2024 to catch up with the overall market. This was mainly due to strong performance by the US network airlines (United in particular) on the back of strong premium travel demand and moderating fuel prices. Since January 2025 there has been a sell-off due to the impact of economic uncertainty on the revenue outlook for these operators.
Ironically enough November also saw the largest airline bankruptcy of 2024 when Spirit Airlines filed for Ch. 11. Along with other US low-cost airlines Spirit had suffered from a switch in US passenger demand towards international travel and more effective competition from the large network airlines. It has also had to deal with the need to ground a significant proportion of its fleet due to unscheduled maintenance on its Pratt & Whitney GTF engines. Spirit exited bankruptcy at the beginning of March 2025 having successfully restructured its shareholding structure and some of its bond obligations. It is a measure of the strength of the aircraft market that it did not seek any concessions from its lessors.
The other large airline failure in 2024 occurred when GOL of Brazil filed for US bankruptcy protection in January. This was not a major surprise as GOL’s major competitors Avianca and LATAM had already done so during the pandemic and GOL had engaged in significant financial restructuring in the same timeframe.
[1] The CFM56 is used by both the A320 Ceo and B737NG, whereas the V2500 is only used by the A320 Ceo.
[2] RPKs is the acronym for revenue passenger kilometres, which is the product of the number of paying passengers times distance flown.
[3] ASKs is the acronym for available seat kilometres, which is the product of the number of available seats flown times distance flown.
Disclaimer
This Presentation has been made to you solely for general information purposes and is not intended to provide, and should not be relied upon for legal, tax, accounting, investment, or financial advice. This Presentation is not a sales material and does not constitute or form any part of any offer, invitation or recommendation to the recipient, its affiliates or any other person to underwrite, sell or purchase securities, assets or any other product, nor shall it or any part of it form the basis of, or be relied upon, in any way in connection with any contract or transaction decision relating to any securities, assets or any other product. None of Sirius, its affiliates or shareholders shall have any responsibility or liability to the recipient, its affiliates, shareholders or any third party in relation to this Presentation or any other document or materials prepared by Sirius or its affiliates, officers, directors, employees, advisers, or agents. Sirius and its affiliates, officers, directors, employees, advisers, and agents have taken all reasonable care to ensure that the information contained in this Presentation is accurate. Neither Sirius nor any of its affiliates, officers, directors, employees, advisors, or agents has any obligation to update this Presentation. Under no circumstances should the delivery of this Presentation, irrespective of when it is made, create an implication that there has been no change in the affairs of the entities that are the subject of this Presentation. This Presentation may be updated and amended by a supplement and, where such supplement is prepared, this Presentation will be read and construed with such supplement. The statements herein which contain such terms as "may", "will", "should", "expect", "anticipate", "estimate", "intend", "continue" or "believe" or the negatives thereof or other variations thereon or comparable terminology are forward-looking statements and not historical facts. No representation or warranty, express or implied, is made as to the fairness, accuracy, or completeness of such statements, estimates and projections. The recipient should not place reliance on any forward-looking statements. Neither Sirius nor its affiliates undertake any obligation to update or revise the forward-looking statements contained in this Presentation to reflect events or circumstances occurring after the date of this Presentation or to reflect the occurrence of anticipated events. The information set out in this Presentation has been prepared by Sirius based upon various methodologies and calculations which it believes to be reasonable and appropriate. Past performance cannot be a guide to future performance. In preparing this Presentation, Sirius has relied upon and assumed, without independent verification, the accuracy and completeness of all information available from public sources or which was provided to it or otherwise reviewed by it. This Presentation supersedes and replaces any other information provided by Sirius or its affiliates, officers, directors, employees, advisers, or agents in respect of the content of the Presentation. No information or advice contained in this Presentation shall constitute advice to an existing or prospective investor in respect of his personal position. None of Sirius, its affiliates, or its affiliates’ officers, directors, employees or advisers, connected persons or any other person accepts any liability whatsoever for any loss howsoever arising, directly or indirectly, from this Presentation or its contents.

Industry Update Q3 2024
- Special Topic – Aircraft Leasing Industry Financial Performance
- Macro-Economic Background
- Traffic and Aircraft Demand
- New Aircraft Supply
- Airline Industry Financial Performance
Aircraft Leasing Industry Financial Performance
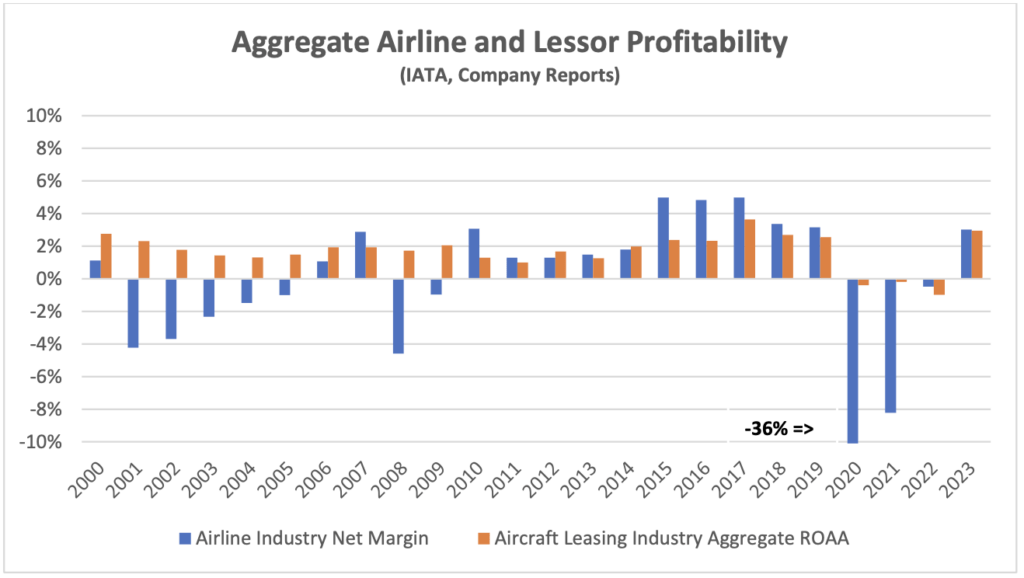
2023 saw a significant improvement in the profitability of the aircraft leasing industry. There were no major asset write-downs such as those incurred because of Covid, and the de facto expropriation of most aircraft leased to Russian airlines in 2022. In fact, several lessors were able to write back some of the latter charges as they received partial insurance settlements. Despite these unprecedented problems the aggregate performance of the industry has been relatively stable, particularly relative to the performance of the airline industry[1].
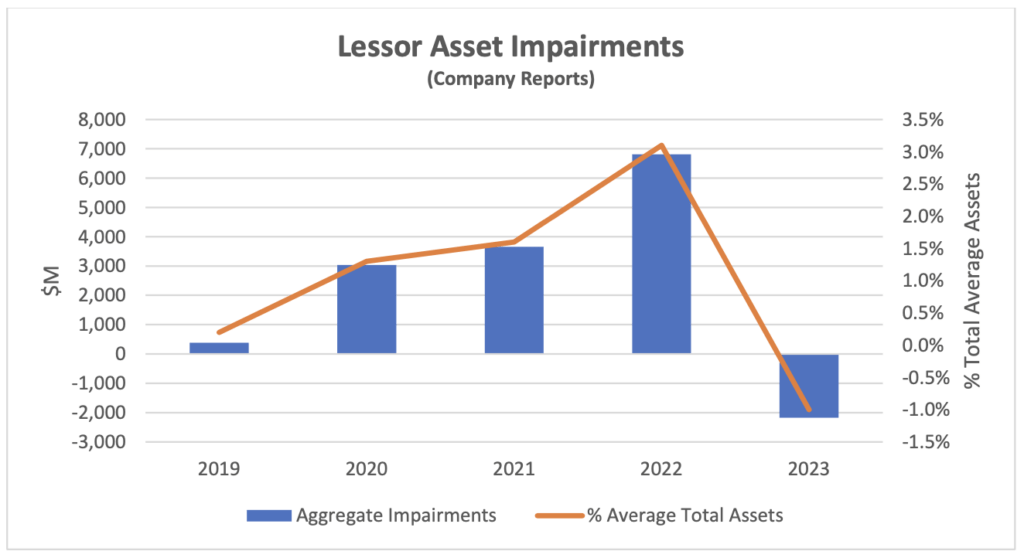
Asset impairments and write-backs have had a huge impact on aggregate industry results since 2020 as shown in the chart below. Insurance settlements in respect of aircraft expropriated by Russia are likely to have a positive impact on results in 2024 and beyond. Most amounts paid to lessors to date have been received from Russian insurers while litigation with western insurers continued. However, AerCap recently settled some of its claims with the latter which may presage more payments. It is a measure of the defensive financial strength of the industry that there has been very little financial distress in this period. Two lessors sought court protection, NAC and Voyager, which both had niche asset strategies based on regional and widebody aircraft respectively. None of the major lessors with more diverse aircraft fleets suffered a credit rating downgrade.
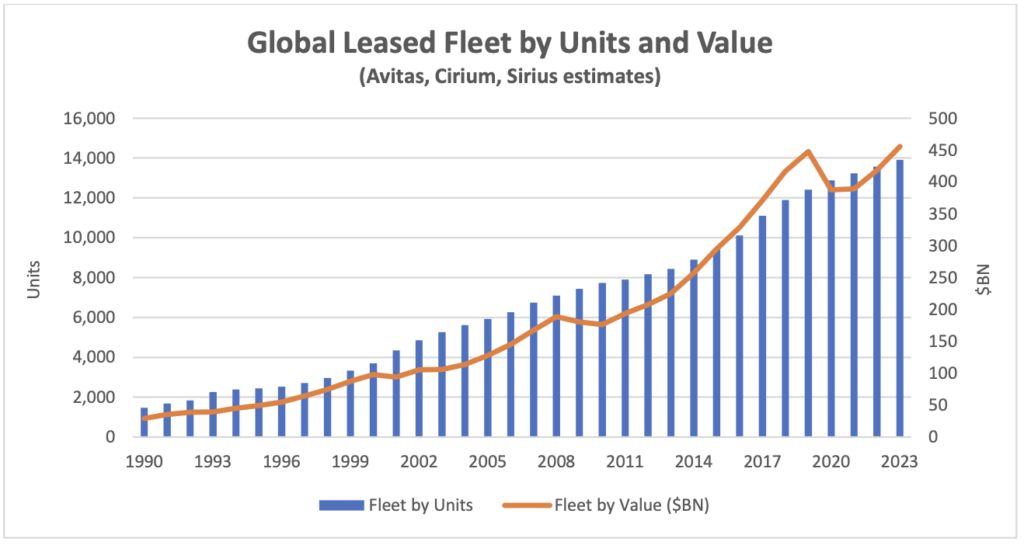
Before we discuss underlying financial performance it’s worth a detour to note some important changes to the industry background for aircraft lessors. First growth in terms of asset value has slowed down. This is mainly due to the disruption of new aircraft deliveries particularly at Boeing which is discussed in more detail below. There has also been some impact from cyclical changes in aircraft values although this has largely worked its way through the system (the chart below uses Avitas Market Values where available). This increases competition between lessors in the new aircraft market as most of them have targets for balance sheet growth although there are fewer deals available.
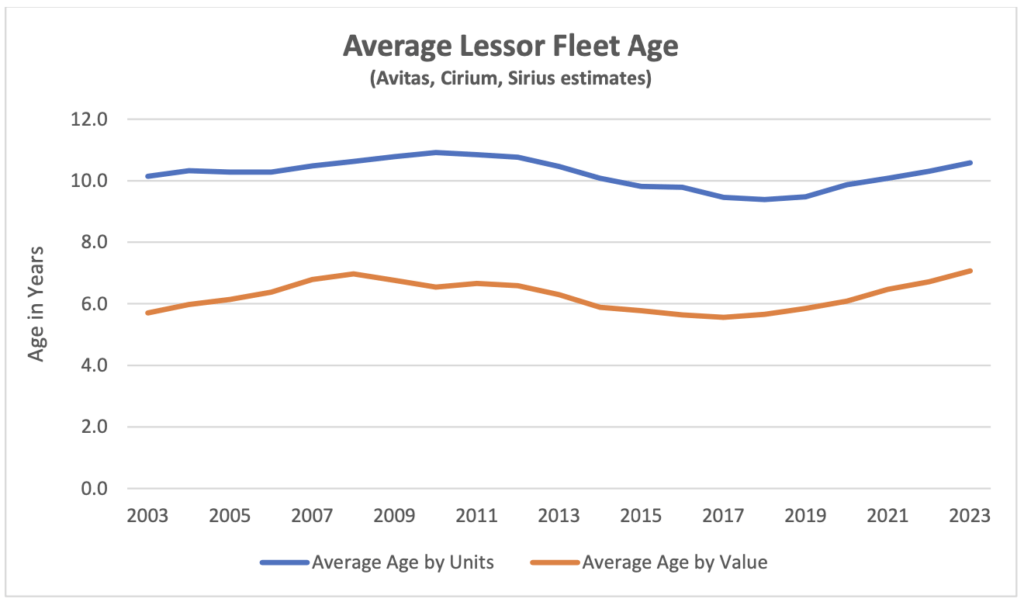
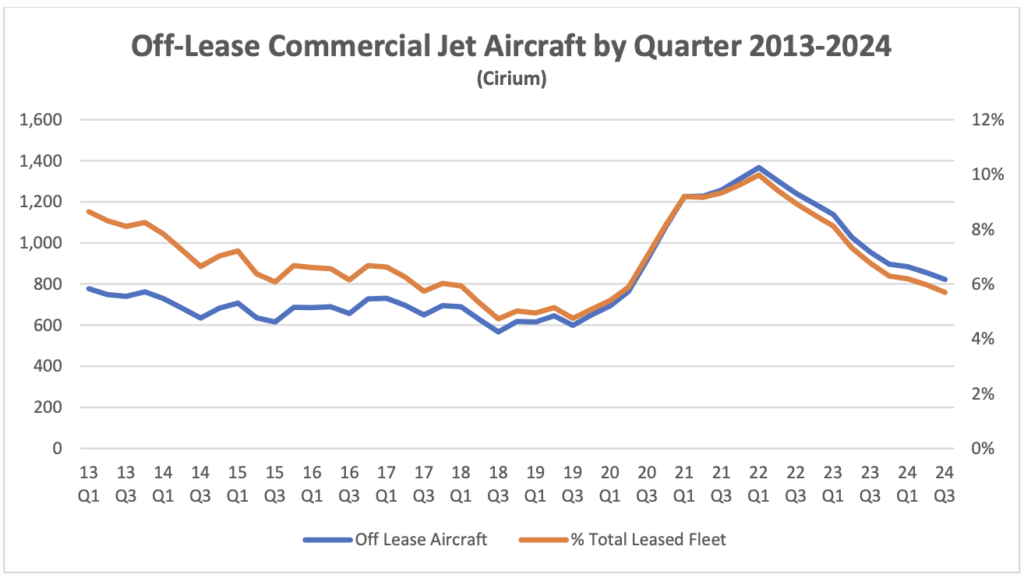
One side effect of the reduced level of new acquisitions is that the lessor fleet is ageing. This matters because an older fleet is likely to have higher levels of off-lease aircraft which may or may not be offset by higher rental income relative to aircraft book value. As the chart below shows age on a unit basis is consistently higher than on a value basis, which is the preferred age metric for analysing lessors. Average age by value is at its highest level in the last 20 years and is likely to increase further given the shortage of new aircraft deliveries.
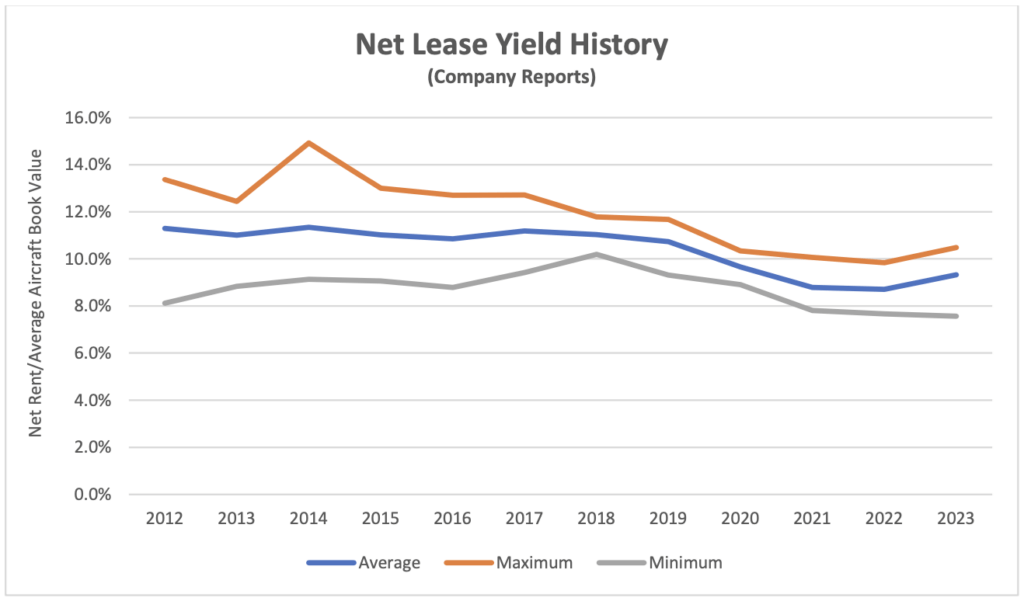
We believe net lease rental yield is a key measure of underlying performance. This ratio is the net rent earned by the lessor excluding maintenance rent etc. as a percentage of average aircraft book value and is analogous to rental yield in commercial property[2]. The chart below shows the range of yields achieved by the group of lessors we follow over the last ten years. This ratio has started to recover after a significant decline since 2019, but it is not a strong recovery as one would expect a higher yield if only because of fleet ageing.
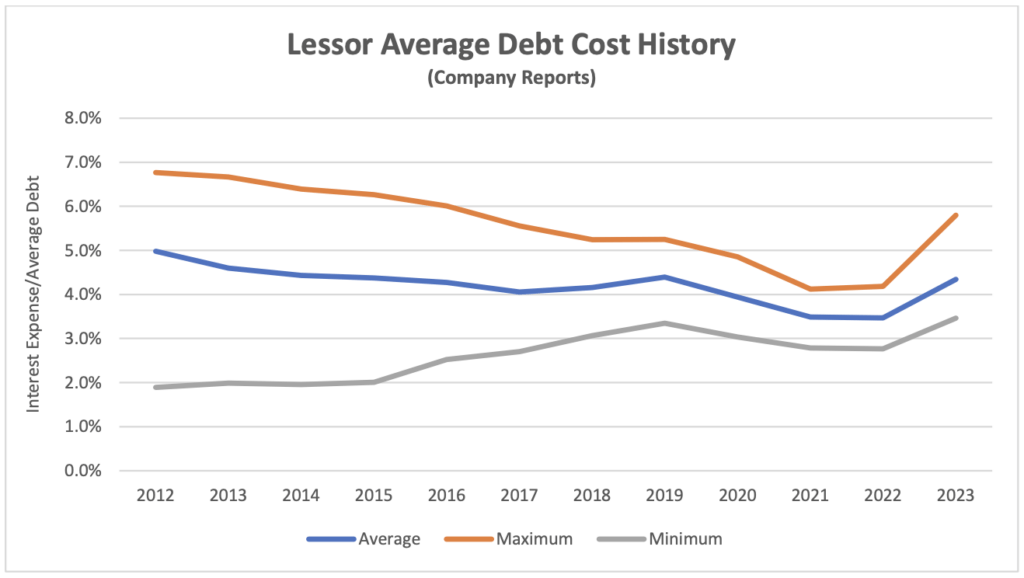
The recovery in yield also needs to be considered in the light of changes in interest costs. Interest expense is a key part of aircraft lessors’ cost of sales - they seek to pass on any increases to their airline customers in higher rents and are likely to pass on decreases by way of lower rents due to competitive pressures. One should not expect changes in interest rates to immediately feed through into aircraft lease rates as the relationship between them is more than a little “sticky” and tends to be hard to identify separately from the impact of changes in aircraft supply and demand. Lessors typically have significant medium-term fixed-rate borrowings to hedge their fixed-rate leases, so their cost of debt is relatively stable. Despite these caveats it would be reasonable to expect a greater increase in rents to have occurred in 2023 given the rise in interest rates and the increased age of the fleet.
The reason for this muted recovery is unlikely to be high levels of off-lease aircraft as these have declined to relatively normal levels after taking into account fleet ageing since 2019. It should be borne in mind that aircraft out of service due to unscheduled engine maintenance remain on lease and accrue rent. It seems plausible that the slow recovery in rental yield is mainly caused by increased competition in the new aircraft market as lessors continue to pursue asset growth.
The level of credit impairments across the industry went negative in 2023, presumably due to reversals of provisions made in prior years. In most cases this is unlikely to be connected to Russian insurance settlements as most identifiable movements relating to these payments have been taken under the asset impairment heading, but there is plenty of scope for recoveries elsewhere.
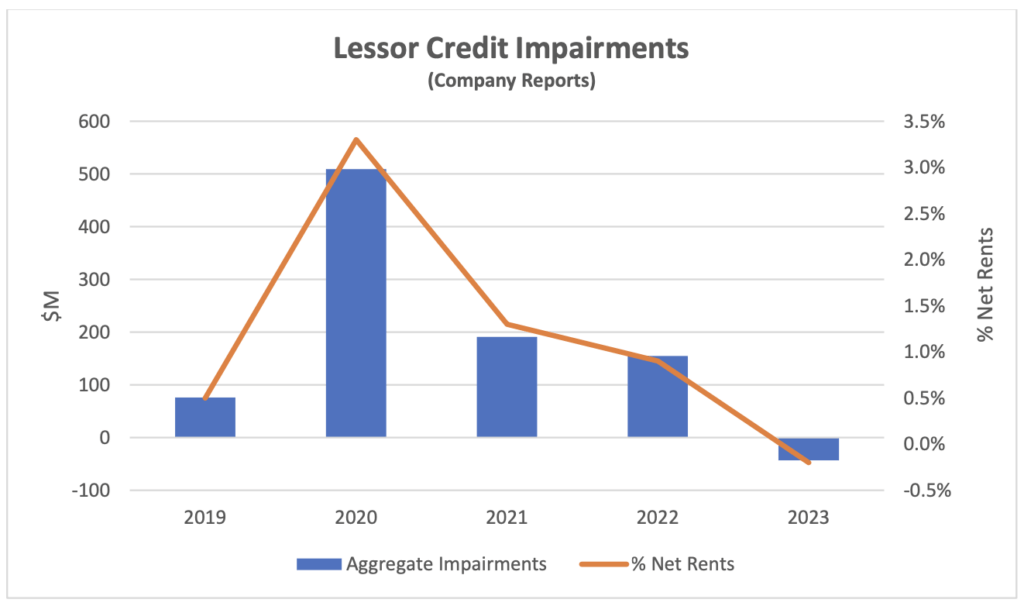
Absent future major shocks we would expect these numbers to remain at low levels in future as was the case before 2020. There are several reasons why this is old and the new normal for the industry. The most important is that early lease termination is a common element of managing a delinquent lessee so rent no longer accrues and therefore does not have to be written off. Lessors are rightly very focussed on the integrity of their assets and associated records so physical possession is more important than “running the meter”, especially with a mobile asset that can be redeployed to earn revenue elsewhere.
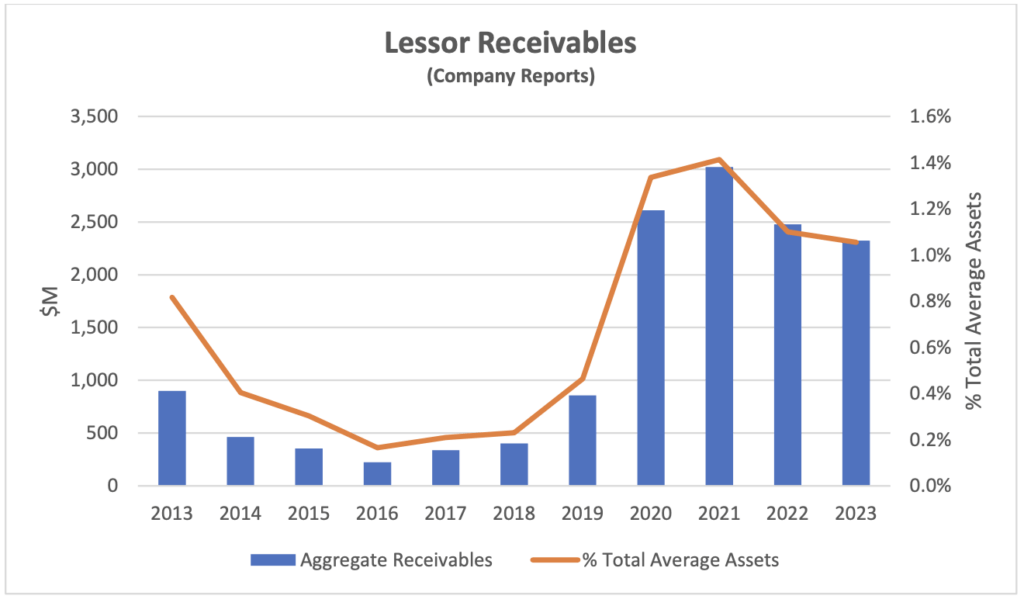
In contrast the level of receivables across the industry remains at a high level compared to 2019. We define receivables broadly and typically include items such as notes receivable as well as overdue rents as the latter often arise when rents are formally rescheduled. At a little over 1% of total assets this does not represent a major threat to the industry but is perhaps surprising given the recovery in airline profitability after 2021. The slow pace of decline is at least partly attributable to new airline restructurings as some lessors have seen an increase in this balance sheet item.
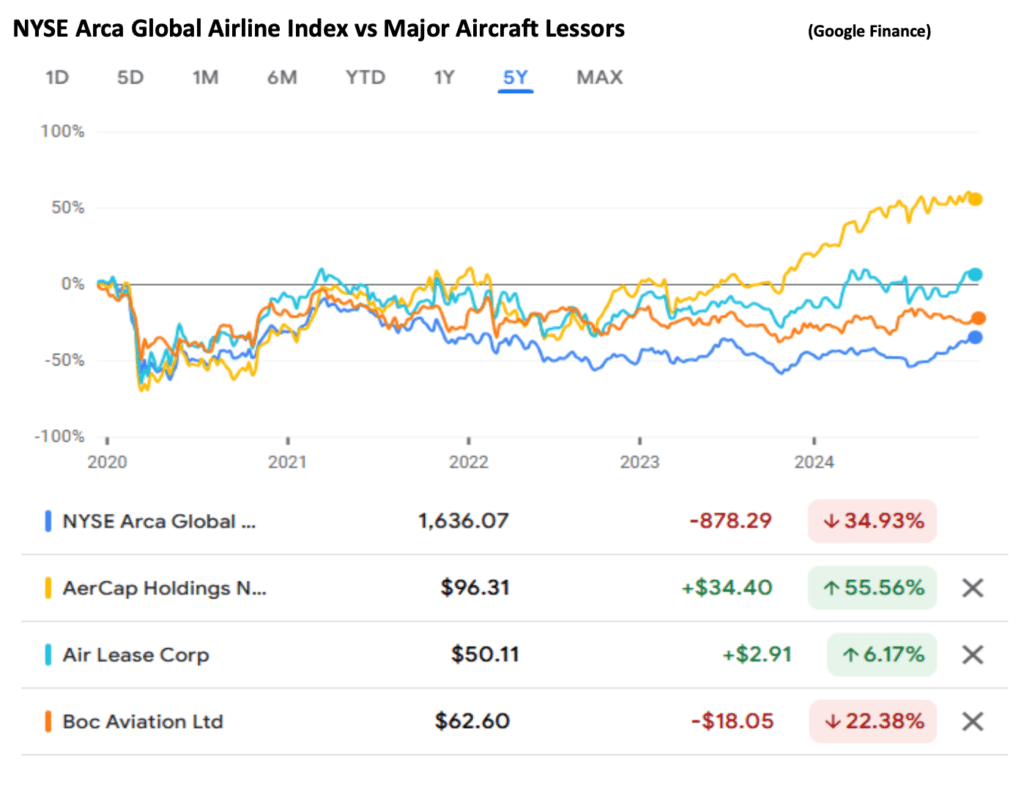
In the long run aircraft lessor stock prices have outperformed most airlines. The chart below compares the performance of the NYSE Arca Global Airline Index with the three largest public aircraft lessors over 5 years. The lessor stocks have significantly outperformed the airline industry during this period which encompasses both the pandemic and Russia’s invasion of the Ukraine.
Amongst the lessors the most notable development is the outperformance of AerCap. It would be easy to attribute this to the acquisition of GECAS, as AerCap’s earlier acquisition of ILFC saw its share price virtually double when the transaction was announced. However, the GECAS acquisition was announced in early 2021 and the outperformance only started in 2023. Another explanation that does not really make sense is business growth as AerCap’s balance sheet has shrunk since 2021 whereas Air Lease and BOC Aviation have both grown.
Where AerCap really differentiates itself from its comps is through its aggressive programme of share repurchases. From 2016 to 2023 AerCap spent nearly $6.5 billion buying back its own shares compared to its 2016 market capitalization of $7.3 billion (its current market capitalization is $18.8 billion). AerCap’s execution of this strategy has been driven by its ability to consistently sell aircraft at a profit, and it has benefitted shareholders as nearly all its share repurchases were at a discount to book value per share. Even now its share price to BV ratio is only a little over 1:1.
Macro-Economic Background
We have mentioned a few times recently that we want to shift the focus of our discussion of world GDP development from a look back to a look forward perspective. Looking back made a lot of sense in the last few years as this kind of data can be subject to major revisions and it was important to capture the overall impact of the pandemic from 2020 through 2024. Any revisions now are very small, so it is time to move on.
The chart below compares the IMF’s forecast for world GDP growth from its October 2024 World Economic Outlook with its three most recent predecessors. The forecast horizon moves forward each year, so it is helpful to create indices that help visualise the rate of change – obviously steeper is better. The 2024 forecast is notably more positive than the previous two years.
Economic growth is a key driver of long-term growth of air travel. However, since early 2022 its impact has been overshadowed by the fall and recovery in traffic associated with the pandemic. In time the influence of overall economic conditions on air travel is likely to reassert itself, but industry forecasts published by Airbus, Boeing and IATA assume much higher rates of traffic growth than GDP growth over the rest of the 2020s as the former catches up to its long-term trend (see our Q1 2024 Industry Update for a more detailed discussion).
The US Dollar has weakened since its recent peak in September 2022, providing relief for airlines outside the US for dollar-denominated costs such as fuel, aircraft rents and aircraft spares. The price of jet fuel has remained volatile, but it has moderated since February 2024. This reduction has mainly been driven by a reduction in the “crack spread” from c.$30 to c.$13.
Another indicator that is potentially important to aircraft investors is the breakeven inflation rate on US Treasury Inflation-Protected Securities (TIPS). This indicator measures inflation expectations and it matters because used aircraft values are strongly influenced by the cost of new aircraft and over time this cost is linked to US Dollar inflation. In the short term this linkage is driven by escalation clauses in aircraft purchase contracts and in the long term by the general input cost environment for the aircraft manufacturers. The chart below compares the breakeven rate for 10-year and 5-year TIPS.
Although medium or long-term inflation expectations have never gone higher than 3.5%, actual inflation experience has been much higher in the last few years. This has led to higher appraised values for new aircraft.
Traffic and Aircraft Demand
Although some short-haul aircraft serve international routes nearly all long-haul aircraft do so, and this is reflected in the relative demand for single-aisle (narrowbody) and twin-aisle (widebody) aircraft. Aircraft demand can be measured in terms of aircraft in service and ASKs, the standard measure of aircraft capacity deployed by airlines which indicates how intensively aircraft are being flown. Single aisle aircraft demand on both metrics is higher so far in 2024 than in 2019 whereas twin-aisle aircraft are marginally weaker by aircraft in service and lagging more in terms of ASKs. The difference between the two metrics may be down to the gradual move away from very large aircraft such as the B747 and A380 towards the smaller B787 and nA350, resulting in fewer ASKs per aircraft unit. It is hard to see the TA 2024 data series because it is only very marginally lower than TA 2019.
Full recovery has yet to be achieved for twin-aisle aircraft, mainly due to weak traffic to and from, and within the Asia-Pacific region. The figures by region in the tables above are based on airline domicile, so weak Europe to Asia traffic reduces recorded international RPKs in other regions. Twin-aisle aircraft in service has shown a greater improvement relative to 2019 than ASKs which suggests that aircraft are being returned to service with lower utilisation in anticipation of continued recovery.
New Aircraft Supply
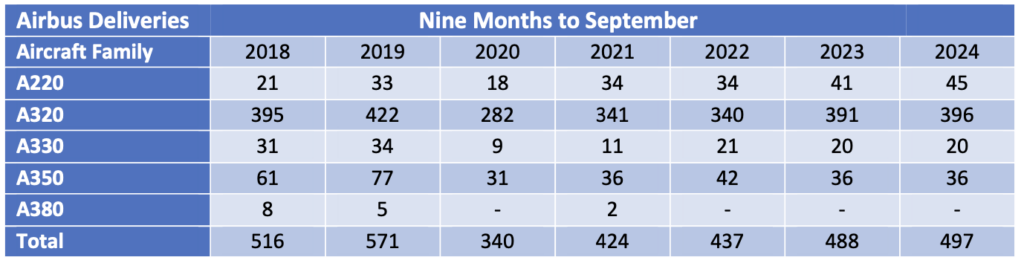
Airbus continues to guide total deliveries for 2024 at 770 commercial jets compared to 735 in 2023 although deliveries for the first nine months were only slightly higher at 497 vs 488. Chief executive Guillaume Faury stated during the 9 months Airbus results announcement that “We are struggling with more pragmatic issues as we speak now in 2024 for reaching the 770 (target)”. Single-aisle engines, cabin equipment and aerostructures are the main supply chain bottlenecks. On a more positive note, the first A321XLR delivered to Iberia at the end of October.
The latest announced status of Airbus’s production plans is:
Previously announced production plans included an interim target for A320 production of 65 per month but this was not mentioned as part of the most recent update. Although actual production rates to date are below current announced production rates Airbus normally delivers most aircraft in the fourth quarter, so they are likely to catch up by year end for most types.

Boeing suffered another disruption to its aircraft production activity when its machinists went on strike in September. There are reports that 737 Max production restarted in early December after the strike was resolved in November, although Boeing has not confirmed this. At the end of Q3 Boeing held an inventory of 60 B737-8 aircraft produced prior to 2023 compared to 175 at the start of the year, plus 35 -7 and -10 variants awaiting certification. B787 production has also been hit by the strike as well as supply chain problems and rework requirements. Inventory reduced from 50 at the start of the year to 30 at the end of Q3. The inventory reductions show that Boeing is struggling to deliver “new build” aircraft so far this year.
Boeing has stopped providing official production guidance. Its long-term target for B737 production is 56 per month but this is clearly several years away, and, in the meantime, production is capped at 38 a month by the FAA until it is happy that the manufacturer has resolved the quality control lapses that caused the door panel of an Alaska Airlines B737-9 to detach in flight last January. Several analysts have written that production will be at very low levels for some time. B787 production will also take time to build back towards Boeing’s target of 5 per month.
Boeing has also pushed back target entry into service dates for its new B777 models with B777-9 EIS now 2026, B777-8F 2028 and B777-8 2030.
The number of commercial jets delivered by OEMs other than Airbus and Boeing remains subdued. COMAC of China achieved a significant increase in ARJ 21 and C919 deliveries and slightly ahead of 2023.
Airline Industry Financial Performance

Airline shares have caught up with the broader stock market with a very strong Q4 so far. This is mainly due to strong performance by the US network airlines (United in particular) on the back of strong premium travel demand and moderating fuel prices.
Ironically enough November also saw the largest airline bankruptcy of 2024 when Spirit Airlines filed for Ch. 11. Along with other US low-cost airlines Spirit has suffered from a switch in US passenger demand towards international travel and more effective competition from the large network airlines. It has also had to deal with the need to ground a significant proportion of its fleet due to unscheduled maintenance on its Pratt & Whitney GTF engines. It reflects the strength of aircraft demand that Spirit management have said their bankruptcy restructuring objectives relate only to their obligations to shareholders and bondholders rather than lessors and other financiers.
The other large airline failure this year occurred when GOL of Brazil filed for US bankruptcy protection in January. This was not a major surprise as GOL’s major competitors Avianca and LATAM had already done so during the pandemic and GOL had engaged in significant financial restructuring in the same timeframe.
[1] Sirius has created the time series of aggregate aircraft leasing industry returns by based on public financial information in respect of the following companies: AerCap, Aircastle, Air Lease Corp., ALAFCO, Aviation Capital Group, Avolon, AWAS, BOC Aviation, CDB Aviation, DAE Capital, Fly Leasing, GECAS, Genesis Lease, ILFC, Intrepid/Voyager, Nordic Aviation Capital and SMBC Aviation Capital. We have excluded NAC from our calculations for 2022 because their net income includes a $2.6 BN gain on restructuring of financial liabilities and some other large one-off items.
[2] For the purposes of calculating net rental yield we include assets such as maintenance rights and lease premiums in aircraft book value as both these items are allocations of amounts paid for used aircraft and their exclusion would inflate net lease yield compared to aircraft bought new. We have excluded ALAFCO and NAC from these calculations
- ALAFCO has been subject to an orderly wind-down in recent years and this has made this ratio very volatile due to the timing of aircraft sales.
- NAC’s bankruptcy involved very substantial aircraft impairments relative to its total aircraft book value which have distorted this ratio.
[3] RPKs is the acronym for revenue passenger kilometres, which is the product of the number of paying passengers times distance flown.
[4] ASKs is the acronym for available seat kilometres, which is the product of the number of available seats flown times distance flown.
Disclaimer
This Presentation has been made to you solely for general information purposes and is not intended to provide, and should not be relied upon for legal, tax, accounting, investment, or financial advice. This Presentation is not a sales material and does not constitute or form any part of any offer, invitation or recommendation to the recipient, its affiliates or any other person to underwrite, sell or purchase securities, assets or any other product, nor shall it or any part of it form the basis of, or be relied upon, in any way in connection with any contract or transaction decision relating to any securities, assets or any other product. None of Sirius, its affiliates or shareholders shall have any responsibility or liability to the recipient, its affiliates, shareholders or any third party in relation to this Presentation or any other document or materials prepared by Sirius or its affiliates, officers, directors, employees, advisers or agents. Sirius and its affiliates, officers, directors, employees, advisers and agents have taken all reasonable care to ensure that the information contained in this Presentation is accurate. Neither Sirius nor any of its affiliates, officers, directors, employees, advisors or agents has any obligation to update this Presentation. Under no circumstances should the delivery of this Presentation, irrespective of when it is made, create an implication that there has been no change in the affairs of the entities that are the subject of this Presentation. This Presentation may be updated and amended by a supplement and, where such supplement is prepared, this Presentation will be read and construed with such supplement. The statements herein which contain such terms as "may", "will", "should", "expect", "anticipate", "estimate", "intend", "continue" or "believe" or the negatives thereof or other variations thereon or comparable terminology are forward-looking statements and not historical facts. No representation or warranty, express or implied, is made as to the fairness, accuracy or completeness of such statements, estimates and projections. The recipient should not place reliance on any forward-looking statements. Neither Sirius nor its affiliates undertakes any obligation to update or revise the forward-looking statements contained in this Presentation to reflect events or circumstances occurring after the date of this Presentation or to reflect the occurrence of anticipated events. The information set out in this Presentation has been prepared by Sirius based upon various methodologies and calculations which it believes to be reasonable and appropriate. Past performance cannot be a guide to future performance. In preparing this Presentation, Sirius has relied upon and assumed, without independent verification, the accuracy and completeness of all information available from public sources or which was provided to it or otherwise reviewed by it. This Presentation supersedes and replaces any other information provided by Sirius or its affiliates, officers, directors, employees, advisers or agents in respect of the content of the Presentation. No information or advice contained in this Presentation shall constitute advice to an existing or prospective investor in respect of his personal position. None of Sirius, its affiliates, its or its affiliates’ officers, directors, employees or advisers, connected persons or any other person accepts any liability whatsoever for any loss howsoever arising, directly or indirectly, from this Presentation or its contents.
Industry Update Q2 2024
- Special Topic – Aircraft Trading Update
- Macro-Economic Environment
- Traffic and Aircraft Demand
- New Aircraft Supply
- Airline Industry Financial Performance
Aircraft Trading Update
It is a cliché to point out that there is no “ticker” in the aircraft market. A result of this lack of transparency relative to some other asset types is the temptation to fall back on anecdotal evidence of market activity, which obviously runs the risk of confirmation bias, groupthink and other distortions.
One source of real data is aircraft lessor financial statements which provides details of aircraft sales revenue and normally units sold as well. The chart below shows aircraft sales revenue for ten companies that could reasonably be classed as “new aircraft lessors”, which is to say that most of the aircraft they acquire are new or nearly new. The only significant exception is AerCap which has grown in part through the acquisition of competitors such as ILFC and GECAS, although these mature businesses were also built on the acquisition of new aircraft.
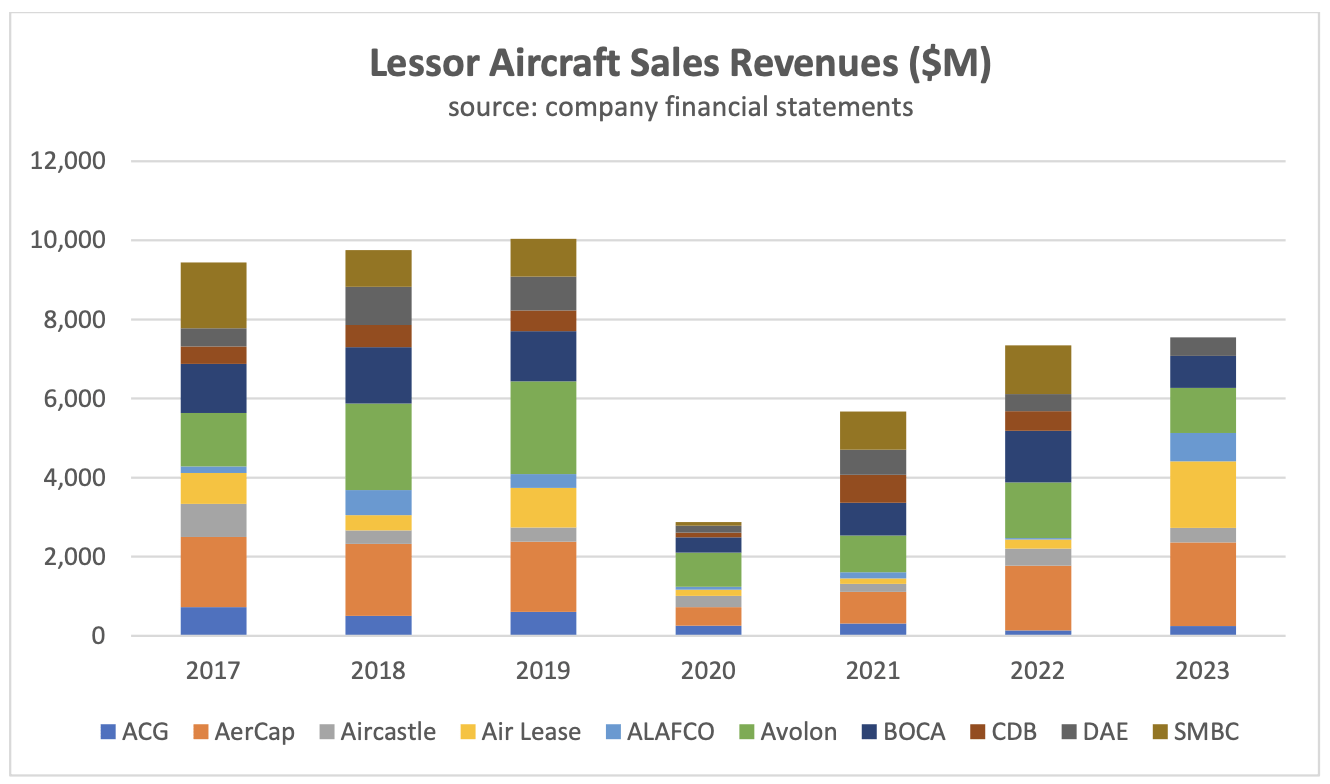
The chart shows the impact of the pandemic on trading activity. The sharp reduction aircraft sales revenues was driven by two key factors:
- A large proportion of the aircraft sold by these lessors are subject to lease and the sales process typically requires lessee (airline) co-operation. In 2020 and 2021 many airlines sought rent deferrals, and it would not have been practical for lessors to seek consent to an aircraft sale whilst simultaneously negotiating a rescheduling.
- Potential buyers of aircraft sought more attractive economics but there was little lessor appetite to sell at a loss, so the market largely failed to clear. None of the lessors featured in the chart suffered any material downgrade to their credit ratings because of the pandemic and they all had large liquidity buffers so they could afford to sit the market out.
The market has gradually recovered since 2020 although it has yet to return to pre-pandemic levels. There is some understatement of activity in 2023 as CDB and SMBC have yet to publish their financials, but this is offset by GECAS trading activity being included as part of AerCap and a large one-off asset sale by ALAFCO.
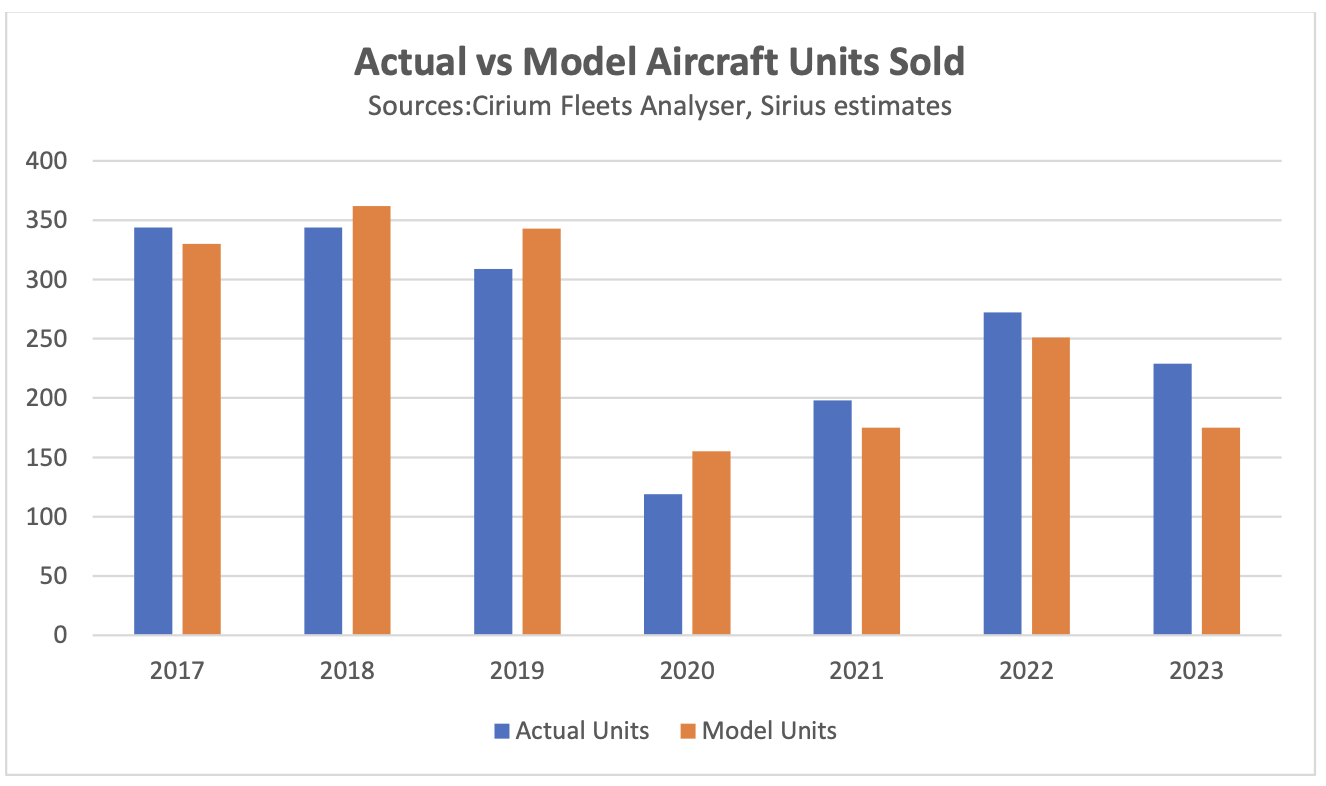
Given the limitations of this approach we thought it might be worth trying to use alternative data sources to get a better sense of the overall market. Our approach was to use data on the number of aircraft trades from Cirium Fleets Analyser combined with historical values from the Avitas Blue Book. There are a lot of reasons why this approach is not going to tie out too closely to the numbers from the financial statements, principally:
- It is challenging for data providers like Cirium to capture which aircraft are owned rather than managed by lessors as many aircraft are held in special-purpose companies which may or may not be owned by the lessor. We have assumed all aircraft managed by a lessor are also owned as we believe this is the “least bad” approach.
- The timing of a sale for accounting purposes may not coincide with the actual transfer of title and there may be delays in making the regulatory filings that allow data providers to identify a transaction.
- Avitas Blue Book values generally assume an aircraft is in a “half-life” maintenance condition whereas real world transactions reflect actual maintenance status and/or the impact of a lease in place.
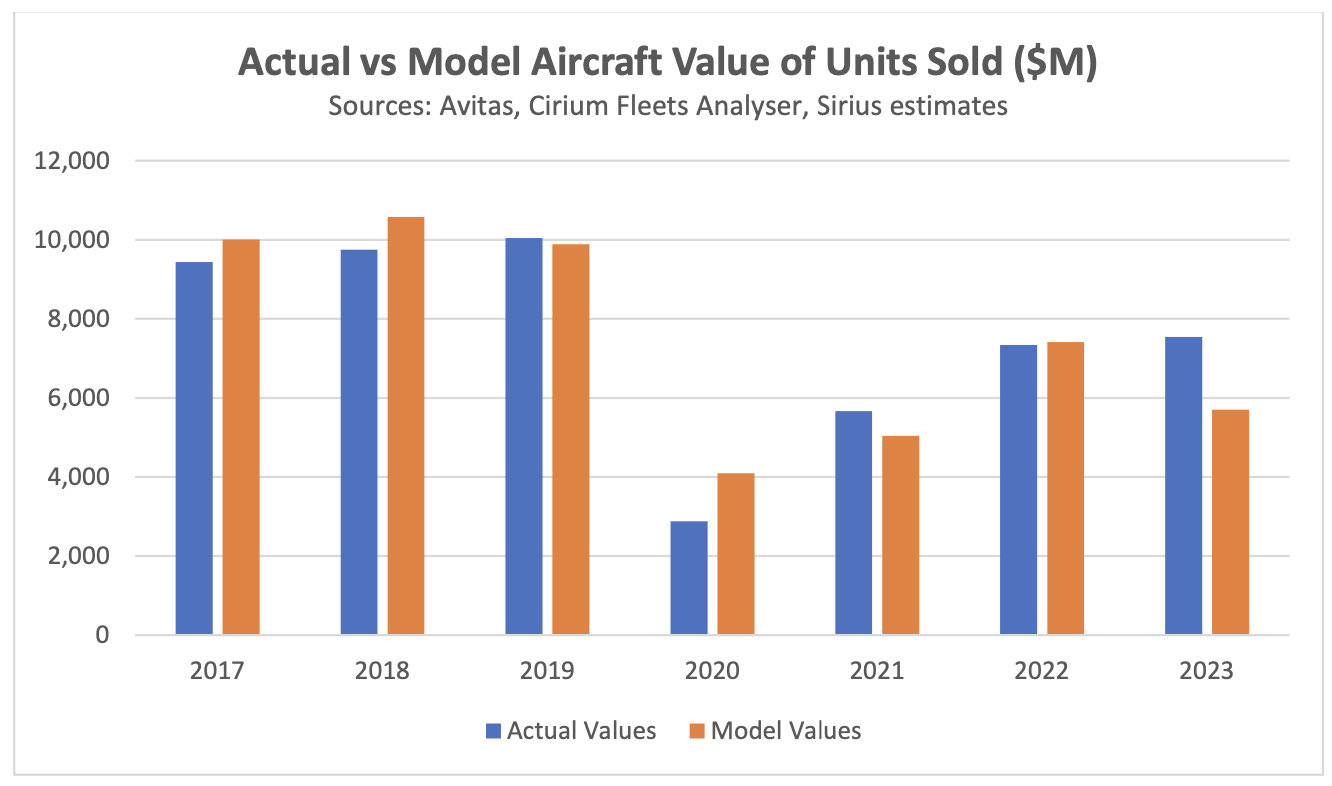
The two charts below compare the “Actual” numbers in the financial statements with the numbers derived from our methodology which we refer to as the “Model” numbers. We have shown these numbers in the aggregate for all ten lessors and on this basis the two approaches tie out reasonably well, although there can be greater divergences at the level of the individual lessor. The relatively big shortfalls in the model vs actual figures by units and value in 2023 may reflect the impact of reporting delays as discussed above.
It seems reasonable to conclude that the Model approach is a reasonable basis for looking at the broader aircraft trading market although it’s probably best considered a guide to the direction of travel rather than an exact record.
The kind of aircraft trading discussed above is a subset of the larger overall aircraft trading market. Cirium classifies aircraft purchases as:
- Purchase (no lease involved)
- Sale and leaseback on delivery
- Sale and leaseback
- Purchase subject to lease
- Securitization
Most of the sales by large lessors consist of aircraft subject to lease or securitizations. We have filtered the securitisation transactions to eliminate those which are financings rather than transfers of economic ownership. This is mainly a function of whether E notes were issued along with senior debt, but we have also researched industry publications and pre-sale reports. We have also eliminated some non-commercial aircraft types and there are some gaps in the value data available, but we still capture c. 90% of transactions overall and our coverage improves to more than 90% over time.
The charts below show historic aircraft trades from 1990 by category, units and value.
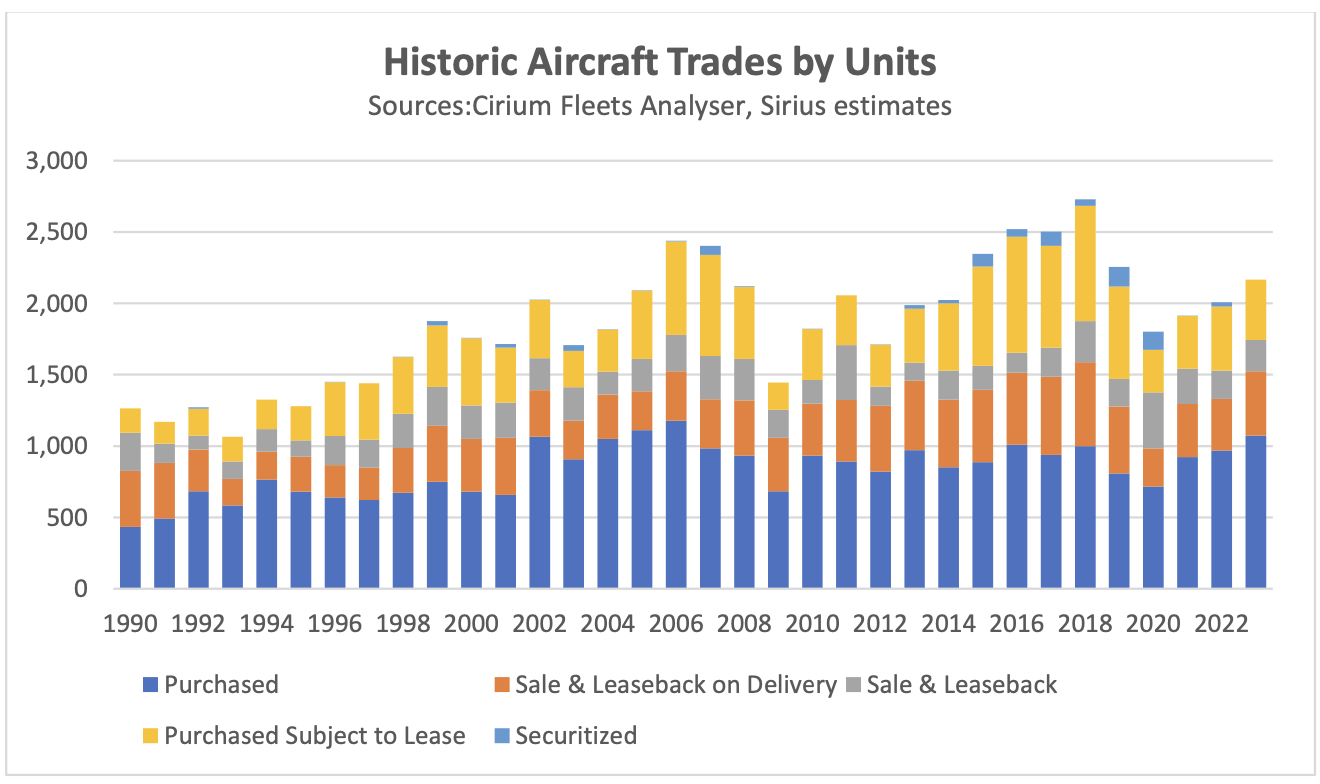
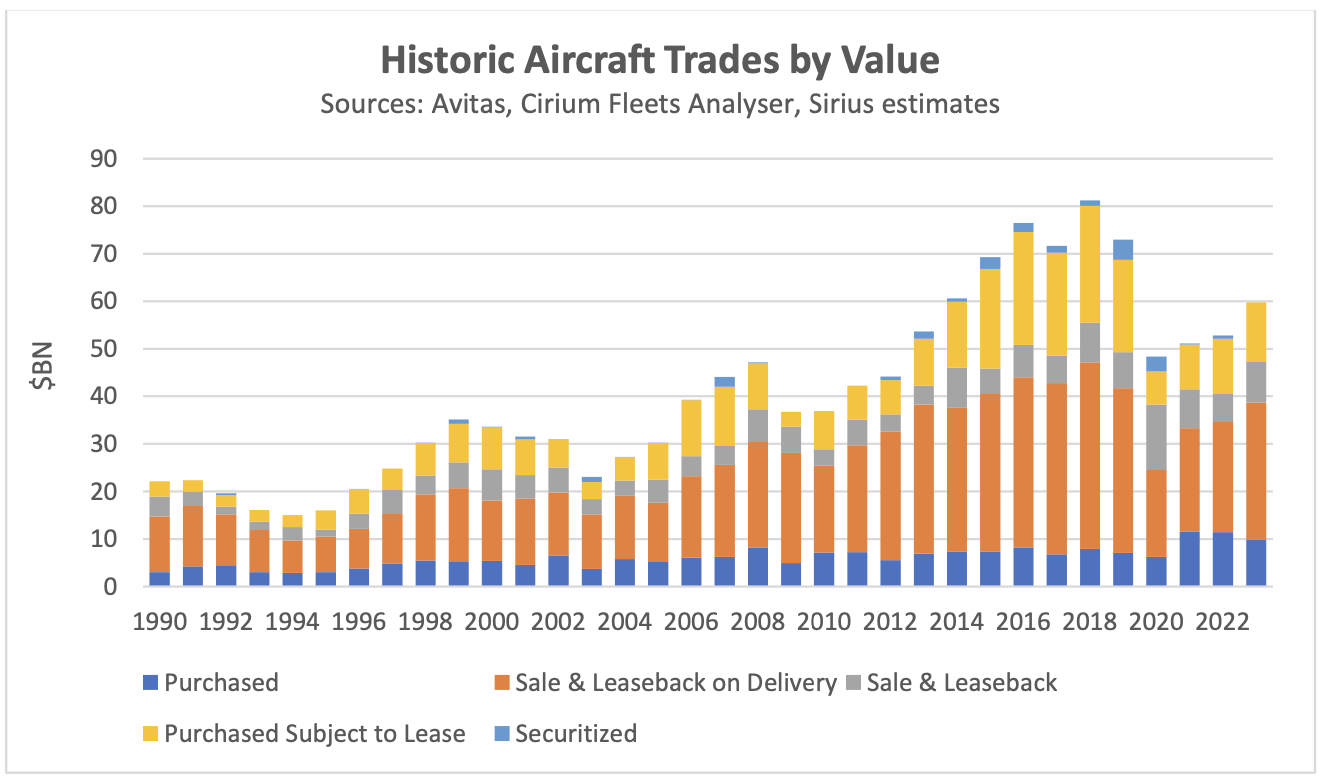
There is a striking difference between market shares for some transaction types based on value and units. Sale and leasebacks on delivery have very high unit values as they involve brand new aircraft and purchases with no lease attached tend to involve older aircraft with correspondingly low values. The other transaction types have relatively similar market shares by both units and value as they generally involve mid-life aircraft.
The transaction participants are mostly the kinds of companies one would expect. Most sellers in all sale-leasebacks are airlines and the buyers are financiers, principally operating lessors. Most sellers and buyers of aircraft subject to lease are operating lessors and in securitizations the sellers are typically operating lessors and the buyers special purpose companies.
Purchases with no lease attached are more varied. Airlines account for between 40% and 45% of sellers by units and value but only c. 30% of buyers. Financiers including lessors account for 50% to 60% of sellers and buyers by both units and value, and the lower airline share of purchases is made up of a mixture of non-airline aircraft operators (air taxi, military etc.) and MROs.
A key conclusion from this analysis is that the market for used aircraft trades is much larger than implied by an analysis based only on the financial statements of major lessors. Our final chart compares the overall market by value with this sub-set. This is true even if one excludes purchases without a lease and sale-leasebacks of used aircraft which are not a significant part of the large lessors’ sales offering.
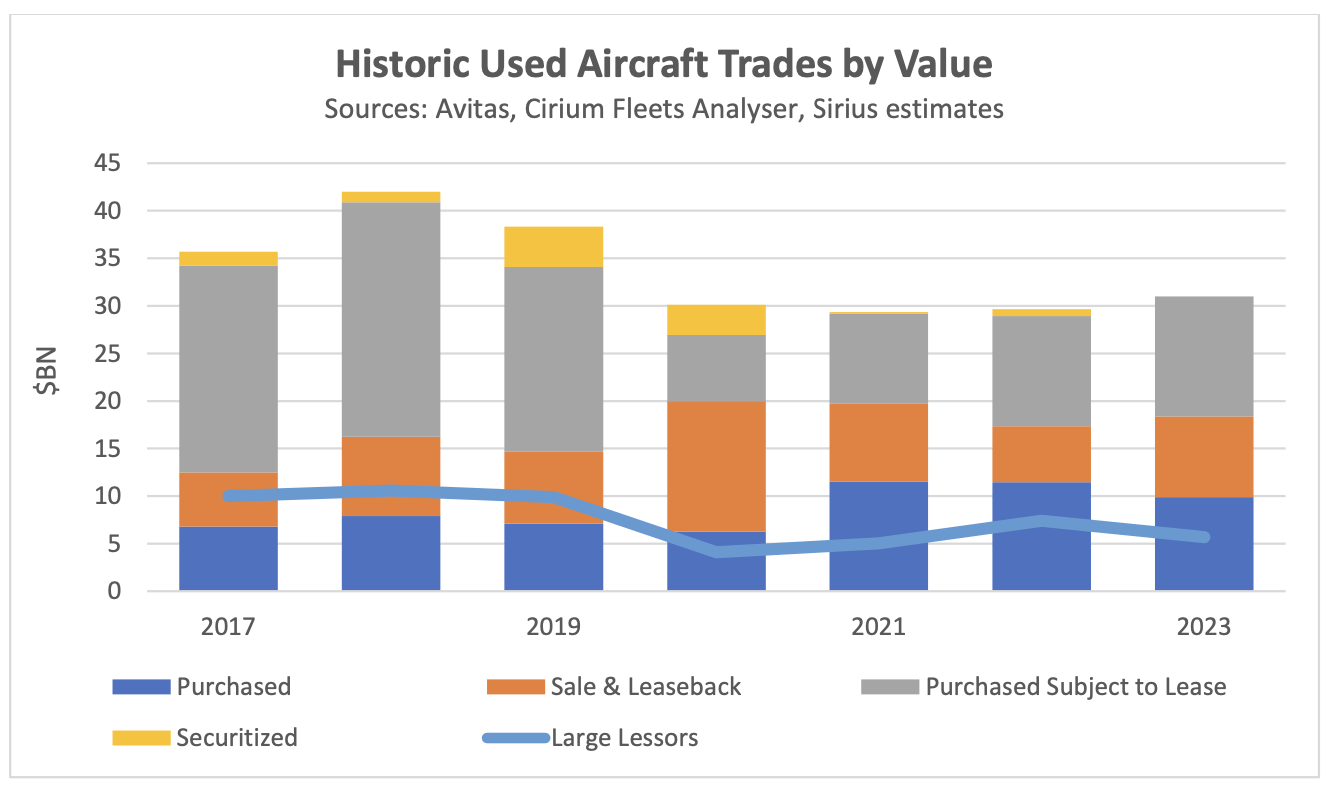
It is also clear that the cyclicality in the trading activity of large lessors is also present in the overall market, although the reasons for lower trading activity in downturns may not be the same for other market participants.
Macro-Economic Environment
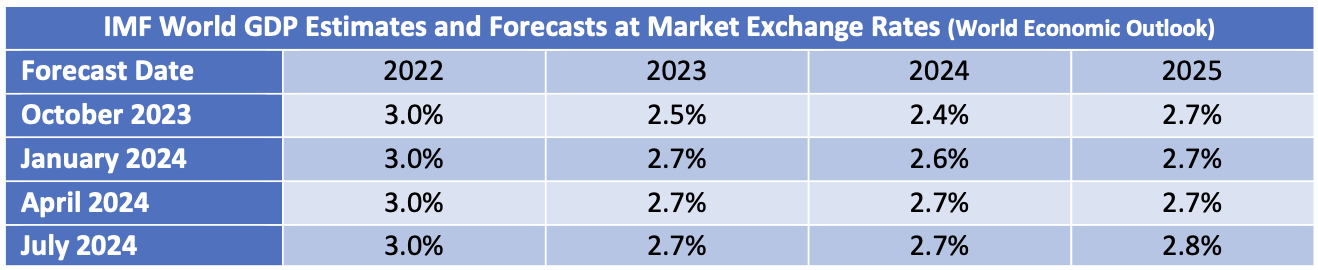
As we discussed in our Q1 2024 industry update we have changed our GDP focus from the retrospective amount of damage done by the pandemic to looking forwards. The IMF has gradually been taking a more optimistic view with its latest 2024 projection at 2.7% vs 2.4% only nine months ago.
Economic growth is a key driver of long-term growth of air travel. However, since early 2022 its impact has been overshadowed by the fall and recovery in traffic associated with the pandemic. In time the influence of overall economic conditions on air travel is likely to reassert itself, but industry forecasts published by Airbus, Boeing and IATA assume much higher rates of traffic growth than GDP growth over the rest of the 2020s as the former catches up to its long-term trend (see our Q1 2024 Industry Update for a more detailed discussion).
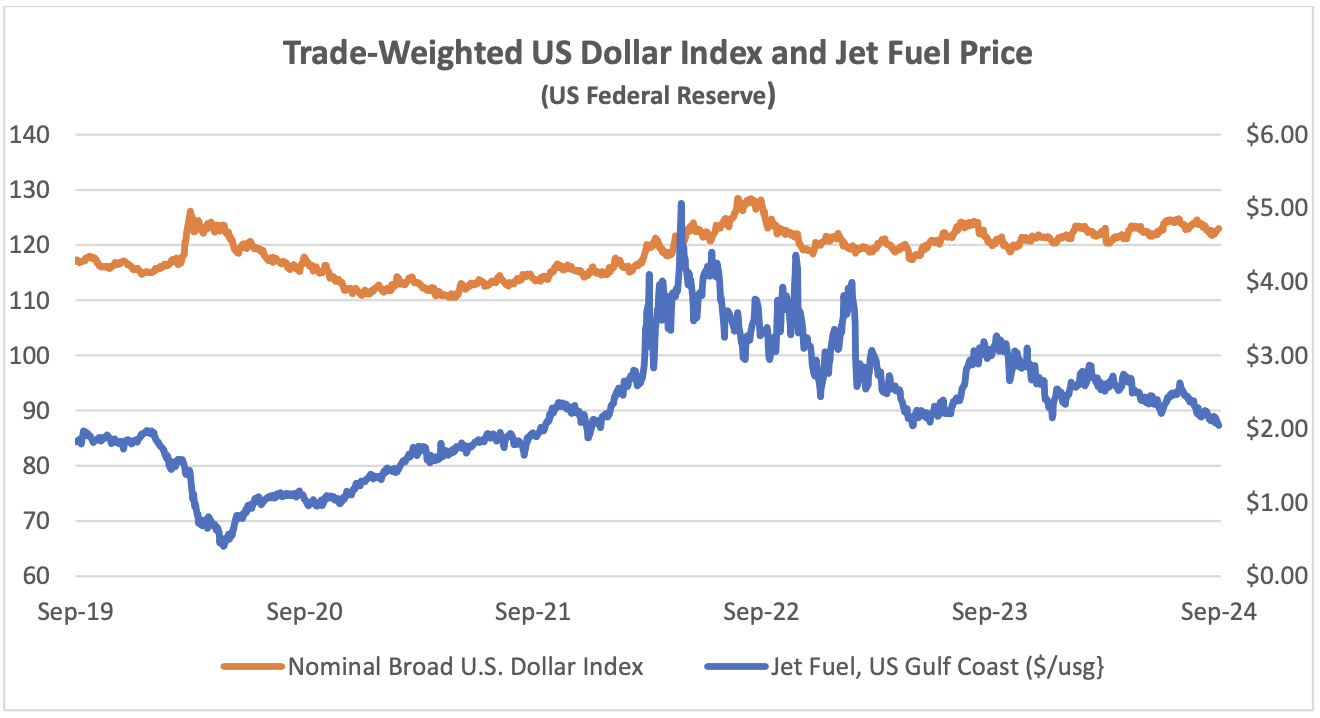
The US Dollar has weakened since its recent peak in September 2022, providing relief for airlines outside the US for dollar-denominated costs such as fuel, aircraft rents and aircraft spares. The price of jet fuel has remained volatile, but it has moderated since February 2024. This reduction has mainly been driven by a reduction in the “crack spread” from c.$30 to c.$12.
Another indicator that is potentially important to aircraft investors is the breakeven inflation rate on US Treasury Inflation-Protected Securities (TIPS). This indicator measures inflation expectations and it matters because used aircraft values are strongly influenced by the cost of new aircraft and over time this cost is linked to US Dollar inflation. In the short term this linkage is driven by escalation clauses in aircraft purchase contracts and in the long term by the general input cost environment for the aircraft manufacturers. The chart below compares the breakeven rate for 10-year and 5-year TIPS.
Although medium or long-term inflation expectations have never gone higher than 3.5%, actual inflation experience has been much higher in the last few years. This has led to higher appraised values for new aircraft.
Traffic and Aircraft Demand
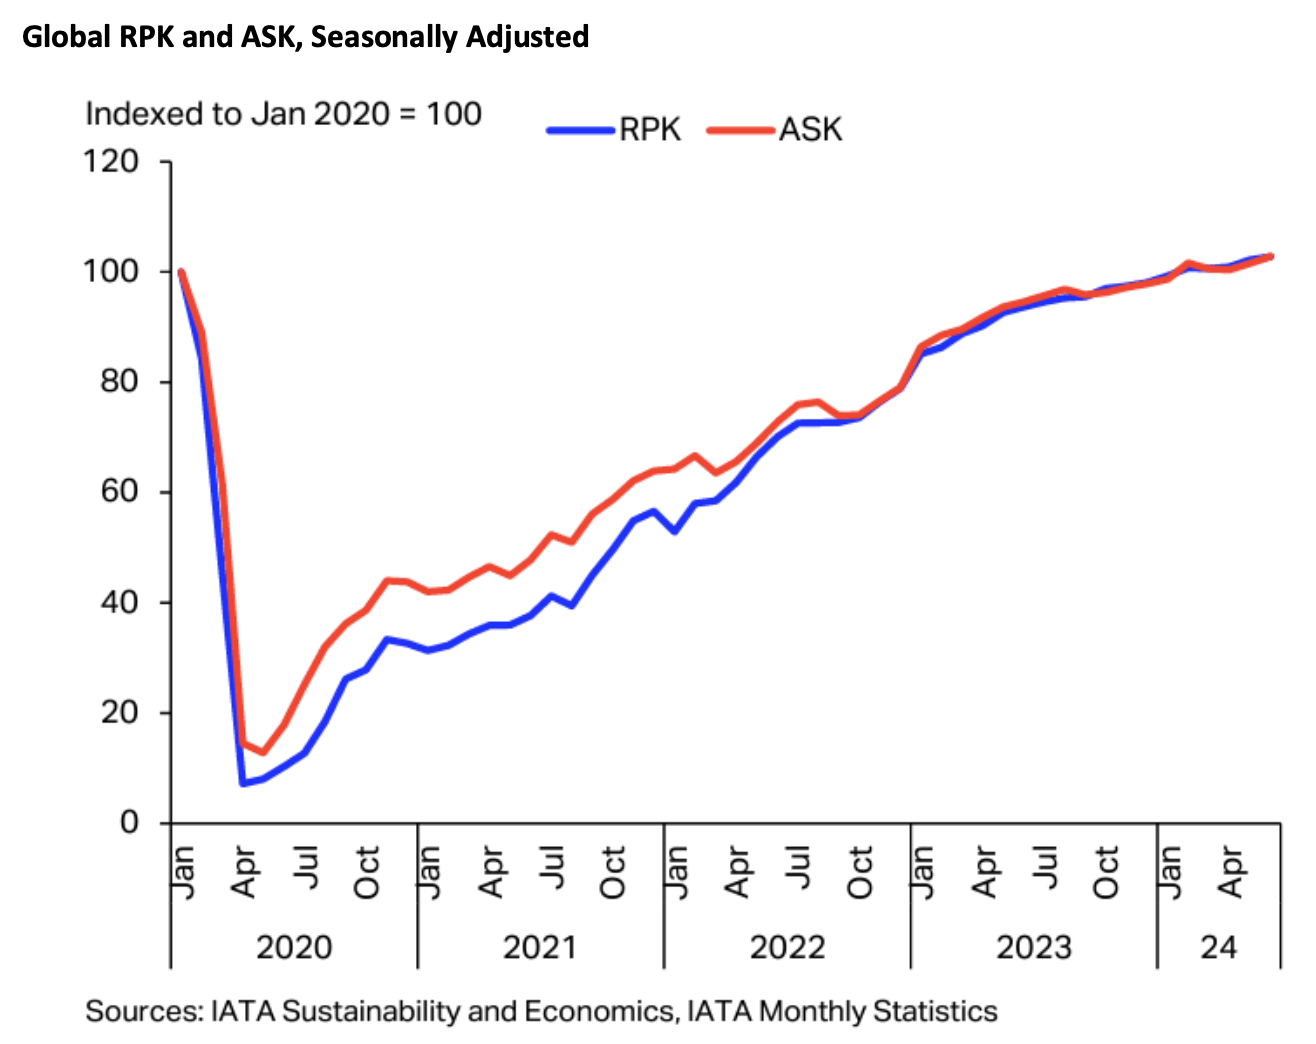
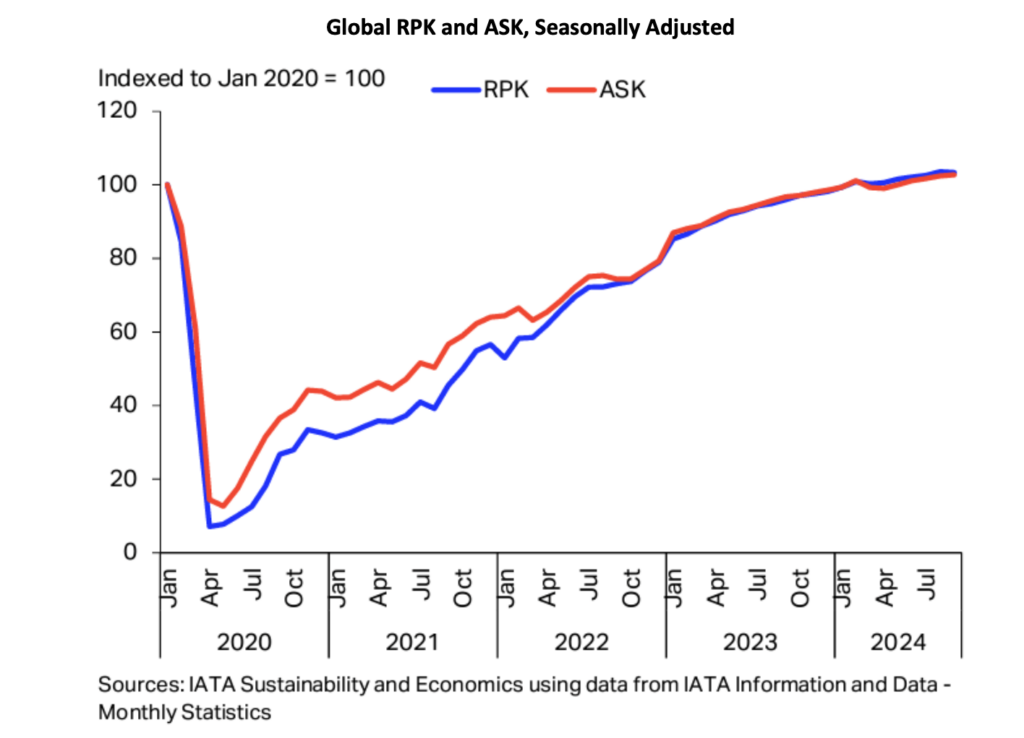
The IATA chart reproduced above looks like those included in previous industry updates but is in fact quite different. Previously it included actual and seasonally adjusted RPKs and now it has both seasonally adjusted RPKs[1] and ASKs[2] indexed to January 2020. For those of us who are not very interested in seasonal adjustments this new version has the benefit of capturing changes in load factors over time and shows that the load factor recovery was complete by the end of 2022.
March 2024 RPKs were 0.1% higher than in March 2019, so recovery is official! Also, no region was more than 5% higher or lower than in 2019 so most of the extreme disparities in terms of recovery have worked their way out of the system.
International traffic recovery still lags domestic and shows greater variation by region, with Asia-Pacific conspicuously weaker than in 2019 and North America much stronger. It is striking that North American international RPKs are 11.0% higher than in 2019 vs only a 1.5% increase for domestic US RPKs: domestic traffic across the Americas was the quickest major market to recover after 2020 so it is tempting to assume that all is well, but markets such as the US are relatively mature limiting long-term growth potential.
The key markets driving domestic traffic volumes growth are China and India which as emerging markets with very large populations are vital to the aviation industry long-run fortunes.
Although some short-haul aircraft serve international routes nearly all long-haul aircraft do so, and this is reflected in the relative demand for single-aisle (narrowbody) and twin-aisle (widebody) aircraft. Aircraft demand can be measured in terms of aircraft in service and ASKs, the standard measure of aircraft capacity deployed by airlines which indicates how intensively aircraft are being flown. Single aisle aircraft demand on both metrics is higher so far in 2024 than in 2019 whereas twin-aisle aircraft are marginally weaker by aircraft in service and lagging more in terms of ASKs. The difference between the two metrics may be down to the gradual move away from very large aircraft such as the B747 and A380 towards the smaller B787 and nA350, resulting in fewer ASKs per aircraft unit.
It is hard to see the TA 2024 data series because it is only very marginally lower than TA 2019.
New Aircraft Supply
Supply chain issues continue to constrain Airbus’ ability to increase production and deliveries remain below their 2019 peak. It has revised down its delivery guidance for 2024 from 800 to 770. The latest status of Airbus’s production plans is:
The target date for increasing the A220 rate to 14 has slipped from 2025 to 2026. The only significant production targets not captured in the table above is the objective to raise A320 family production to 75 per month by 2027 (previously 2026) and to increase A350 production to 12 per month by 2028.
The latest status of Boeing’s production plans is:
The Alaska Airlines B737-9 incident in January has once again created significant uncertainty around Boeing’s ability to increase production of the Max. The FAA is investigating Boeing’s quality control systems and other related matters and has announced that it will not approve any increases in production until it is satisfied with Boeing’s level of compliance. Boeing has also announced that it will not seek certification of the B737-7 and -10 variants until it has engineering solutions for the engine inlet overheating issue resulting from extended engine anti-Ice operation in dry air. There is no definite timeframe to resolve this issue.
B737 inventory decreased from 110 at the end of Q1 to 90 at the end of Q2, including 65 B737-8 aircraft due to be delivered to Chinese airlines (these numbers above only include aircraft manufactured before the start of 2024). Inventory reduction accounted for 20 of 70 aircraft delivered in Q2 2024 compared to 65 of 67 in Q1 which suggests Boeing are making progress, although Boeing do not disclose how many aircraft manufactured in 2024 are in inventory.
As with the Max Boeing holds a significant inventory of undelivered B787 aircraft, c.40 at the end of Q1 vs c.50 at the end of 2023. Boeing has said it expects to deliver most of them in 2024. The inventory reduction of 10 aircraft compares with 13 total deliveries, suggesting that both B737 and B787 production is being severely disrupted. Boeing has not provided any delivery guidance for 2024.
COMAC of China achieved a significant increase in ARJ 21 deliveries and Embraer was in line with 2023.
Airline Industry Financial Performance
There has been some recovery in airline share prices since the summer which is most reasonably explained by lower fuel prices.
GOL of Brazil files for US bankruptcy protection in January. This was not a major surprise as GOL’s major competitors Avianca and LATAM had already done so during the pandemic and GOL had engaged in significant financial restructuring in the same timeframe.
The second largest airline by equipment value to fail is Lynx Air of Canada with a fleet including 9 X B373-8s. Lynx filed for bankruptcy protection in February, citing rising operating costs, high fuel prices, increasing airport charges, and a difficult economic and regulatory environment. Lynx was a low-cost airline that started operations in 2022 and some or all its problems are shared by most low-cost North American carriers up to and including Southwest Airlines, which have not benefitted from the strength of North American international traffic in the same way as the network airlines.
Sometimes airline financial distress comes in shades of grey rather than black and white. Although Pacific Airlines has ceased operations it has declared its intention to restart, and SpiceJet of India (43 aircraft) has suffered several adverse court judgments although it remains in business.
[1] RPKs is the acronym for revenue passenger kilometres, which is the product of the number of paying passengers and distance flown.
[2] ASKs is the acronym for available seat kilometres, which is the product of the number of available seats flown and distance flown.
Disclaimer
This Presentation has been made to you solely for general information purposes and is not intended to provide, and should not be relied upon for legal, tax, accounting, investment, or financial advice. This Presentation is not a sales material and does not constitute or form any part of any offer, invitation or recommendation to the recipient, its affiliates or any other person to underwrite, sell or purchase securities, assets or any other product, nor shall it or any part of it form the basis of, or be relied upon, in any way in connection with any contract or transaction decision relating to any securities, assets or any other product. None of Sirius, its affiliates or shareholders shall have any responsibility or liability to the recipient, its affiliates, shareholders or any third party in relation to this Presentation or any other document or materials prepared by Sirius or its affiliates, officers, directors, employees, advisers or agents. Sirius and its affiliates, officers, directors, employees, advisers and agents have taken all reasonable care to ensure that the information contained in this Presentation is accurate. Neither Sirius nor any of its affiliates, officers, directors, employees, advisors or agents has any obligation to update this Presentation. Under no circumstances should the delivery of this Presentation, irrespective of when it is made, create an implication that there has been no change in the affairs of the entities that are the subject of this Presentation. This Presentation may be updated and amended by a supplement and, where such supplement is prepared, this Presentation will be read and construed with such supplement. The statements herein which contain such terms as "may", "will", "should", "expect", "anticipate", "estimate", "intend", "continue" or "believe" or the negatives thereof or other variations thereon or comparable terminology are forward-looking statements and not historical facts. No representation or warranty, express or implied, is made as to the fairness, accuracy or completeness of such statements, estimates and projections. The recipient should not place reliance on any forward-looking statements. Neither Sirius nor its affiliates undertakes any obligation to update or revise the forward-looking statements contained in this Presentation to reflect events or circumstances occurring after the date of this Presentation or to reflect the occurrence of anticipated events. The information set out in this Presentation has been prepared by Sirius based upon various methodologies and calculations which it believes to be reasonable and appropriate. Past performance cannot be a guide to future performance. In preparing this Presentation, Sirius has relied upon and assumed, without independent verification, the accuracy and completeness of all information available from public sources or which was provided to it or otherwise reviewed by it. This Presentation supersedes and replaces any other information provided by Sirius or its affiliates, officers, directors, employees, advisers or agents in respect of the content of the Presentation. No information or advice contained in this Presentation shall constitute advice to an existing or prospective investor in respect of his personal position. None of Sirius, its affiliates, its or its affiliates’ officers, directors, employees or advisers, connected persons or any other person accepts any liability whatsoever for any loss howsoever arising, directly or indirectly, from this Presentation or its contents.

Industry Update Q1 2024
- Special Topic - Traffic Growth Outlook
- Macro-Economic Background
- Traffic and Aircraft Demand
- New Aircraft Supply
- Airline Industry Financial Performance
Traffic Growth Outlook
As discussed below the industry has recovered, if we are happy to define recovery as traffic exceeding 2019 levels. However, this does beg the question of whether 2019 traffic is the appropriate benchmark for recovery.
When the pandemic hit both Airbus and Boeing made significant adjustments to their annual 20-year industry forecasts. In the chart below we compare Boeing’s forecast of global RPKs[1] in 2038 published in 2019 with our estimates of the comparable number for forecasts published in subsequent years (we estimate the figures for the following years by interpolating between Boeing’s 10 and 20 RPK forecasts). Boeing’s forecast effectively reduced by 10% after the onset of the pandemic and has stayed there since. Our analysis of the comparable Airbus forecasts suggest they did something very similar, but presenting this would require a lot more estimates on our part and we prefer not to go there.
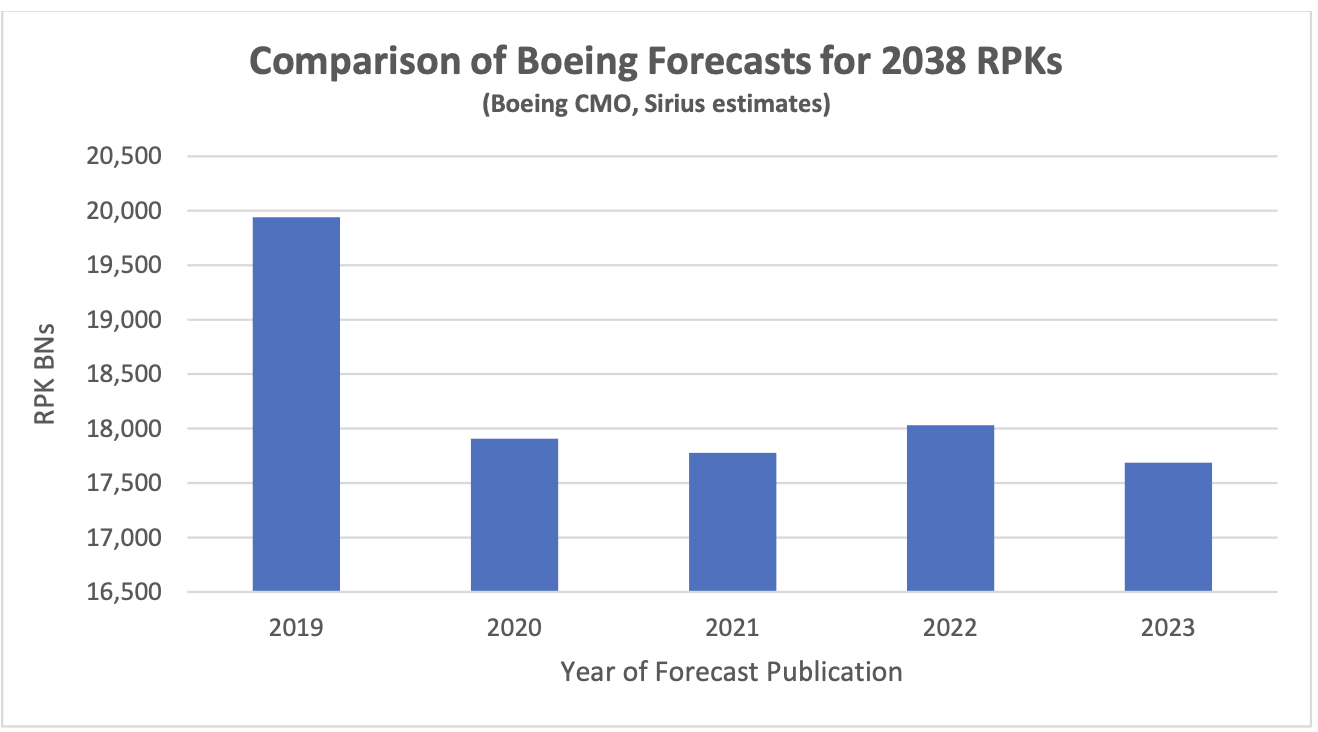
A 10% reduction in long-term RPK growth is a lot more than would be justified by the 2.0-2.5% reduction in world GDP growth caused by the pandemic as the historic RPK/GDP growth multiple is less than 2X. One possible justification for a more conservative approach is that traffic growth was very strong in the latter years of the 2010s so that basing a forecast on cyclical high point would be biased upwards. However, this would not necessarily be correct if this high growth period was partly or wholly offsetting an earlier period of low growth.
A more systematic approach is to create a model of RPK growth which can compare actual with expected RPKs. An analysis of historic traffic data in “normal” times shows that world GDP growth and changes in the real cost of air travel, as measured by constant $ yield[2], provide a very strong explanation of growth in RPKs (a regression analysis on this data for the period 1970-2019 gives an adjusted R-squared of 0.998).
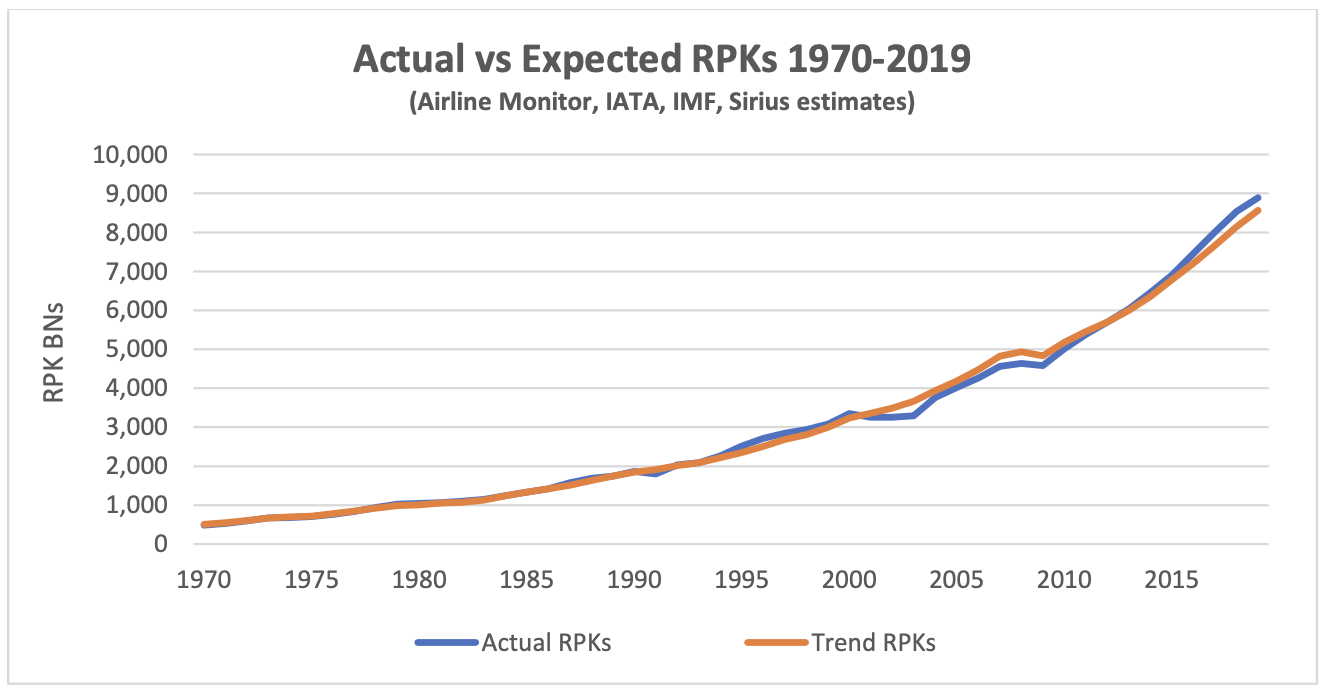
This analysis shows that RPKs were indeed above trend in the 2010s. This was not unprecedented as there was a similar phenomenon in the late 1990s, and it is also striking to note the prolonged period of weak growth in the 2000s.
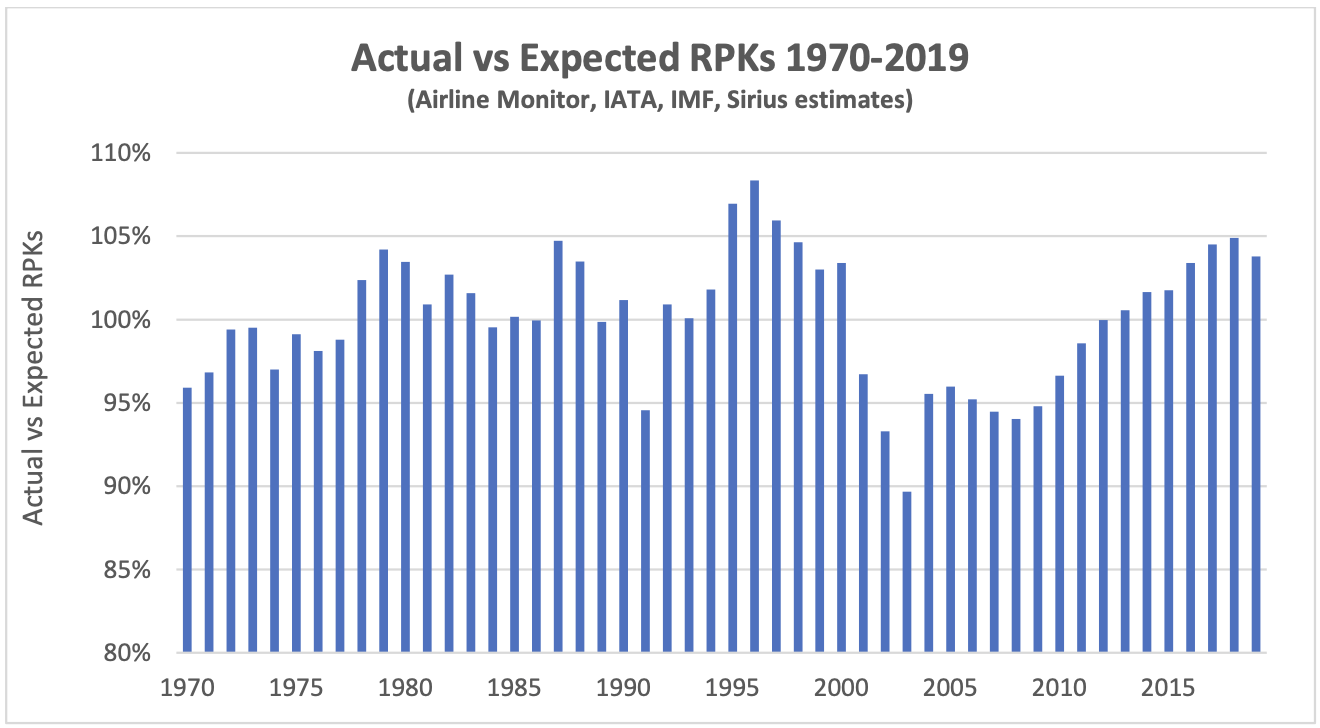
Another way of looking at same data is to chart the ratio of actual to expected RPKs as in the chart below. This demonstrates that the strong traffic levels of the 2010s were in line with previous up-cycles. Based on this analysis the reduction in the OEMs RPK forecasts is reasonable. In 2019 actual RPKs were 4% above trend and there is a case for a 4-5% reduction based on “lost” GDP growth.
It’s also interesting to consider what this analysis suggests about where the market is right now. We have rolled the model forward to 2024 based on IATA’s traffic and yield forecasts and the IMF’s world GDP forecast.
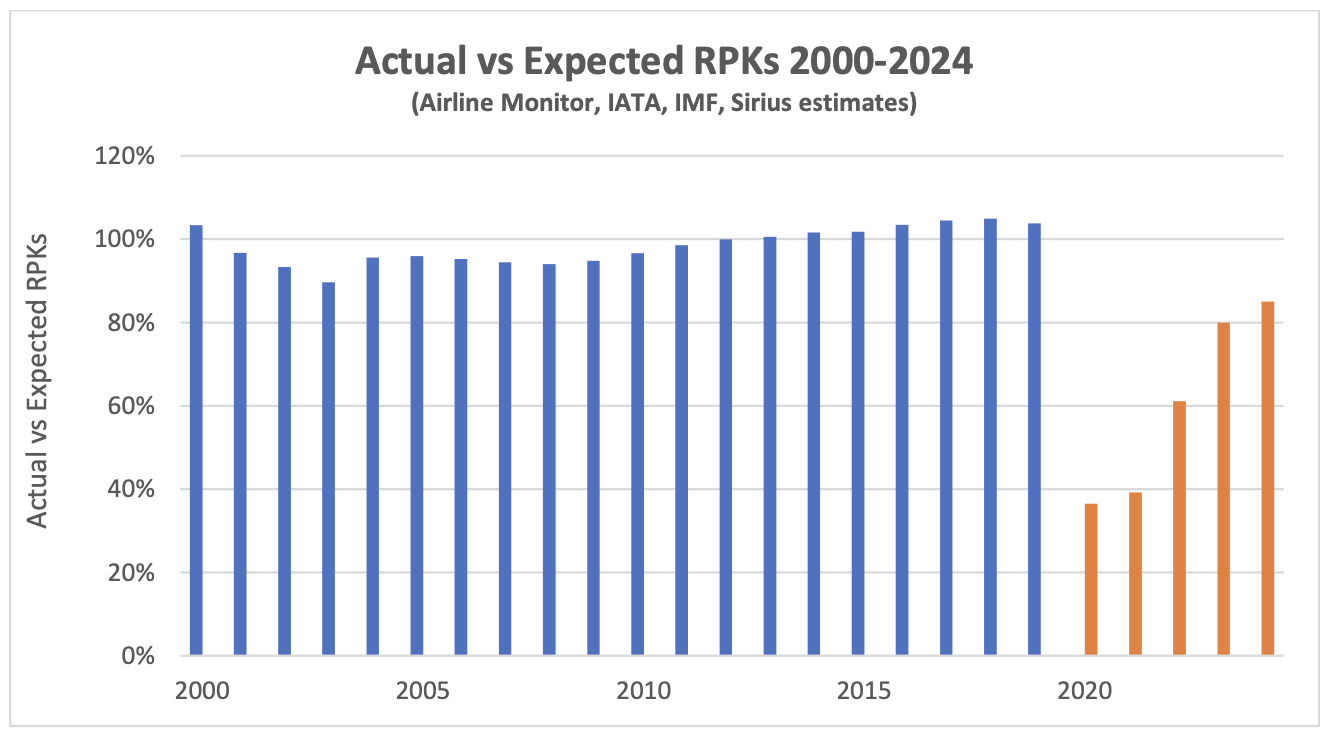
Based on this approach actual 2024 RPKs will only be 85% of expected, compared to 93% in 2002 (in the aftermath of 9/11). Obviously, the world may have permanently changed, but based on history there is scope for significant further traffic recovery in 2025 and beyond.
One factor that may obstruct this is a shortage of new aircraft. This may also have been part of the weak traffic performance in the 2000s, when new passenger aircraft deliveries did not surpass their previous peak of 1,191 in 2001 until 2012. If this happens then pent-up demand may find an outlet in higher ticket prices.
Macro-Economic Background
Having said in our last market update that we would focus more on the outlook for GDP the IMF confounded this goal by publishing a significant revision to their numbers for 2020 and 2021. These changes mean that the “permanent” loss of GDP growth which we estimated at 2.5-3.0% should be revised down to 2.0-2.5%.
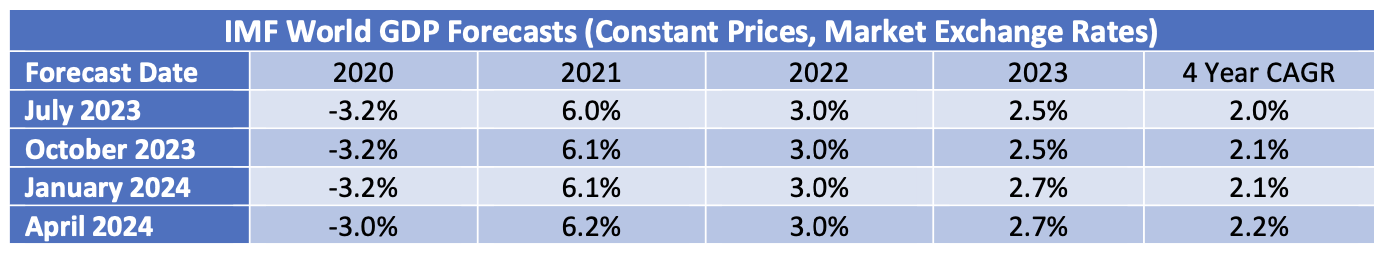
Economic growth is a key driver of long-term growth of air travel. However, since early 2022 its impact has been overshadowed by the fall and recovery in traffic associated with the pandemic. As recovery is largely complete the influence of overall economic conditions on air travel is likely to reassert itself.
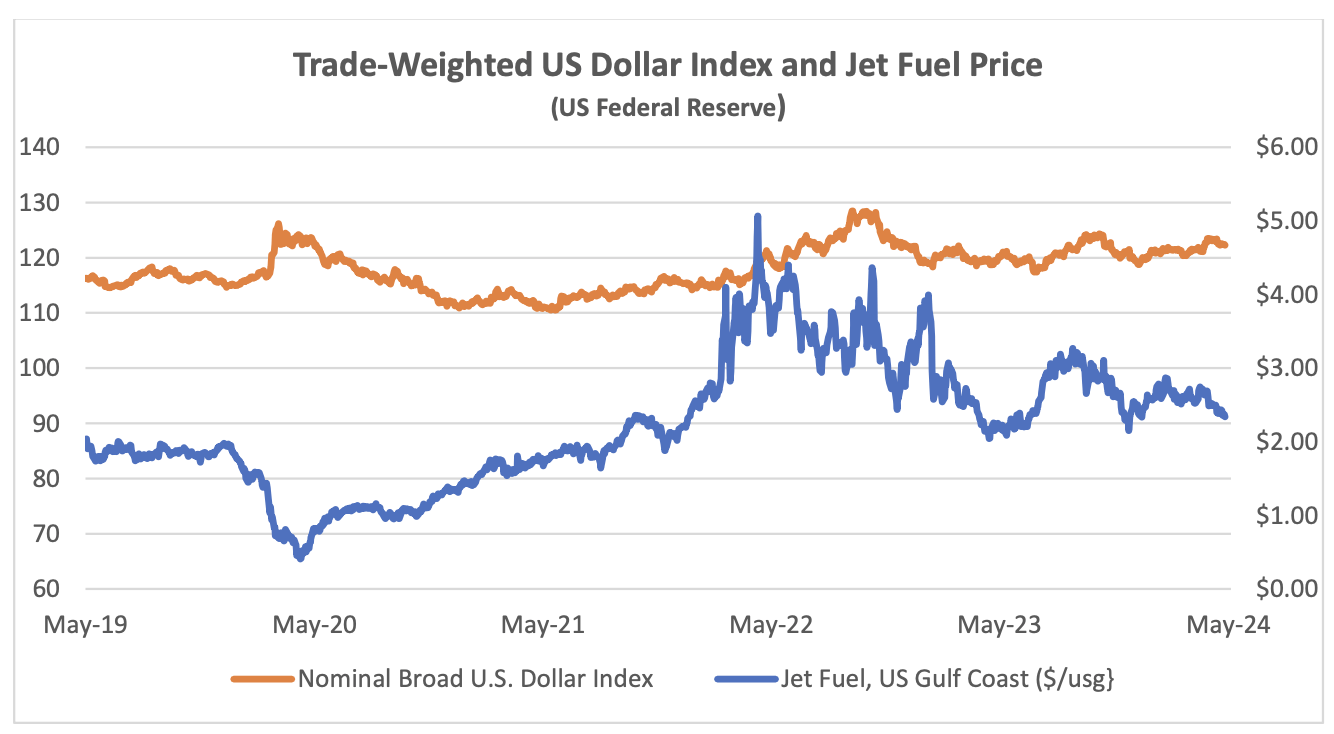
The US Dollar has weakened since its recent peak in September 2022, providing relief for airlines outside the US for dollar-denominated costs such as fuel, aircraft rents and aircraft spares. The price of jet fuel has remained volatile, but it has moderated since February 2024. This reduction has mainly been driven by a $10 reduction in the “crack spread” from c.$30 to c.$20.
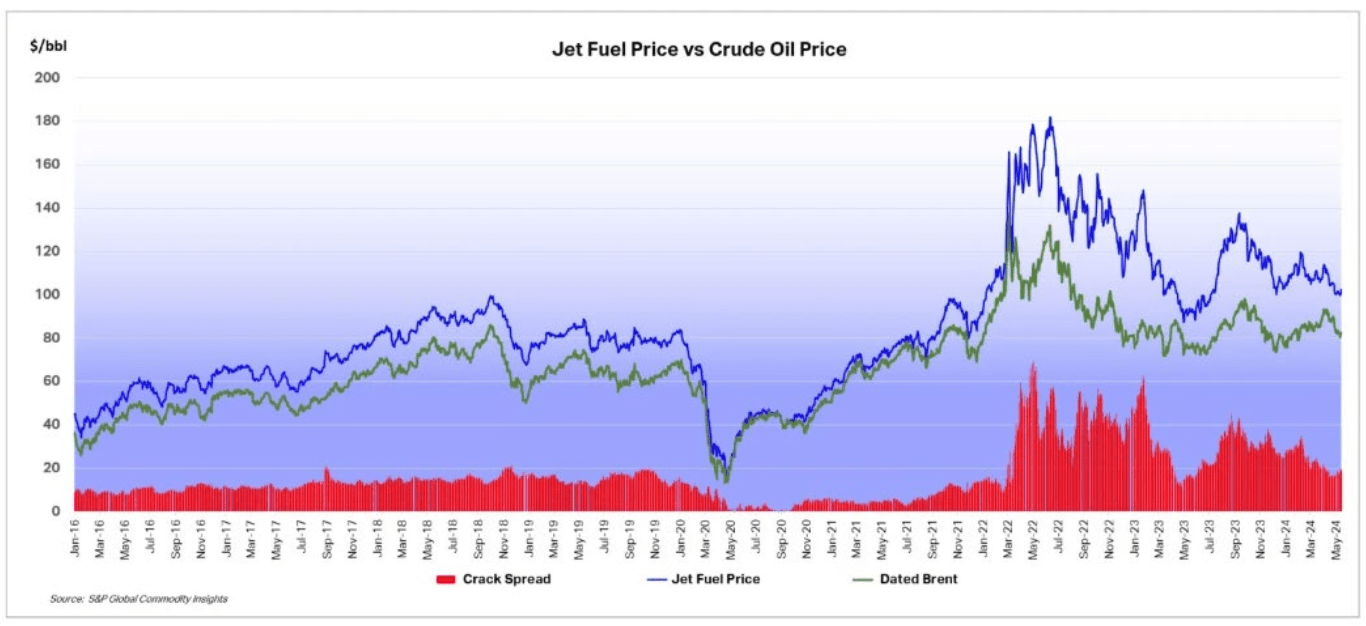
Another indicator that is potentially important to aircraft investors is the breakeven inflation rate on US Treasury Inflation-Protected Securities (TIPS). This indicator measures inflation expectations and it matters because used aircraft values are strongly influenced by the cost of new aircraft and over time this cost is linked to US Dollar inflation. In the short term this linkage is driven by escalation clauses in aircraft purchase contracts and in the long term by the general input cost environment for the aircraft manufacturers. The chart below compares the breakeven rate for 10-year and 5-year TIPS.
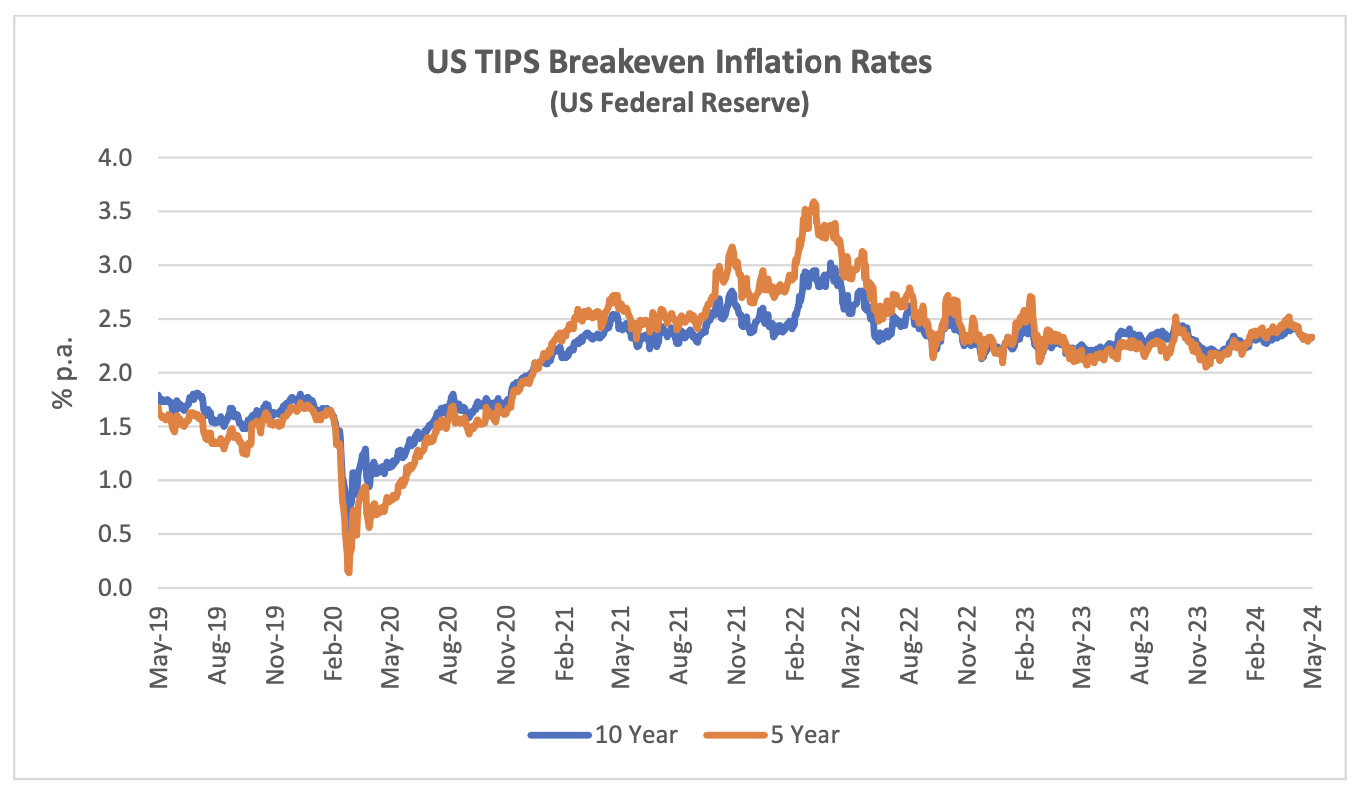
Although medium or long-term inflation expectations have never gone higher than 3.5%, actual inflation experience has been much higher in the last few years. This has led to higher appraised values for new aircraft.
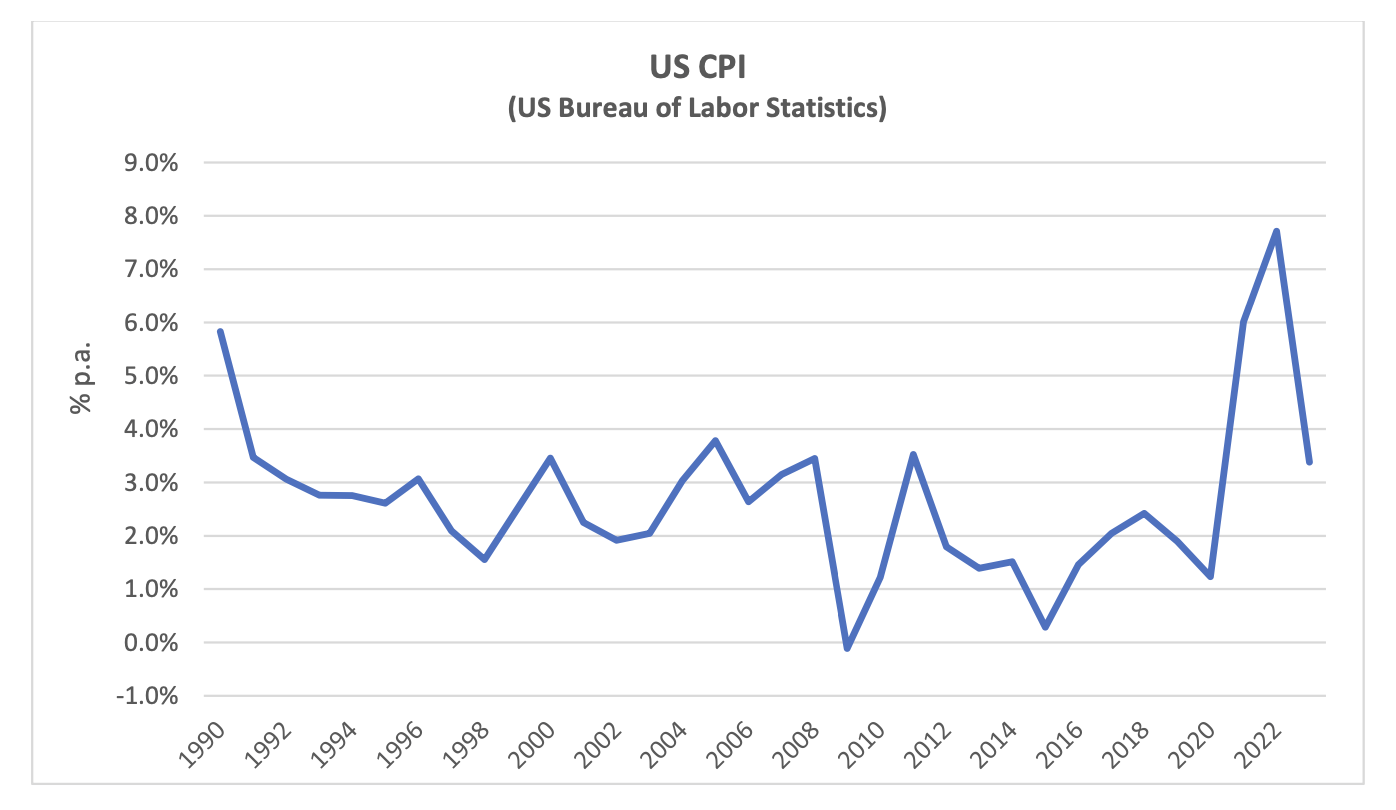
Traffic and Aircraft Demand
Global Air Passengers, RPK Billions per Month
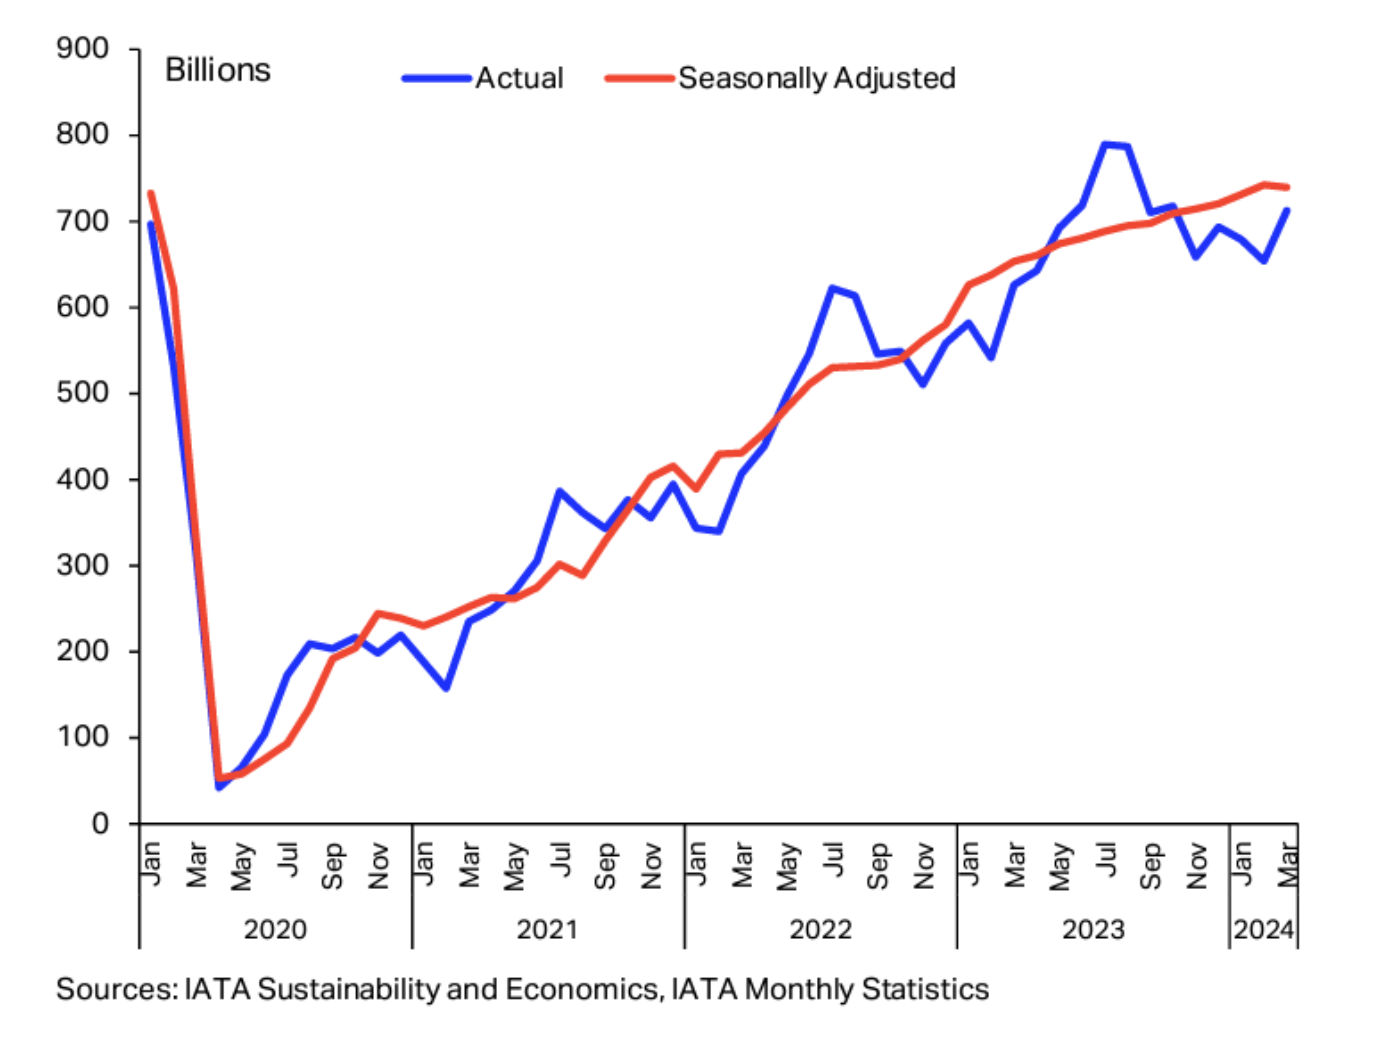
March 2024 RPKs were 0.1% higher than in March 2019, so recovery is official! Also, no region was more than 5% higher or lower than in 2019 so most of the extreme disparities in terms of recovery have worked their way out of the system.
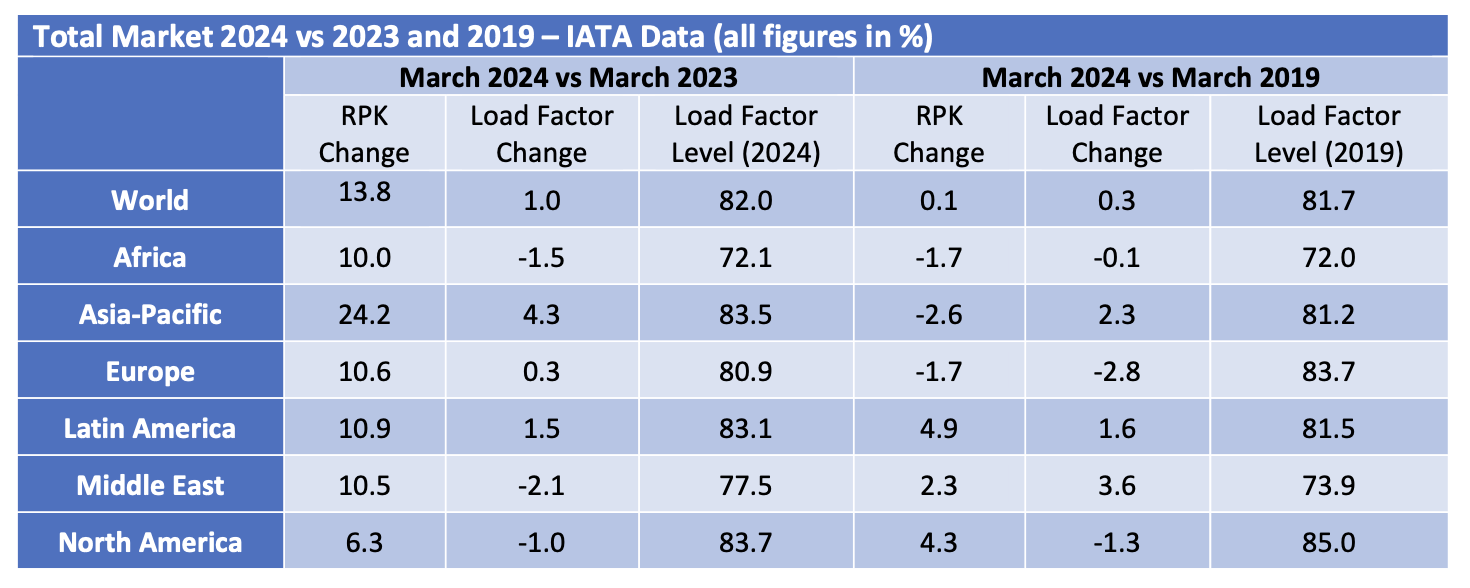
International traffic recovery still lags domestic and shows greater variation by region, with Asia-Pacific conspicuously weaker than in 2019 and North America much stronger. It is striking that North American international RPKs are 11.0% higher than in 2019 vs only a 1.5% increase for domestic US RPKs: domestic traffic across the Americas was the quickest major market to recover after 2020 so it is tempting to assume that all is well, but markets such as the US are relatively mature limiting long-term growth potential.
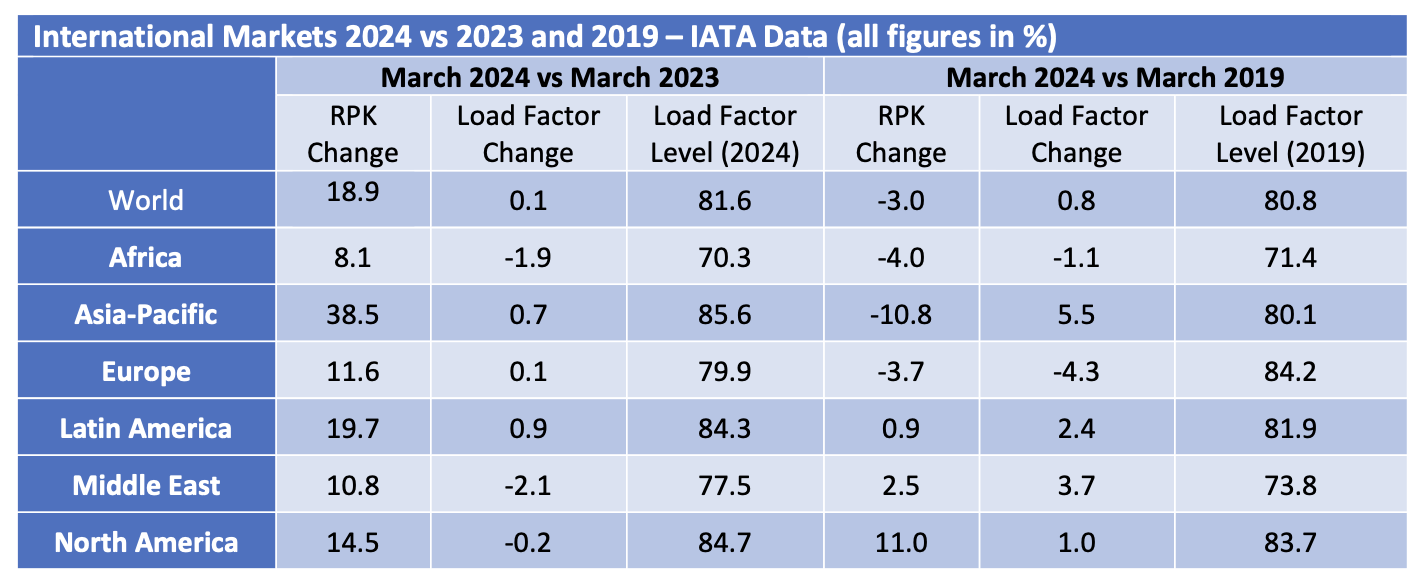
The key markets driving domestic traffic volumes growth are China and India which as emerging markets with very large populations are vital to the aviation industry long-run fortunes.
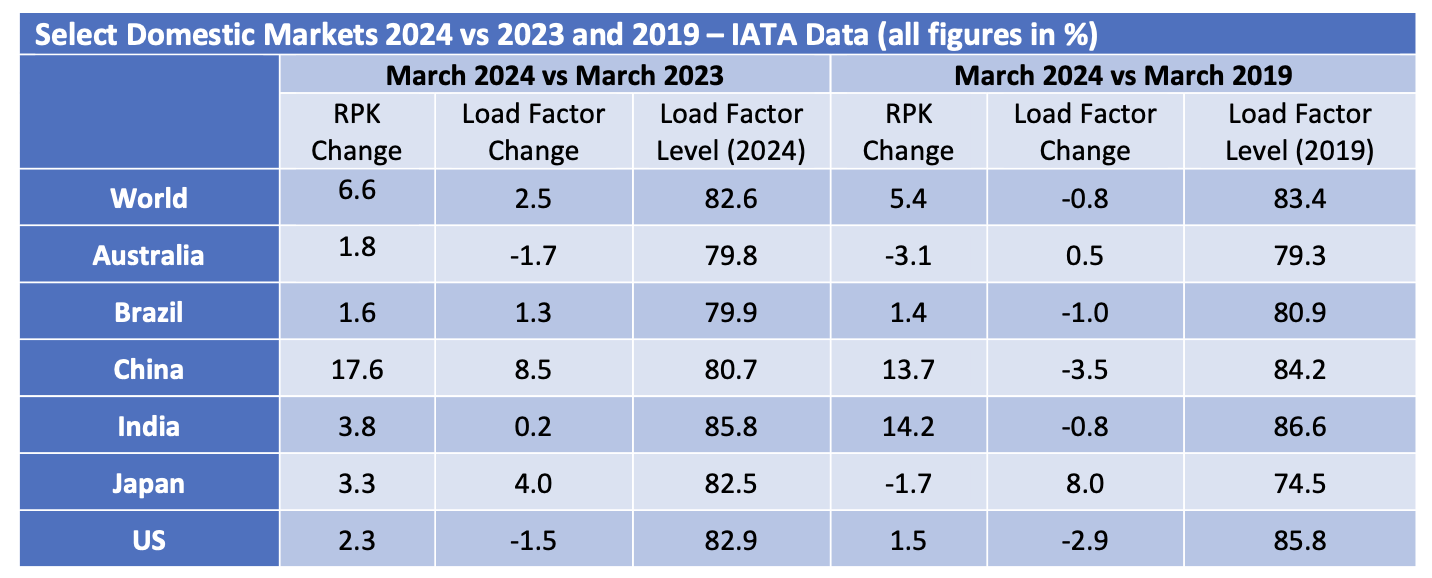
Although some short-haul aircraft serve international routes nearly all long-haul aircraft do so, and this is reflected in the relative demand for single-aisle (narrowbody) and twin-aisle (widebody) aircraft. Aircraft demand can be measured in terms of aircraft in service and ASKs[3], the standard measure of aircraft capacity deployed by airlines which indicates how intensively aircraft are being flown. Single aisle aircraft demand on both metrics is higher so far in 2024 than in 2019 whereas twin-aisle aircraft are marginally weaker by aircraft in service and lagging more in terms of ASKs. The difference between the two metrics may be down to the gradual move away from very large aircraft such as the B747 and A380 towards the smaller B787 and nA350, resulting in fewer ASKs per aircraft unit.
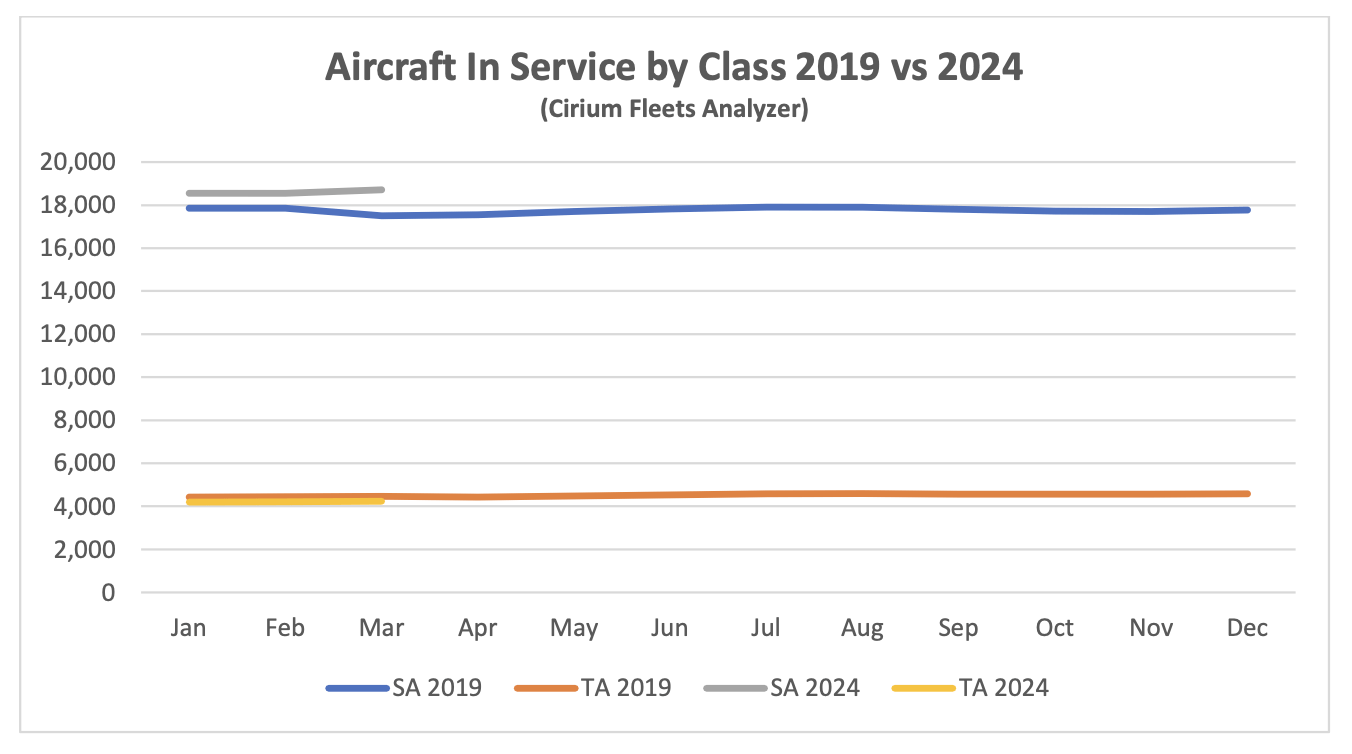
It is hard to see the TA 2024 data series because it is only very marginally lower than TA 2019.
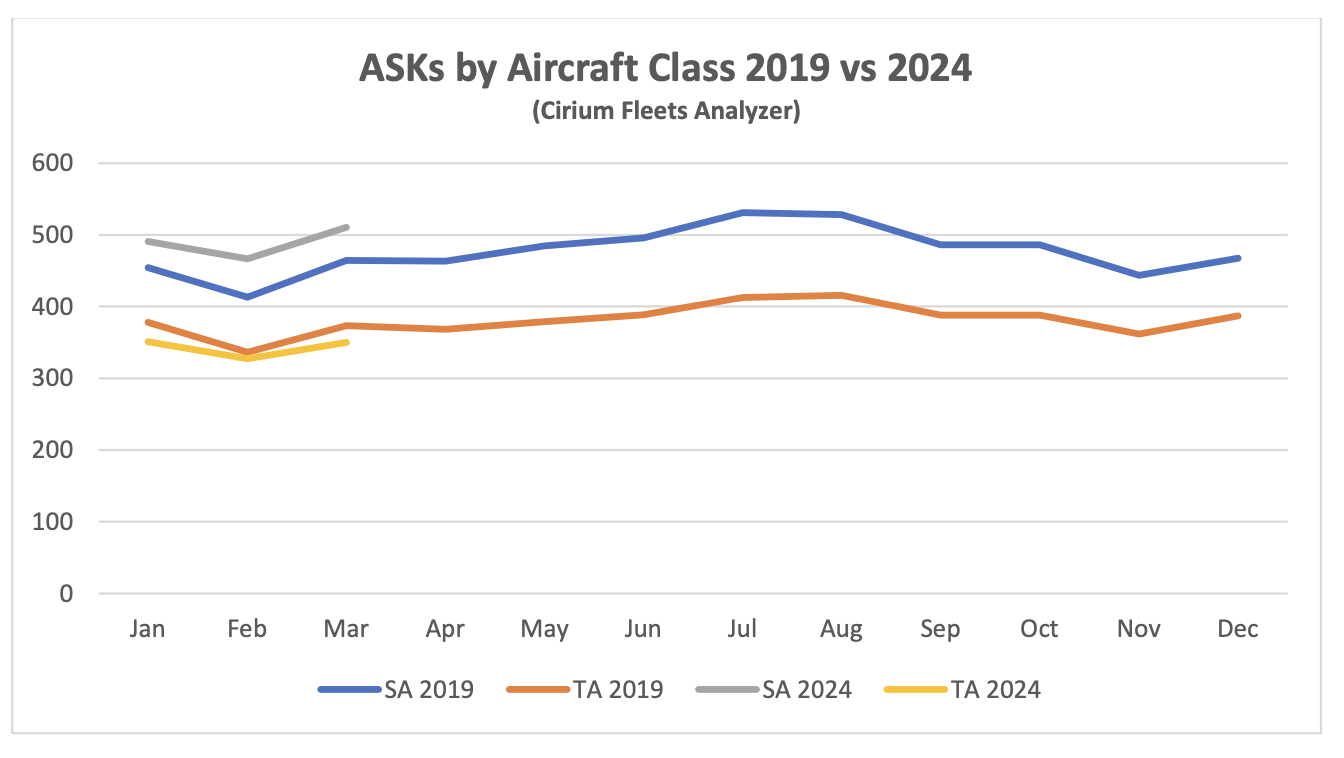
New Aircraft Supply
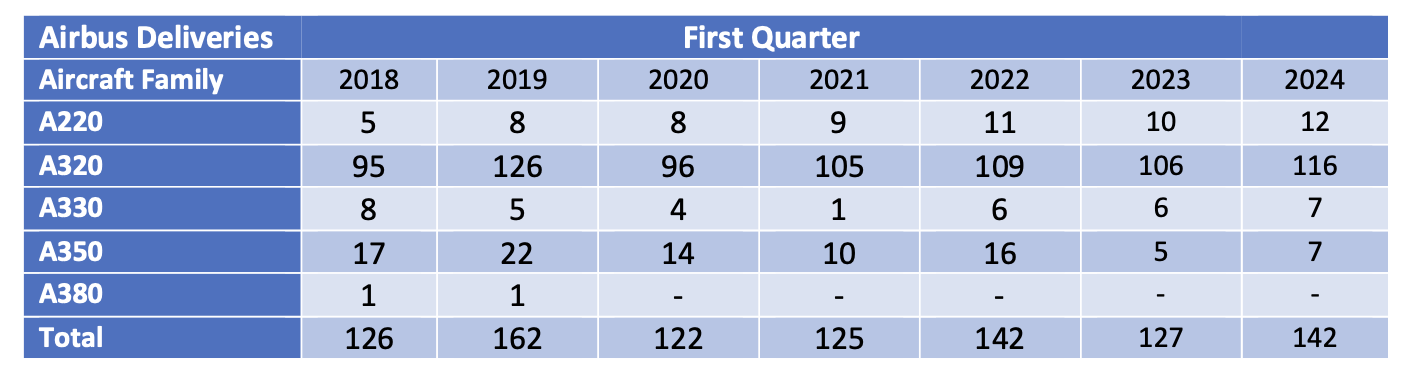
IN contrast to 2022 Airbus exceeded its delivery guidance of 720 aircraft in 2023. Management is guiding total deliveries of 800 aircraft for 2024 with most of the increase likely to come from the A320 family. The latest status of Airbus’s production plans is:
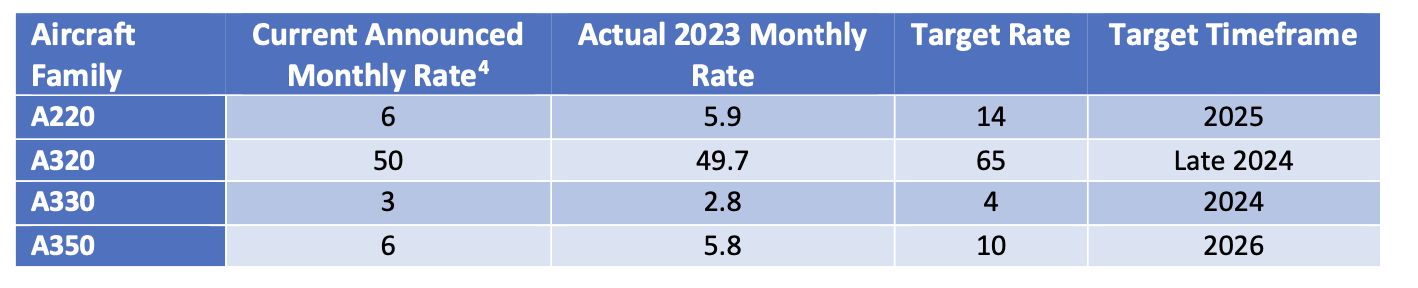
The only significant production target not captured in the table above is the objective to raise A320 family production to 75 per month by 2026.
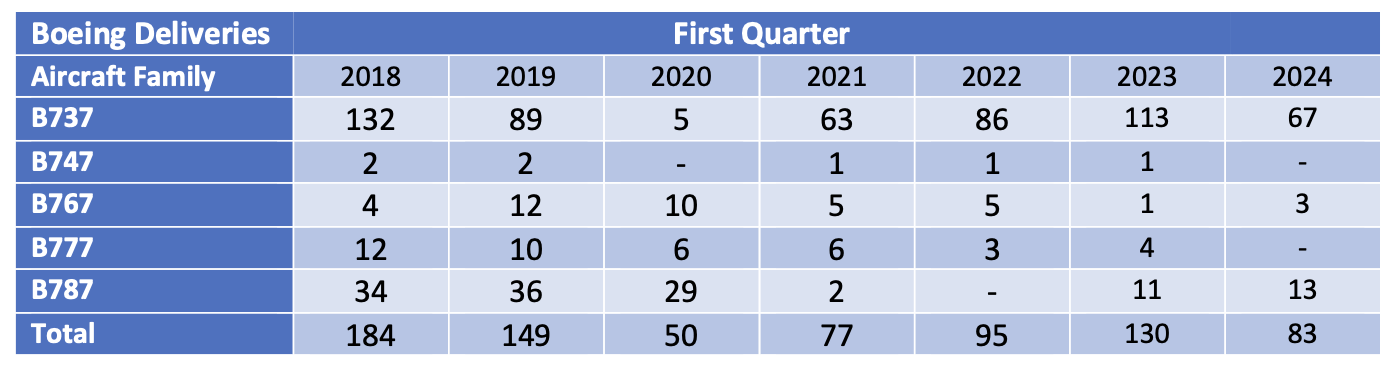
The latest status of Boeing’s production plans is:
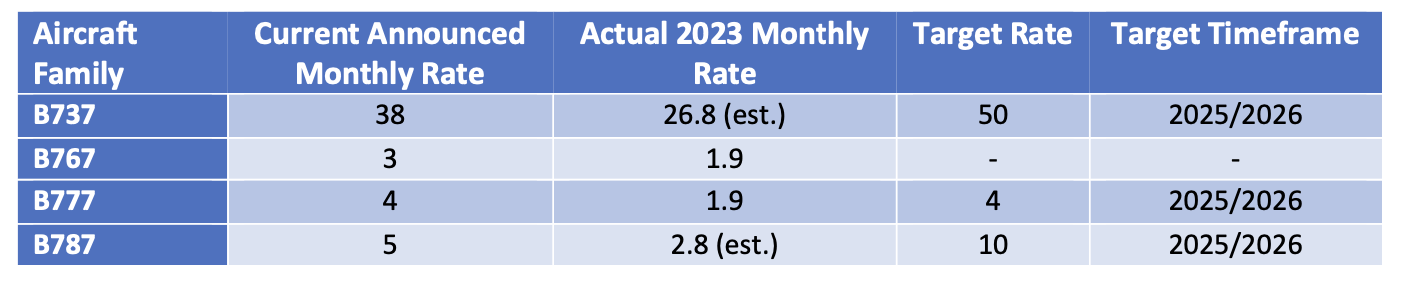
The Alaska Airlines B737-9 incident in January has once again created significant uncertainty around Boeing’s ability to increase production of the Max. The FAA is investigating Boeing’s quality control systems and other related matters and has announced that it will not approve any increases in production until it is satisfied with Boeing’s level of compliance. Boeing has also announced that it will not seek certification of the B737-7 and -10 variants until it has engineering solutions for the engine inlet overheating issue resulting from extended engine anti-Ice operation in dry air. There is no definite timeframe to resolve this issue.
B737 inventory decreased from 175 at the end of 2023 to 110 at the end of Q1 2024, including 70 B737-8 aircraft due to be delivered to Chinese airlines which must be approved and accepted by the Chinese aviation regulator the CAAC. The 110 number above only includes aircraft manufactured before the start of 2024, suggesting that nearly all the B737s delivered in Q1 2024 were from inventory as the reduction of 65 compares to 67 aircraft delivered in the quarter. (Currently, China's 13 domestic carriers operate 97 B737 MAX planes in their fleet. China Southern, Air China and Hainan Airlines have 24, 16 and 11 aircraft, respectively. Shanghai Airlines, Xiamen Airlines and Shandong Airlines are also B737 MAX operators.
As with the Max Boeing holds a significant inventory of undelivered B787 aircraft, c.40 at the end of Q1 vs c.50 at the end of 2023. Boeing has said it expects to deliver most of them in 2024. The inventory reduction of 10 aircraft compares with 13 total deliveries, suggesting that both B737 and B787 production is being severely disrupted. Boeing has not provided any delivery guidance for 2024.
COMAC of China achieved a significant increase in ARJ 21 deliveries and Embraer was in line with 2023.
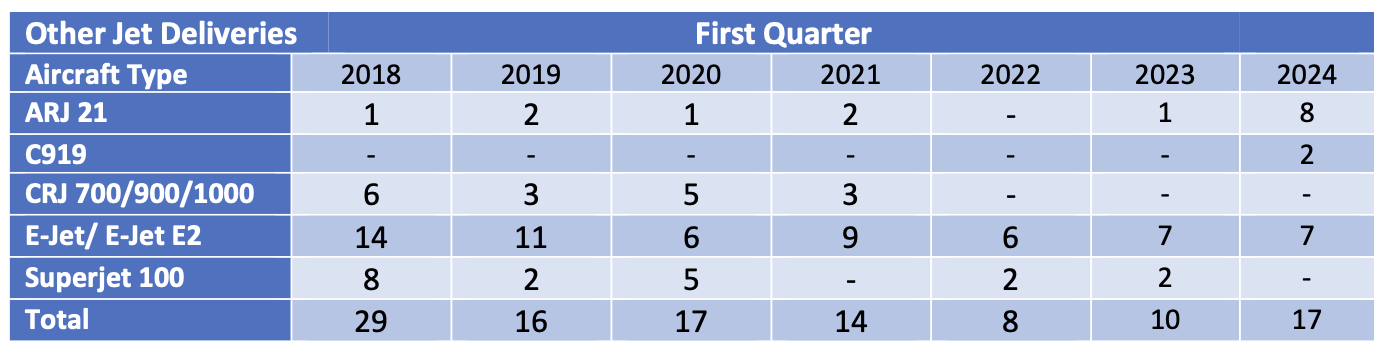
Airline Industry Financial Performance
IATA released a new airline industry financial forecast in June 2024 as part of its semi-annual Global Outlook for Air Transport. The table below compares key forecast outputs for 2024 with IATA’s previous forecast published in December 2023.
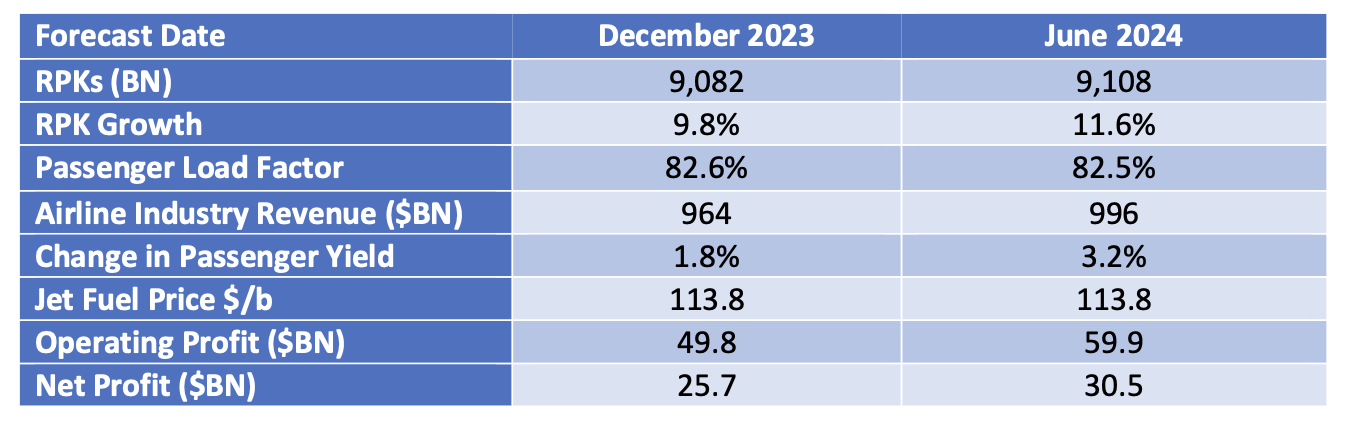
The new forecast does not show a big change in RPKs or key costs such as jet fuel, but the yield, revenue and profitability outlook is significantly better.
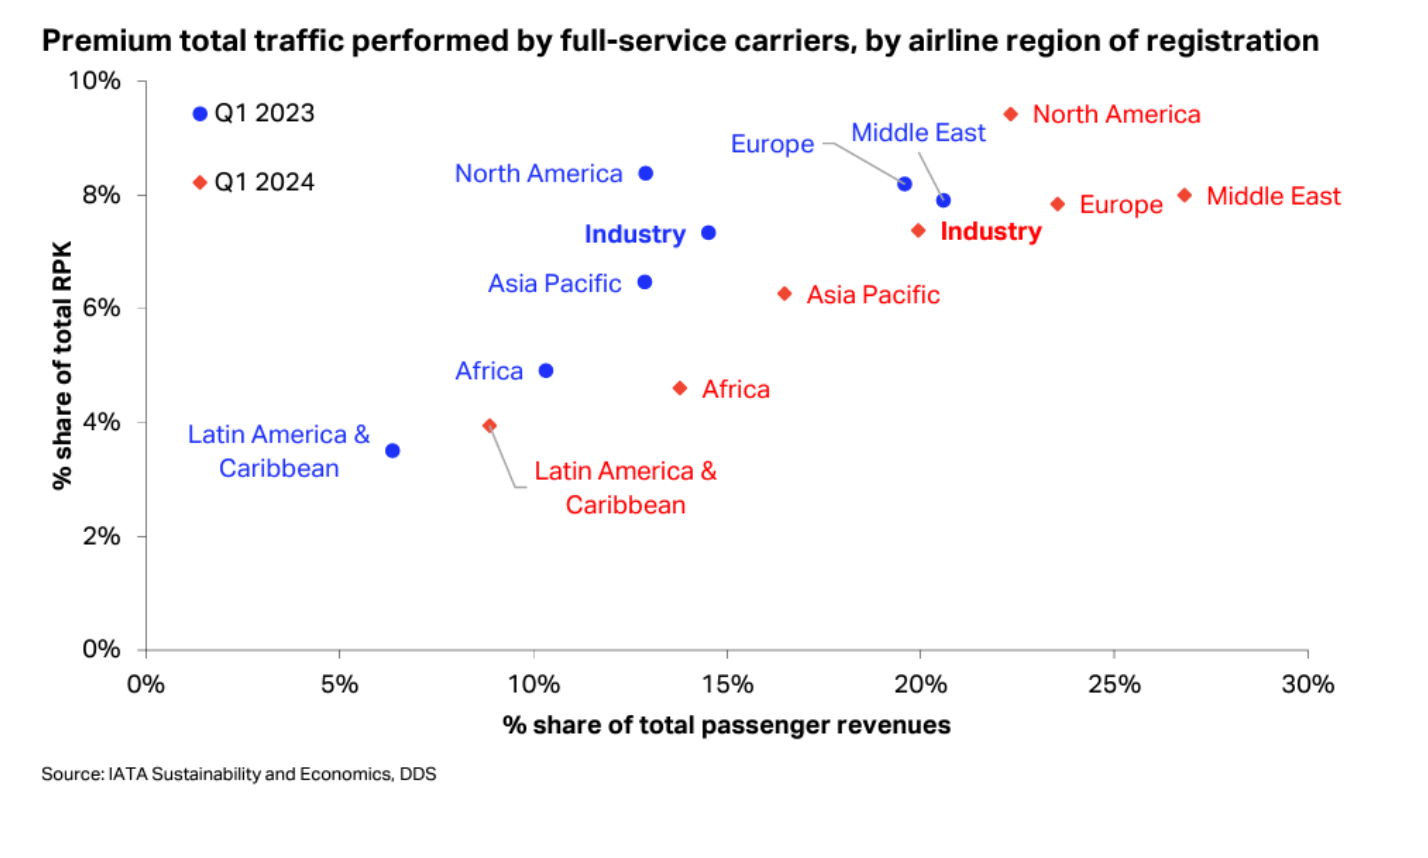 One development with a potentially important impact on 2024 airline profits is a recovery in the price of business and first-class travel. Although Q1 2024 share of RPKs was in line with typical historic levels at around 7% share of revenues increased from a historically low 15% to a more “normal” 20%. This will help the bottom line of the network airlines rather than low-cost airlines with very limited, if any, premium cabin offering.
Since the start of 2024 airline share prices have shown persistent, albeit limited, downside volatility relative to the overall stock market.
NYSE Arca Global Airline Index vs S&P Global 1200 Index (Google Finance)
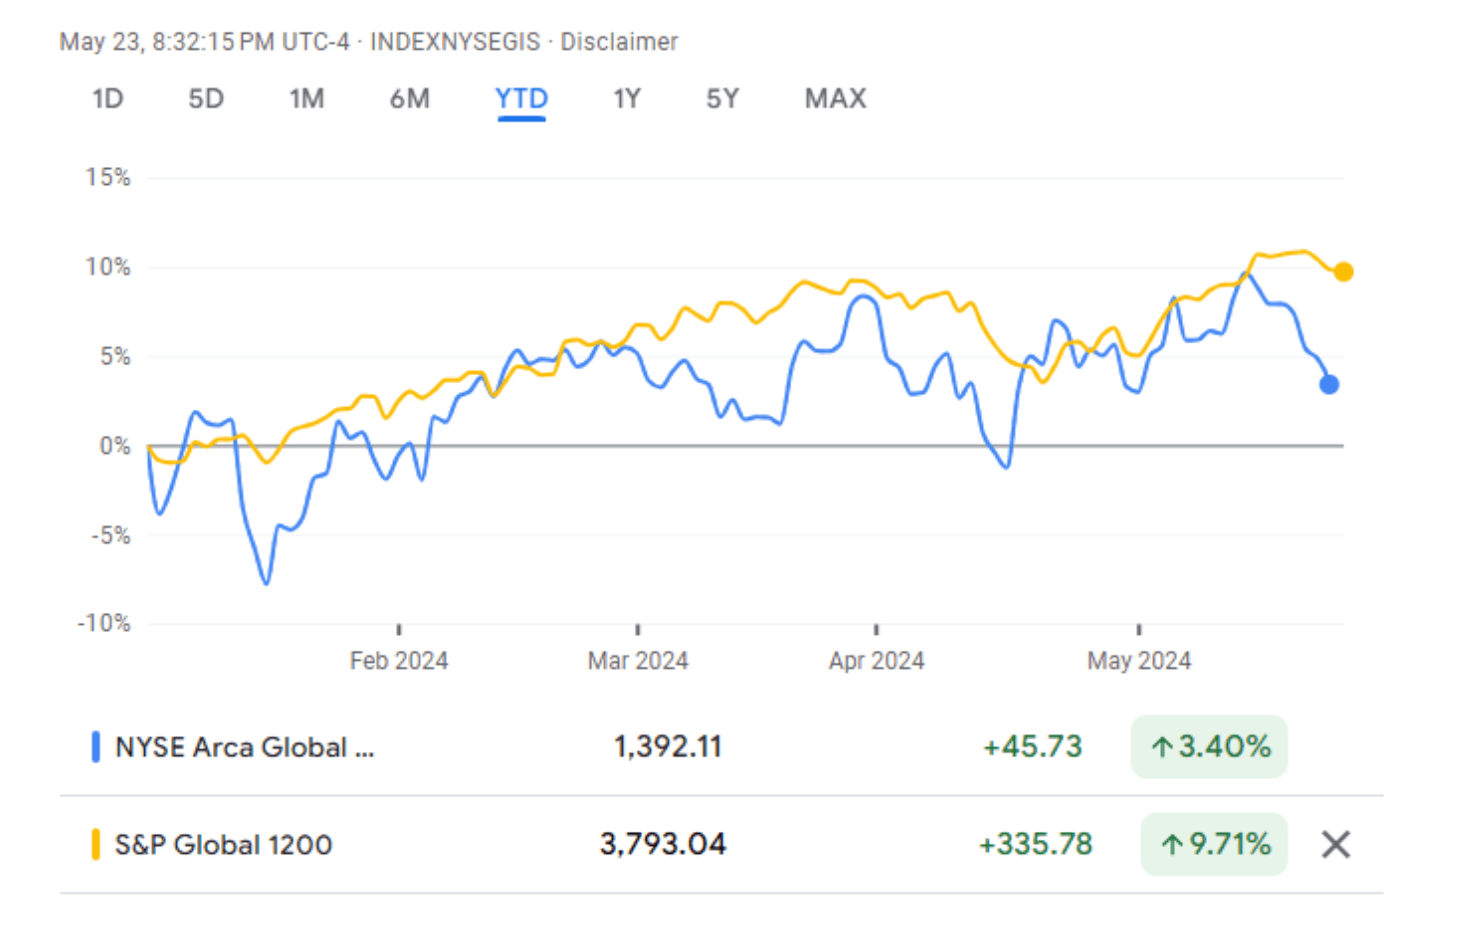
GOL of Brazil files for US bankruptcy protection in January. This was not a major surprise as GOL’s major competitors Aviance and LATAM had already done so during the pandemic and GOL had engaged in significant financial restructuring in the same timeframe.
The second largest airline by equipment value to fail is Lynx Air of Canada with a fleet including 9 X B373-8s. Lynx filed for bankruptcy protection in February, citing rising operating costs, high fuel prices, increasing airport charges, and a difficult economic and regulatory environment. Lynx was a low-cost airline that started operations in 2022 and some or all its problems are shared by most low-cost North American carriers up to and including Southwest Airlines, which have not benefitted from the strength of North American international traffic in the same way as the network airlines.
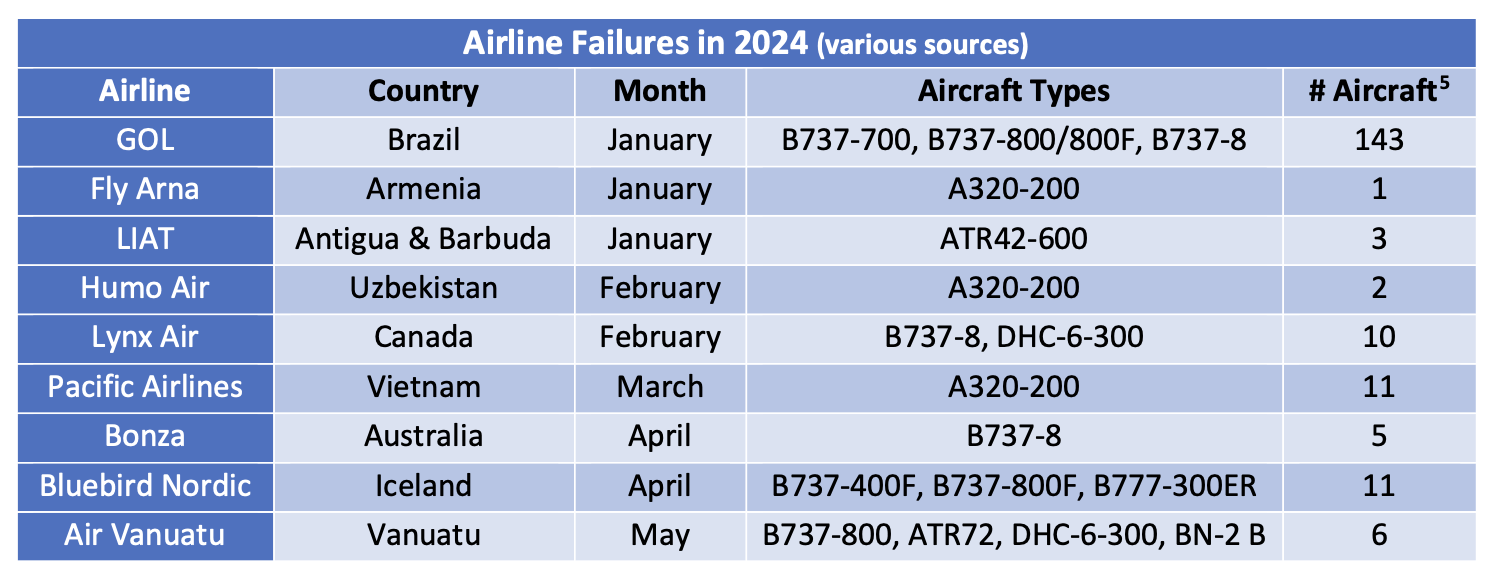 Sometimes airline financial distress comes in shades of grey rather than black and white. Although Pacific Airlines has ceased operations it has declared its intention to restart, and SpiceJet of India (43 aircraft) has suffered several adverse court judgments although it remains in business.
[1] RPKs is the acronym for revenue passenger kilometres, which is the product of the number of paying passengers times distance flown.
[2] Yield is total passenger revenue divided by total industry RPKs.
[3] ASKs is the acronym for available seat kilometres, which is the product of the number of available seats flown times distance flown.
[4]Airbus normally quotes its production rates based on an 11.5-month year for single-aisle aircraft.
[5]Fleet numbers are as of December 31st, 2023.
Disclaimer
This Presentation has been made to you solely for general information purposes and is not intended to provide, and should not be relied upon for legal, tax, accounting, investment, or financial advice. This Presentation is not a sales material and does not constitute or form any part of any offer, invitation or recommendation to the recipient, its affiliates or any other person to underwrite, sell or purchase securities, assets or any other product, nor shall it or any part of it form the basis of, or be relied upon, in any way in connection with any contract or transaction decision relating to any securities, assets or any other product. None of Sirius, its affiliates or shareholders shall have any responsibility or liability to the recipient, its affiliates, shareholders or any third party in relation to this Presentation or any other document or materials prepared by Sirius or its affiliates, officers, directors, employees, advisers, or agents. Sirius and its affiliates, officers, directors, employees, advisers, and agents have taken all reasonable care to ensure that the information contained in this Presentation is accurate. Neither Sirius nor any of its affiliates, officers, directors, employees, advisors, or agents has any obligation to update this Presentation. Under no circumstances should the delivery of this Presentation, irrespective of when it is made, create an implication that there has been no change in the affairs of the entities that are the subject of this Presentation. This Presentation may be updated and amended by a supplement and, where such supplement is prepared, this Presentation will be read and construed with such supplement. The statements herein which contain such terms as "may", "will", "should", "expect", "anticipate", "estimate", "intend", "continue" or "believe" or the negatives thereof or other variations thereon or comparable terminology are forward-looking statements and not historical facts. No representation or warranty, express or implied, is made as to the fairness, accuracy, or completeness of such statements, estimates and projections. The recipient should not place reliance on any forward-looking statements. Neither Sirius nor its affiliates undertake any obligation to update or revise the forward-looking statements contained in this Presentation to reflect events or circumstances occurring after the date of this Presentation or to reflect the occurrence of anticipated events. The information set out in this Presentation has been prepared by Sirius based upon various methodologies and calculations which it believes to be reasonable and appropriate. Past performance cannot be a guide to future performance. In preparing this Presentation, Sirius has relied upon and assumed, without independent verification, the accuracy and completeness of all information available from public sources or which was provided to it or otherwise reviewed by it. This Presentation supersedes and replaces any other information provided by Sirius or its affiliates, officers, directors, employees, advisers, or agents in respect of the content of the Presentation. No information or advice contained in this Presentation shall constitute advice to an existing or prospective investor in respect of his personal position. None of Sirius, its affiliates, or its affiliates’ officers, directors, employees or advisers, connected persons or any other person accepts any liability whatsoever for any loss howsoever arising, directly or indirectly, from this Presentation or its contents.

Industry Update Q4 2023
Macro-Economic Background
The IMF’s latest update to its World Economic Outlook shows a marginal improvement in its assessment of overall performance across the years affected by the pandemic. Our focus in presenting this data so far has been to see if there has been any “permanent” loss of output in this period. World GDP grew at 2.8% p.a. for the 30 years through 2019 and leading forecasters such as DRI expect a similar growth rate for the next 20 years. This implies that the pandemic has caused a long-term output loss of c. 0.7% p.a. for the years 2020-2023, or roughly 2.5-3.0% in total. In future updates we will focus more on the outlook for growth.
Economic growth is a key driver of long-term growth of air travel. However, since early 2022 its impact has been overshadowed by the fall and recovery in traffic associated with the pandemic. As recovery is largely complete the influence of overall economic conditions on air travel is likely to reassert itself
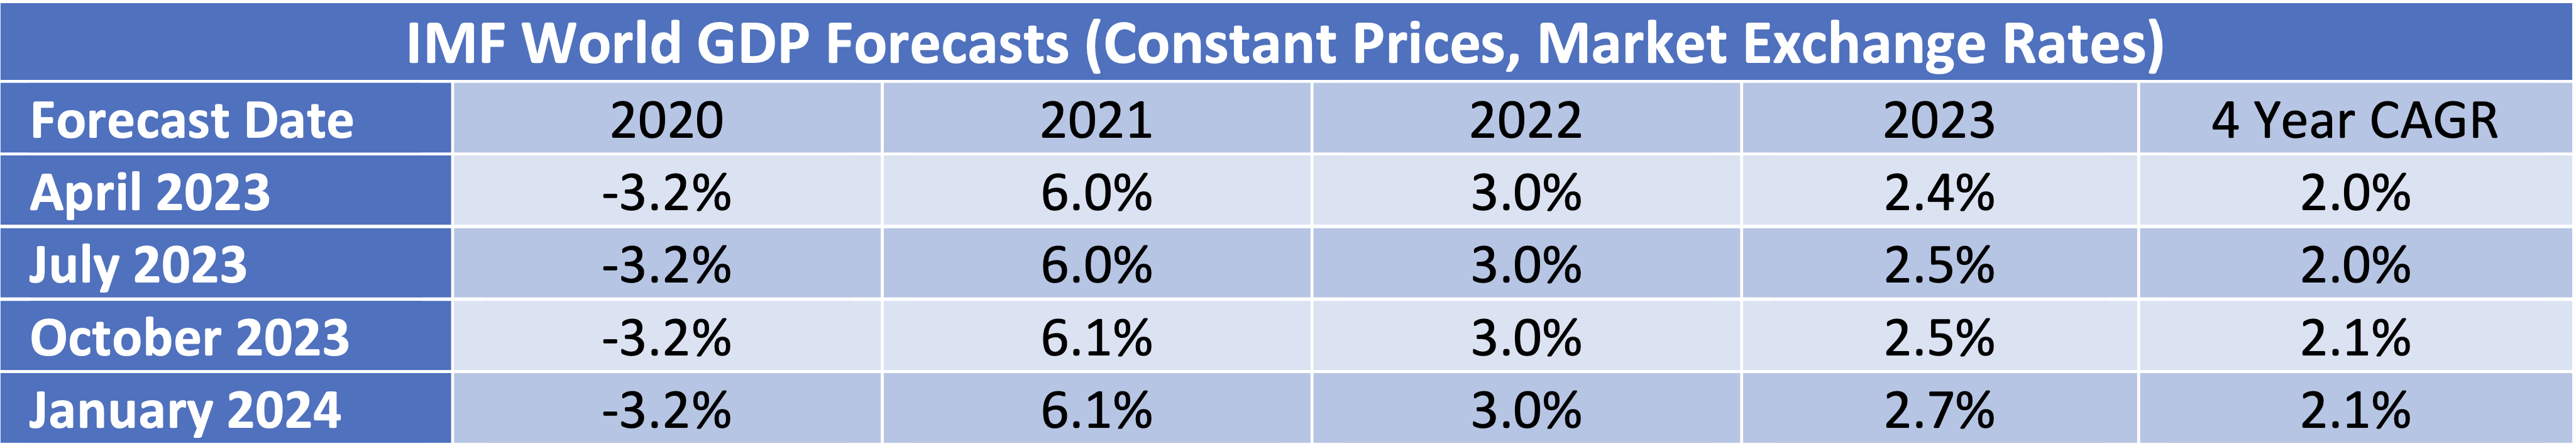
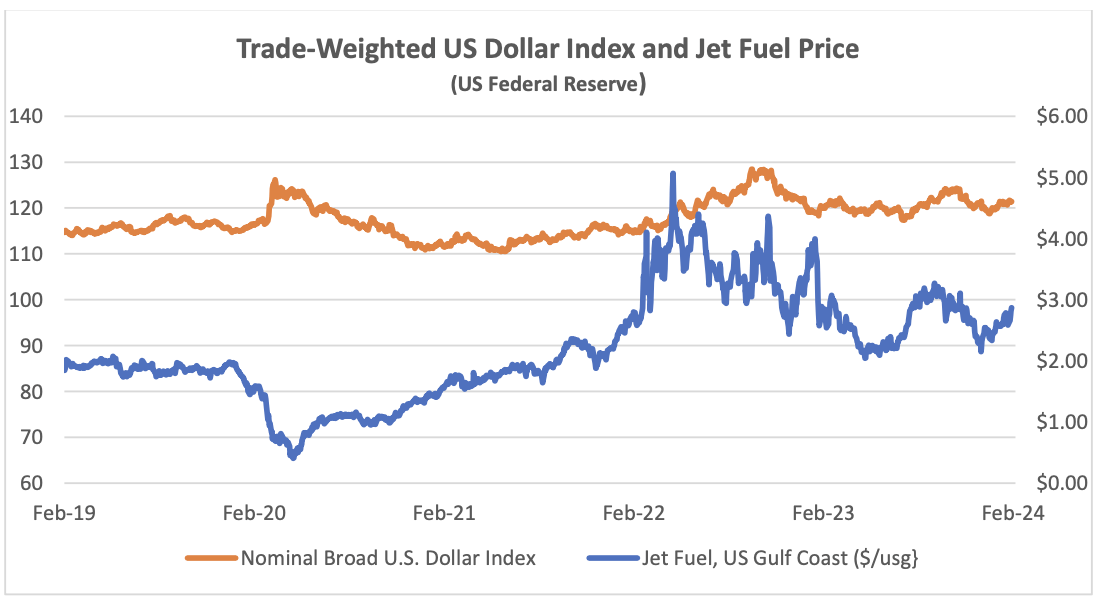
The US Dollar has weakened since its recent peak in September 2022, providing relief for airlines outside the US for dollar-denominated costs such as fuel, aircraft rents and aircraft spares. The price of jet fuel has remained volatile and has increased since the start of 2024. The IATA chart below shows that a key characteristic of current jet fuel market conditions remains the historically high level of the “crack spread”[1] at over $30 per barrel. Some of the issues that have contributed to this increase include the pace of traffic recovery, especially in Asia Pacific, and reported local refinery issues in the US and Europe. It seems reasonable to expect that the crack spread will reduce over time but with a lot of volatility around this trend.
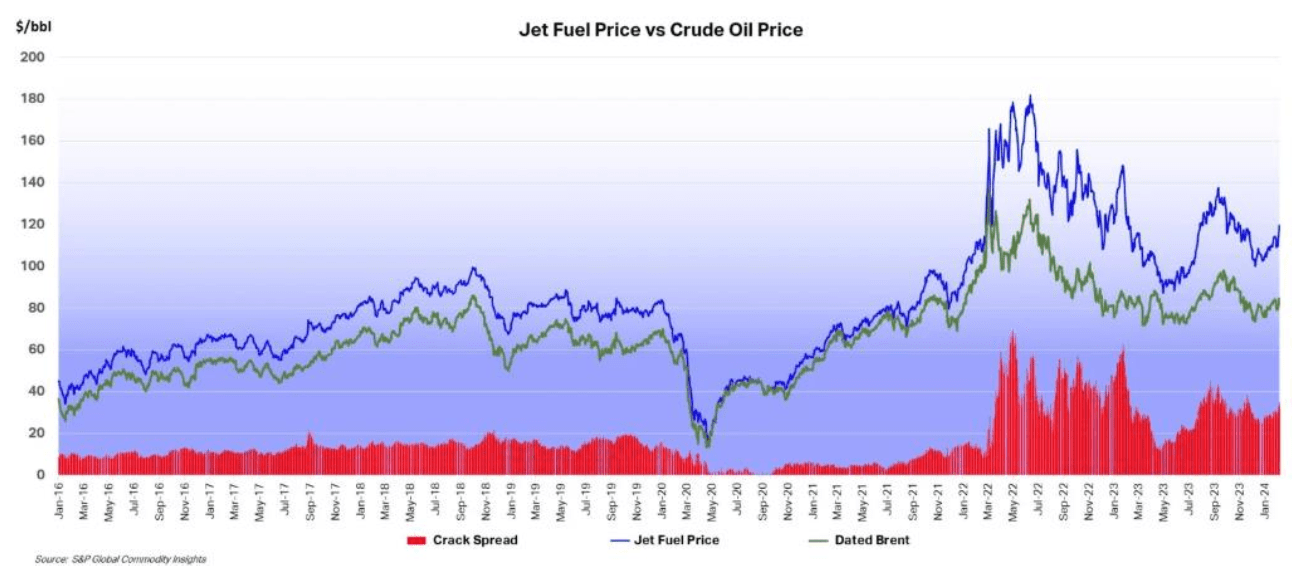
Another indicator that is potentially important to aircraft investors is the breakeven inflation rate on US Treasury Inflation-Protected Securities (TIPS). This indicator measures inflation expectations and it matters because used aircraft values are strongly influenced by the cost of new aircraft and over time this cost is linked to US Dollar inflation. In the short term this linkage is driven by escalation clauses in aircraft purchase contracts and in the long term by the general input cost environment for the aircraft manufacturers. The chart below compares the breakeven rate for 10-year and 5-year TIPS.
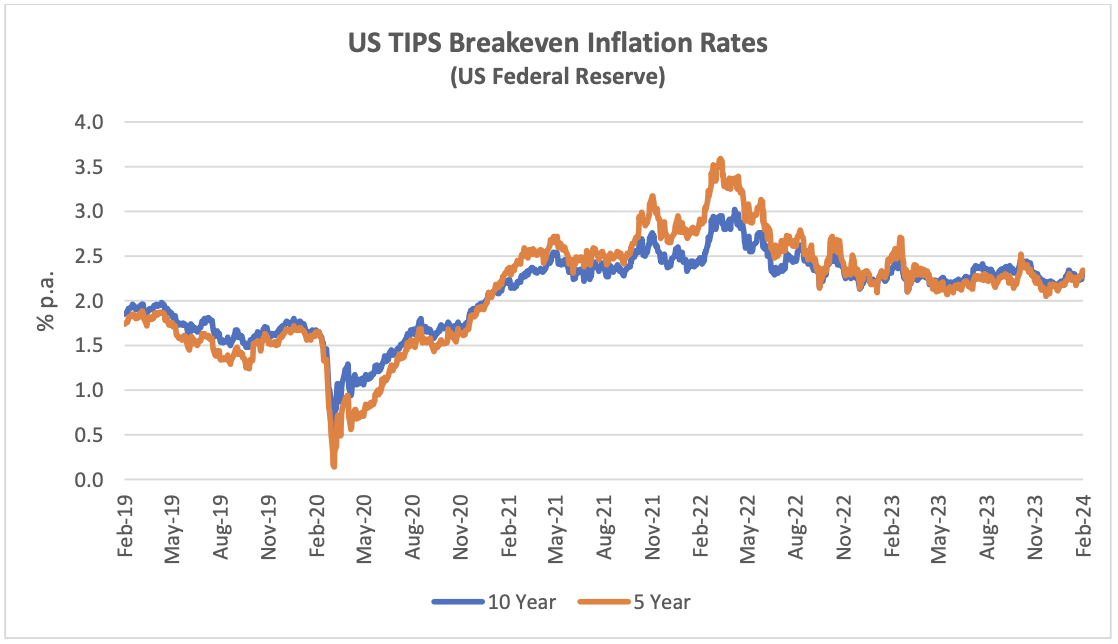
The recent reduction in US inflation has not significantly impacted the TIPS market, implying that this was already captured in investor expectations.
Traffic and Aircraft Demand
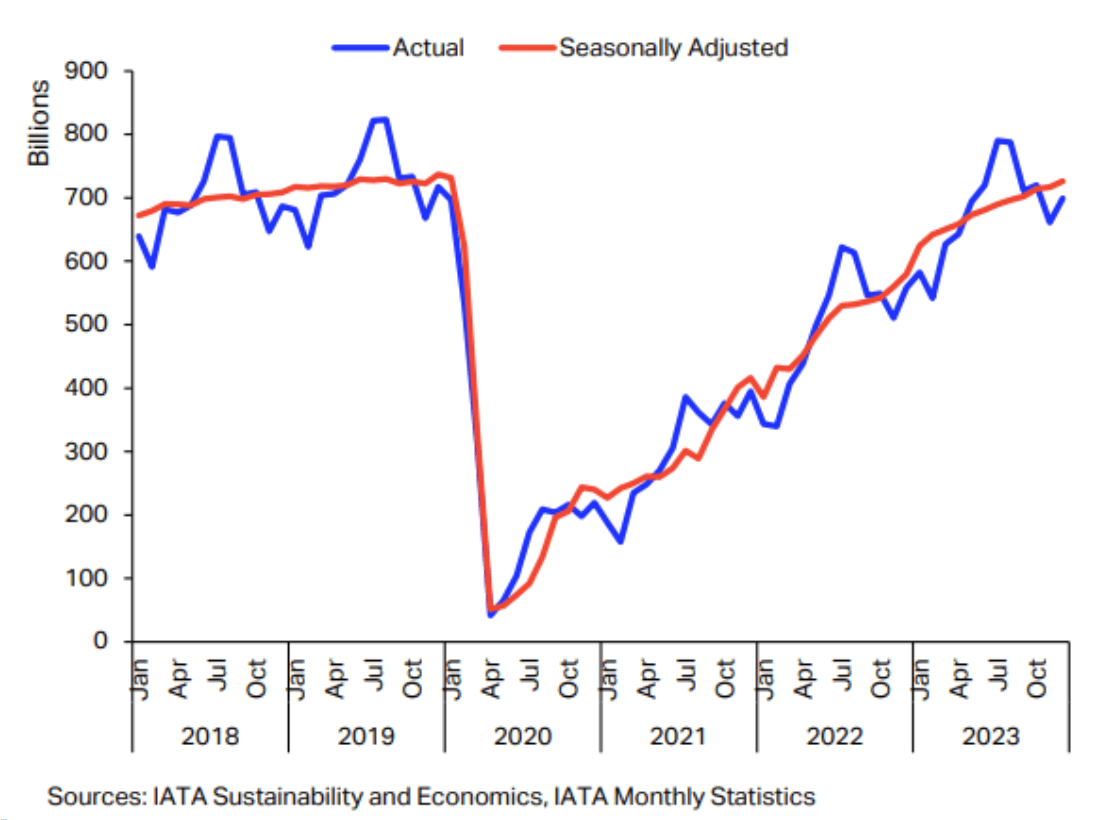
December 2023 air travel volumes were only 2.5% below December 2019, and full year comparison shows 2023 5.9% below 2019. Asia Pacific was the strongest performing regions as government restrictions (especially in China) were finally relaxed. As in 2022, there was a much bigger increase in international traffic vs domestic traffic, mainly because the former is still coming off a lower base.
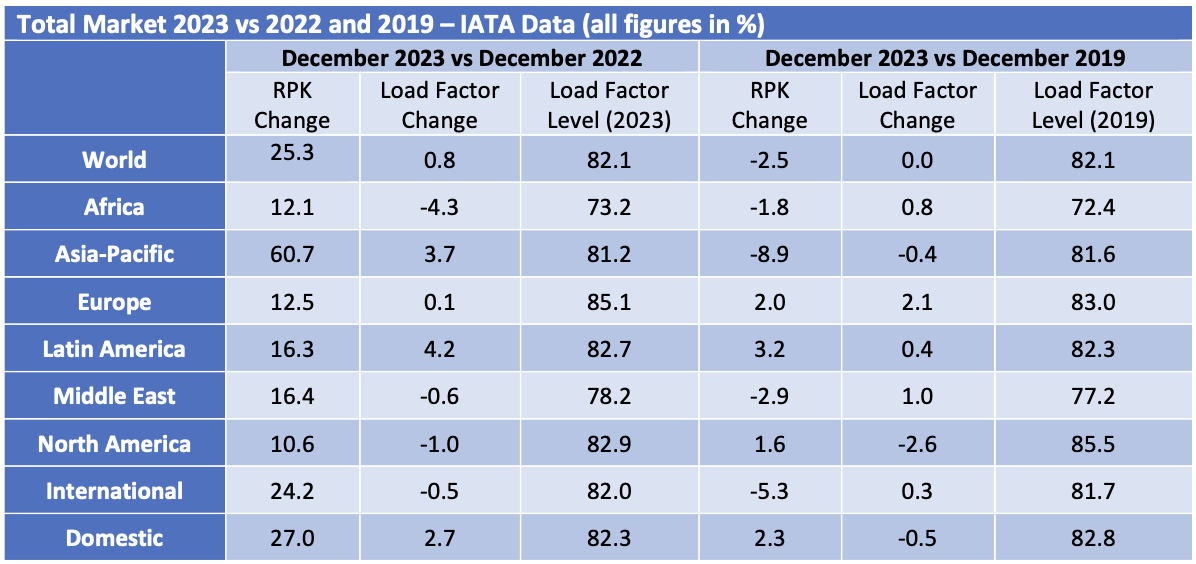
Despite its strong year on year performance Asia Pacific remains the weakest region compared to 2019 with a significantly lower share of global traffic.
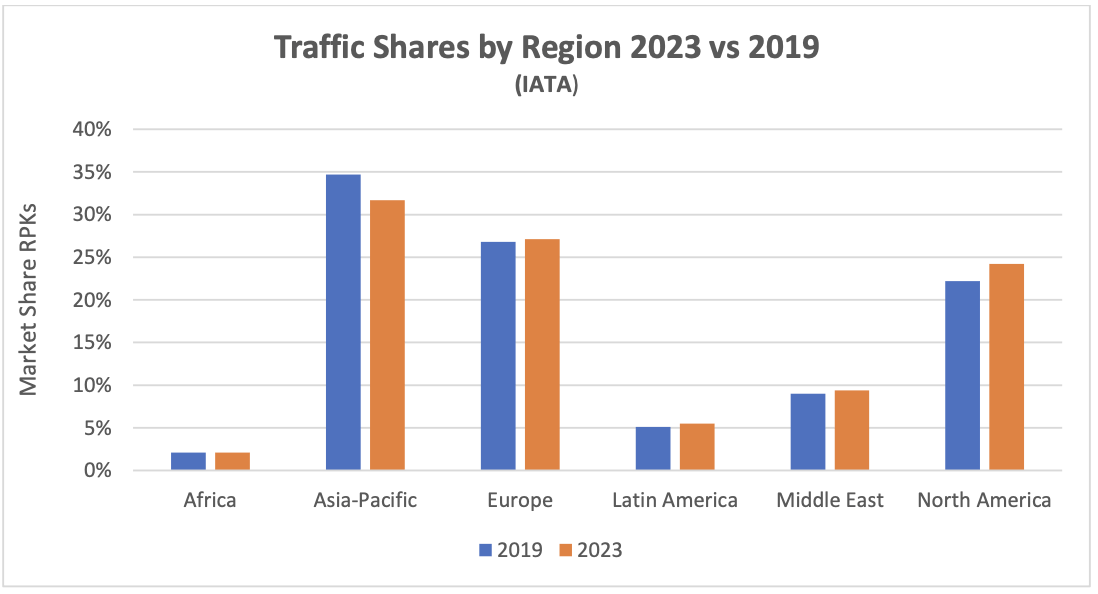
The chart below shows the changes in RPKs[2] and ASKs[3] by month. Since the start of 2023 the level of increase in RPKs has reduced because the year-on-year comparison is with a month in 2022 that was subject to a greater level of traffic recovery. Second the rate of increase in RPKs and ASKs has become more alike as the recovery in load factors is largely complete, so additional capacity needs to be deployed to support further traffic growth.
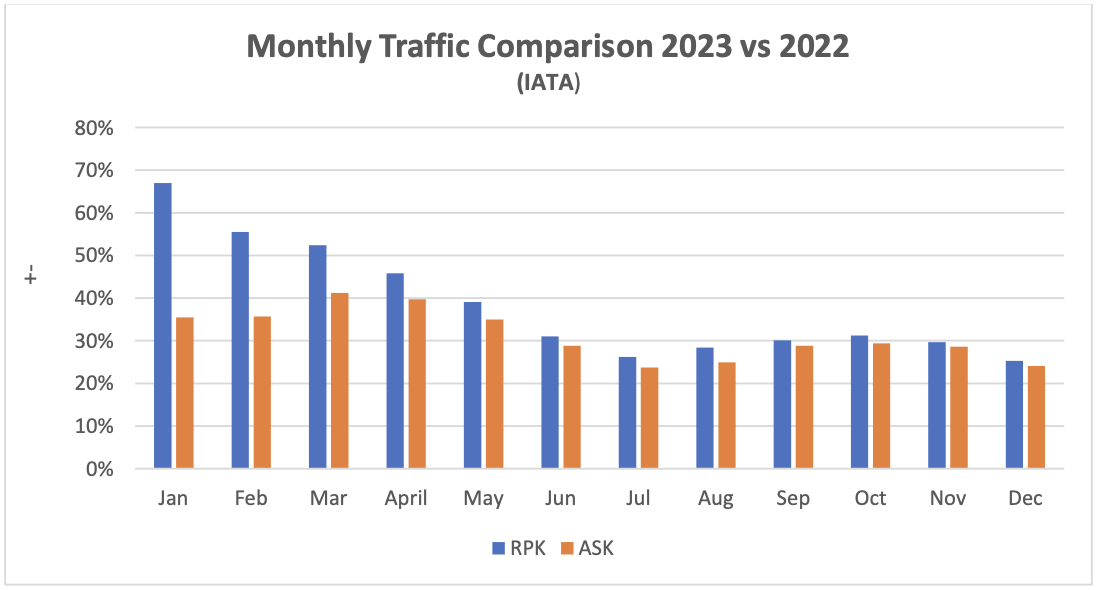

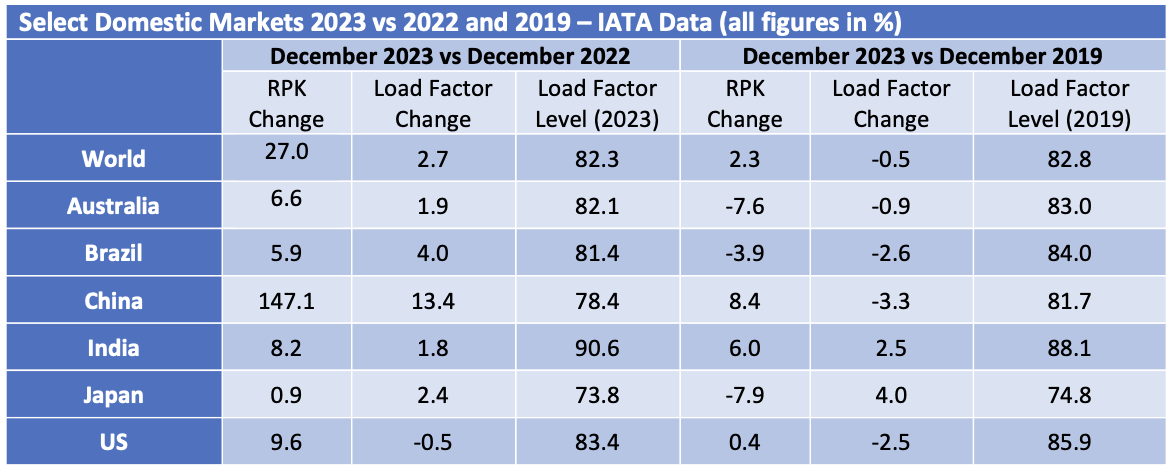
Although some short-haul aircraft serve international routes nearly all long-haul aircraft do so, and this is reflected in the relative demand for single-aisle (narrowbody) and twin-aisle (widebody) aircraft. Aircraft demand can be measured in terms of aircraft in service and ASKs, the standard measure of aircraft capacity deployed by airlines which indicates how intensively aircraft are being flown. Single aisle aircraft in service and ASK levels from Q2 2023 were ahead of the comparable period in 2019 reflecting the stronger recovery in domestic traffic. Full recovery has yet to be achieved for twin-aisle aircraft, mainly due to weak traffic to and from, and within the Asia-Pacific region. The figures by region in the tables above are based on airline domicile, so weak Europe to Asia traffic reduces recorded international RPKs in other regions.
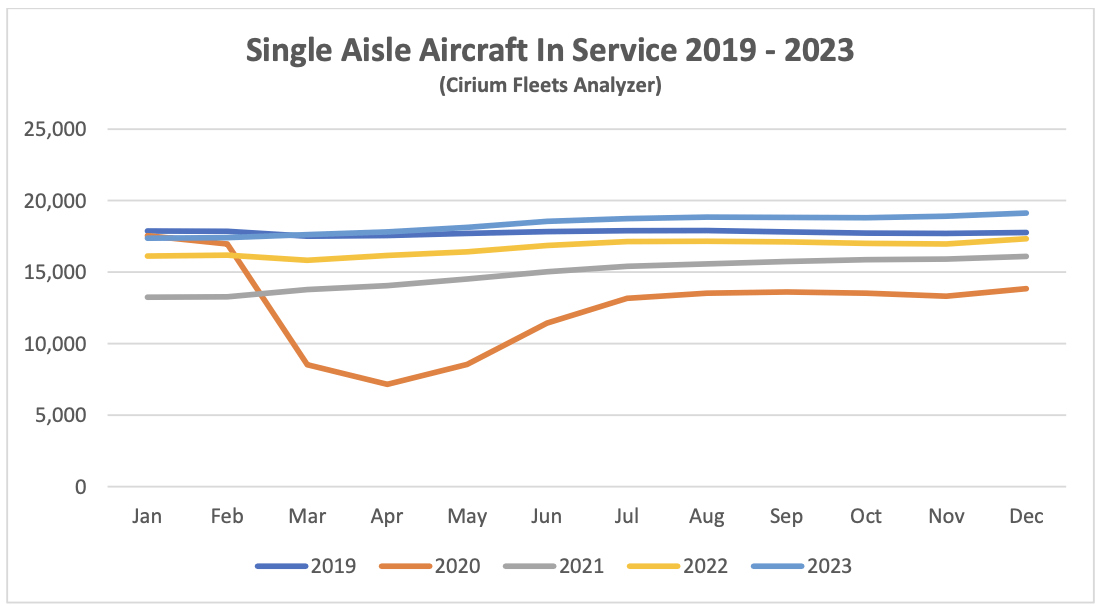
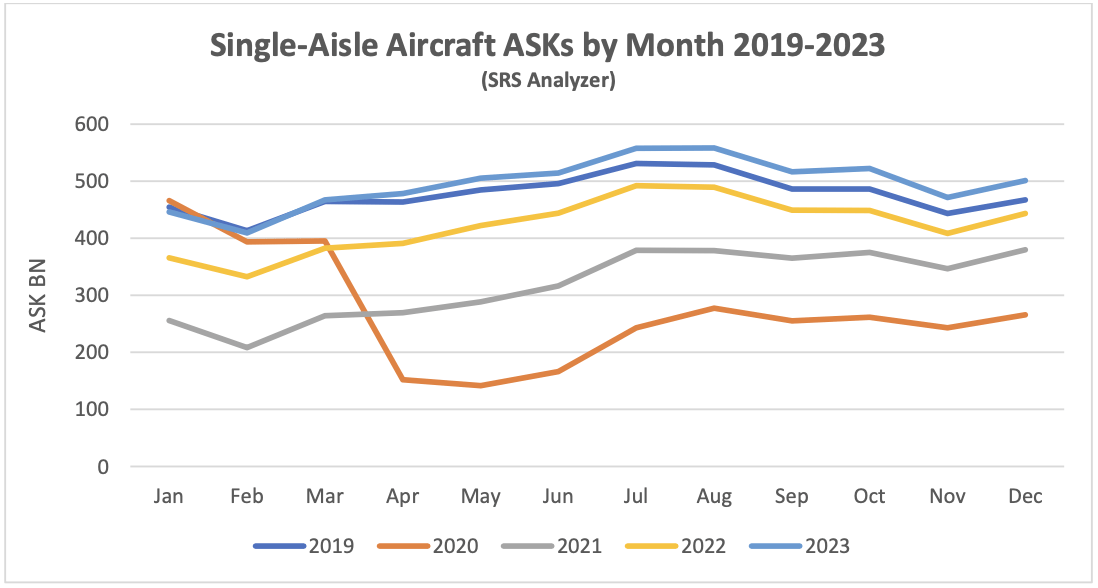
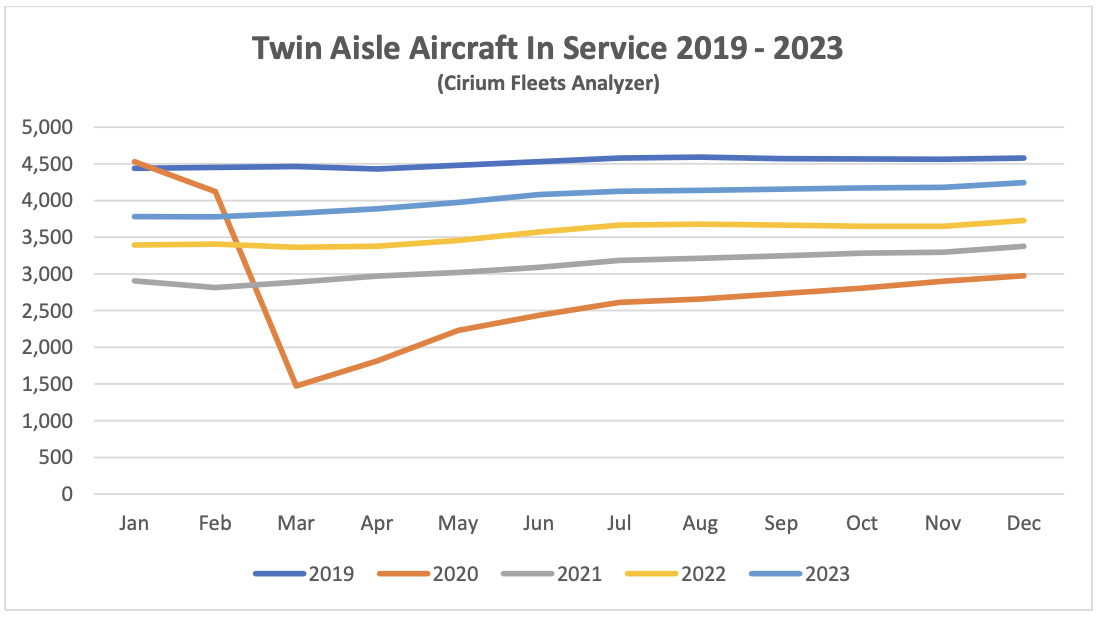
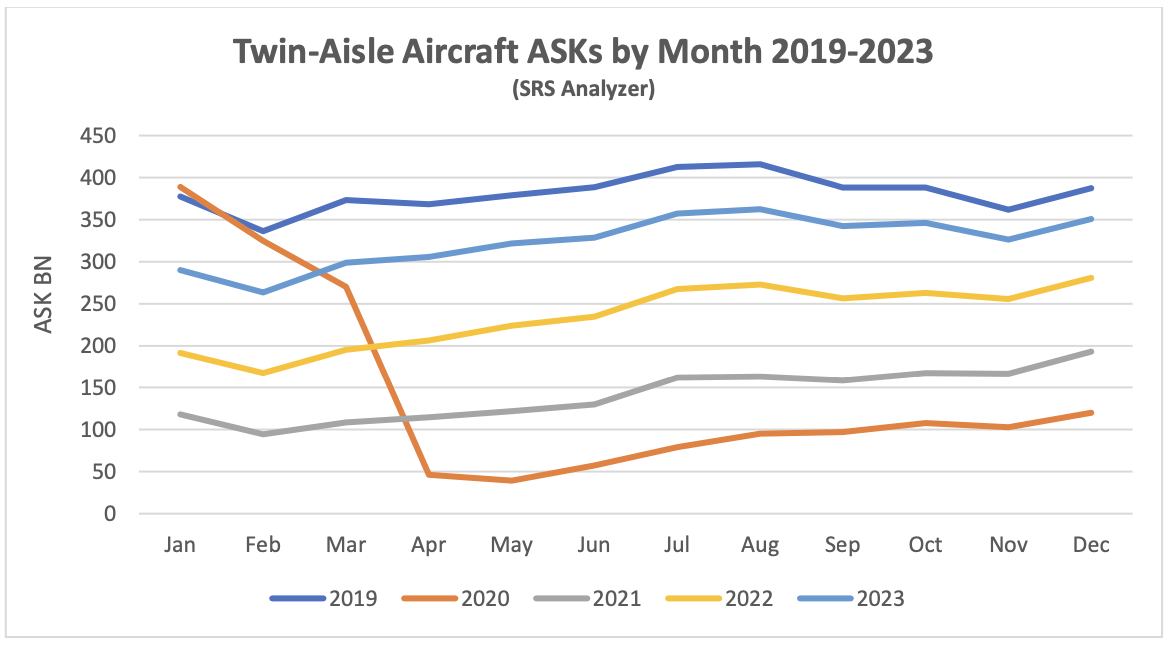
New Aircraft Supply
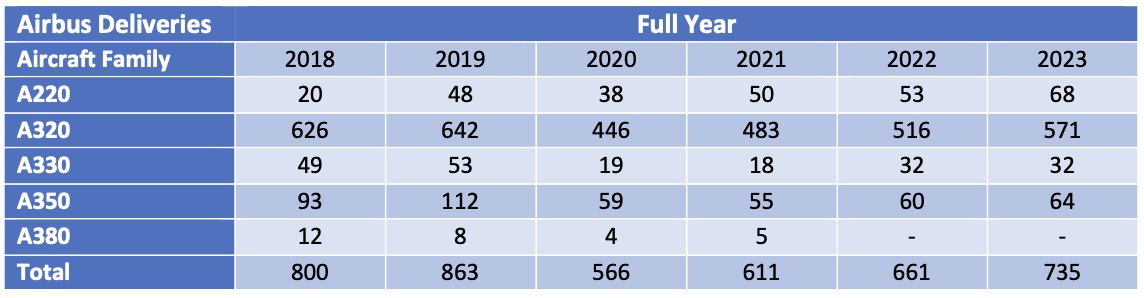
IN contrast to 2022 Airbus exceeded its delivery guidance of 720 aircraft in 2023. Management is guiding total deliveries of 800 aircraft for 2024 with most of the increase likely to come from the A320 family. The latest status of Airbus’s production plans is:
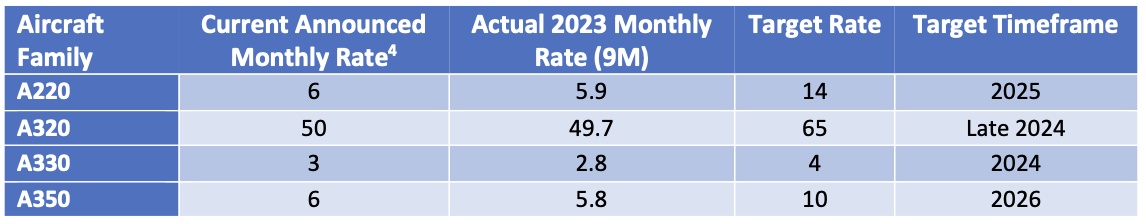
The only significant production target not captured in the table above is the objective to raise A320 family production to 75 per month by 2026.
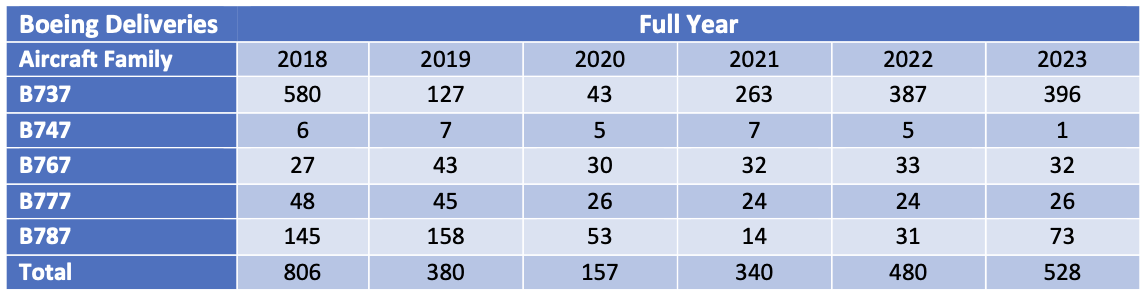
The latest status of Boeing’s production plans is:
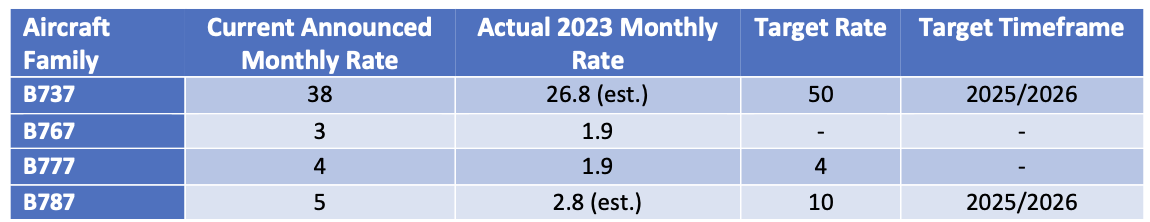
Total B737 Max deliveries in 2023 were at the upper end of the revised guidance issued after Q3. The incident with the Alaska Airlines B737-9 in January has once again created significant uncertainty around Boeing’s ability to increase production of the Max although it has reached its short-term target of 38 aircraft per month. The FAA is investigating Boeing’s quality control systems and other related matters and has announced that it will not approve any increases in production until it is9 satisfied with Boeing’s level of compliance. Boeing has also announced that it will not seek certification of the B737-7 and -10 variants until it has engineering solutions for issues with their deicing systems and there is no definite timeframe to achieve this.
B737 inventory decreased from 250 at the end of 2022 to 175 at the end of 2023, consisting of:
- 80 B737-8 aircraft due to be delivered to Chinese airlines.
- 60 B737-8 aircraft due to be delivered to other airlines.
- 35 B737-7 and B737-10 aircraft which will be delivered once certification is achieved.
Boeing plans to deliver most of these aircraft in 2024 although it will need the Chinese government to sign off on the first tranche (all aircraft previously delivered to Chinese airlines are back in service) and type certification for the third tranche.
Q1 2023 saw the delivery of the last B747 which like the B767 had not seen any passenger variants sold for several years. That has also been the case recently for the B777, but this is likely to change with the entry into service of the B777-8 and B777-9 from 2025. Boeing has also had quality and production problems with the B787, its main passenger twin-aisle offering. It suspended deliveries in May 2021 and restarted in Q3 2022. Production levels are back at 5 aircraft per month going to 10 by 2025/2026. As with the Max Boeing holds a significant inventory of undelivered aircraft - 50 at the end of Q4 vs 100 at the end of 2022. Boeing has said it expects to deliver most of them in 2024.
The number of commercial jets delivered by OEMs other than Airbus and Boeing remains subdued. Although there is a gradual upward trend in deliveries from Chinese manufacturers (ARJ 21 and C919 models) these are likely to be confined to Chinese airlines for the foreseeable future.
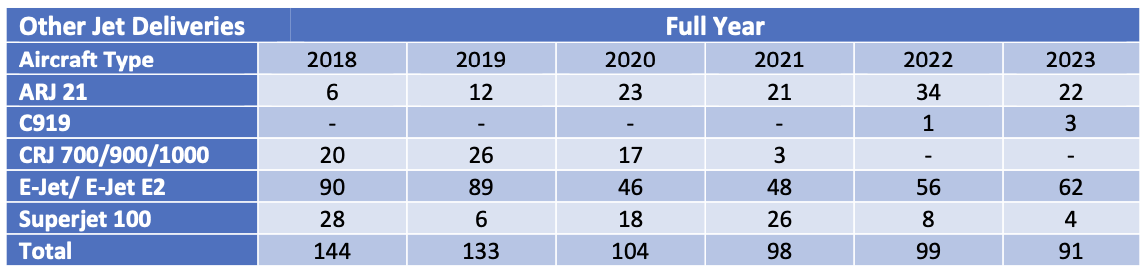
Airline Industry Financial Performance
IATA released a new airline industry financial forecast in December 2023 as part of its semi-annual Global Outlook for Air Transport. Its estimated outcome for 2023 is improved relative to its forecast in June and it has forecast further improvement in 2024.
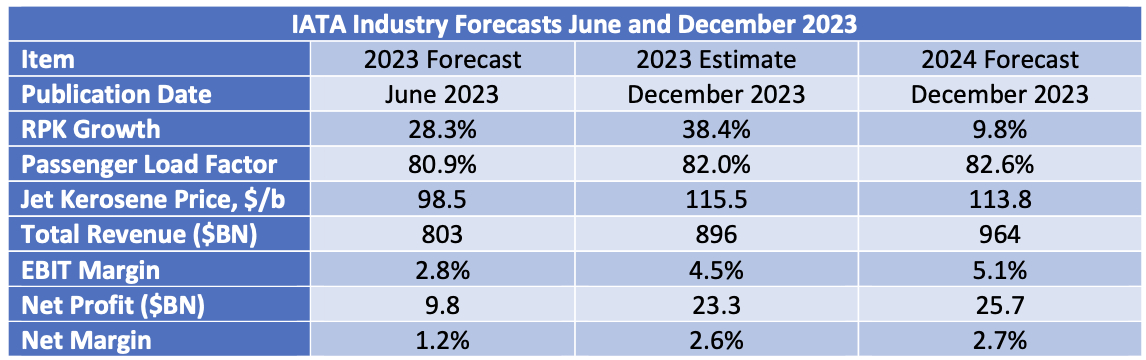
The improved outcome for 2023 is despite the average price of jet fuel remaining c. 20% higher than expected in the middle of the year, mainly because the “crack spread” did not reduce as anticipated. The forecast for 2024 shows a minimal reduction in the cost of fuel and is in line with the current market.
The outlook by region shows more convergence in traffic growth in 2024 largely because the 2023 baseline is less effected by the pandemic than 2022. Profitability continues to vary sharply by region, with reasonable performance in Europe, the Middle East, and North America but not elsewhere.
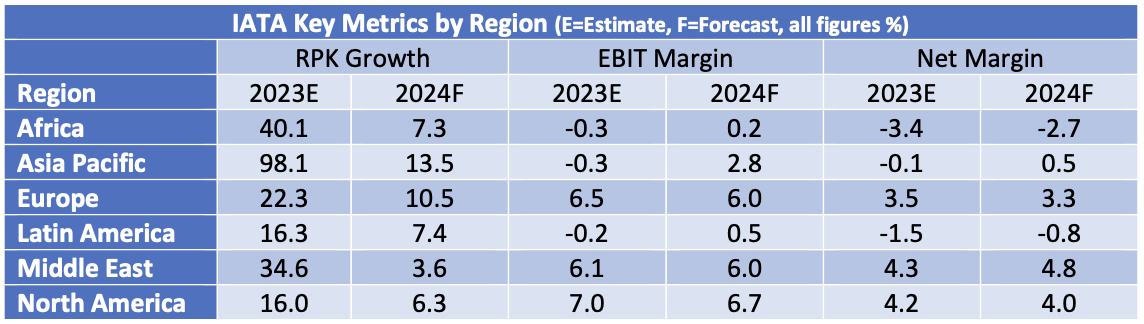
Airline share prices have recovered somewhat since Q4 2023. The sell-off from the middle of the year was caused by various investor concerns include the potential softening of airlines pricing power, increased costs especially fuel and maintenance, and in some cases operational disruption caused by requirements for increased engine maintenance. These concerns have been offset by slightly lower fuel prices and a positive earnings season for US airlines
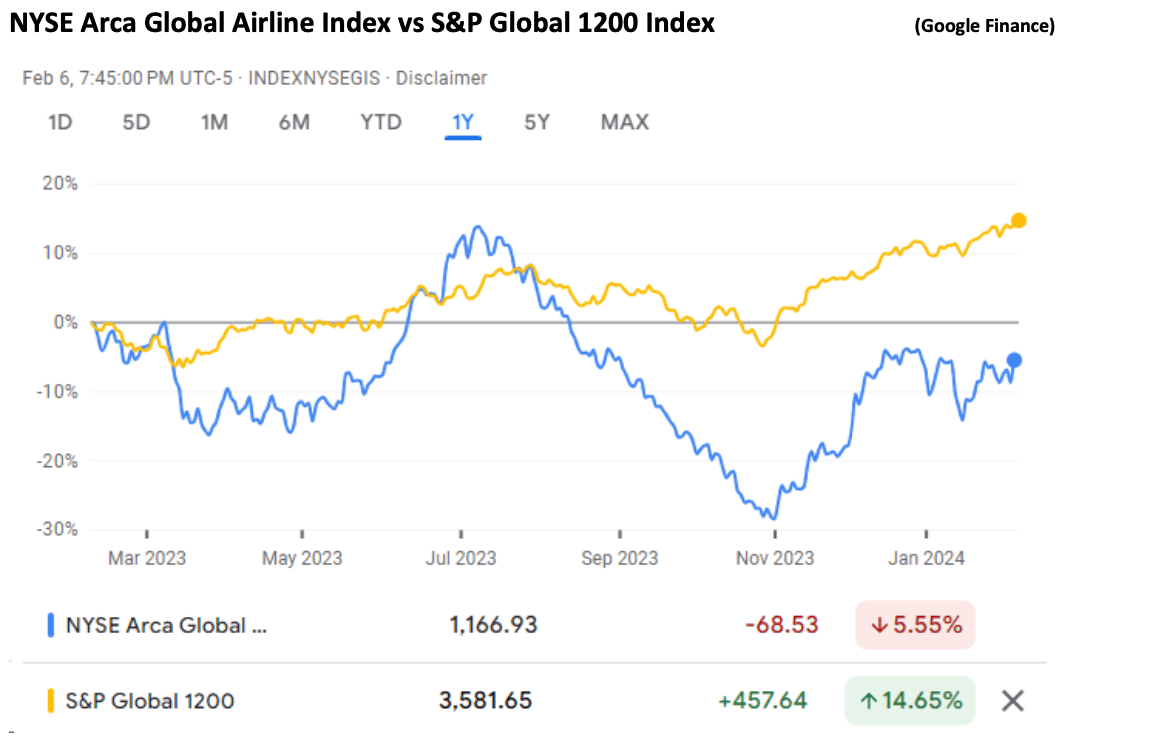
The largest airline to fail in 2023 was Go First of India. In its bankruptcy filing the airline declared its main problem was the need to ground about half its A320 Neo fleet due to problems with the PW1127G engine (see above). Viva Air suspended operations citing financial problems caused by the uncertainty around approval by the Colombian government of its acquisition by Avianca. Flyr filed for bankruptcy because of liquidity problems. iAero Airway’s Chapter 11 filing in September is not as financially significant as the number of aircraft involved might suggest – its fleet of 43 aircraft was on average 28 years old and the airline was a marginal provider of capacity through the ACMI market[5].
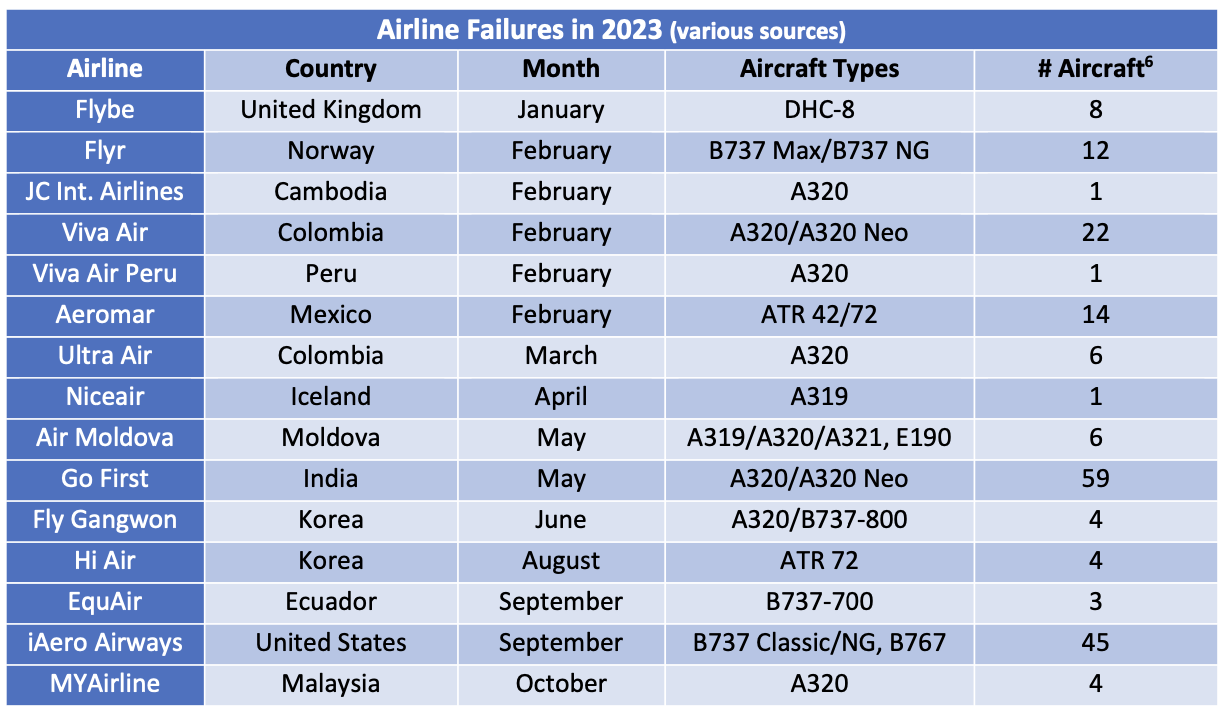
In last quarter’s update we highlighted the significant amounts being received by aircraft lessors from Russian financial institutions through the purchase of aircraft that were expropriated in 2022. There have been more such payments in the last three months and the recipients have included a broader range of aircraft owners including Aircraft ABS vehicles. Litigation by aircraft owners against the providers of war risks and contingency insurance policies continues; this is likely to provide additional compensation, but the timing is uncertain.
Special Topic – Airline Industry Default History
Sirius produces proprietary estimates of global airline defaults because we think there are important issues around credit risk that arise at the industry level as well as at the level of the individual airline, and we cannot find any alternative source with the coverage we would like. The rating agencies produce historical statistics by industry, but their universe of rated airlines is quite small (typically 25-30 airlines at any given time) as they only cover airlines that make use of debt capital markets.
Our study has some limitations mainly driven by practicality. We only cover airlines that have operated more than 5 passenger jet aircraft at any time since 1970 according to Cirium Fleets Analyser. This reduces the number of airlines we need to research from 2,793 with no size cut-off to 1,146, but we still cover 98% of the passenger jet fleet by units. We also limit our statistical analysis in time to start in 1990 because we believe that certain key characteristics of the industry changed around this time, notably deregulation and the rise of aircraft leasing as a key source of capital.
We due diligence each airline and record defaults captured by this research. We also add defaults for airlines in emerging market countries that experience sudden fleet reduction (20% for airlines with more than 15 aircraft, 3 aircraft if smaller), as these may well represent informal defaults that occur without court proceedings. Our final output is adjusted defaults which combines both research and rules-based defaults after eliminating mergers and double-counts. The number of adjusted defaults is c.50% higher than for research-based defaults. We measure adjusted defaults based on the number of airlines and the number of affected aircraft. There is a fuller description of our methodology in the appendix to this quarterly update.
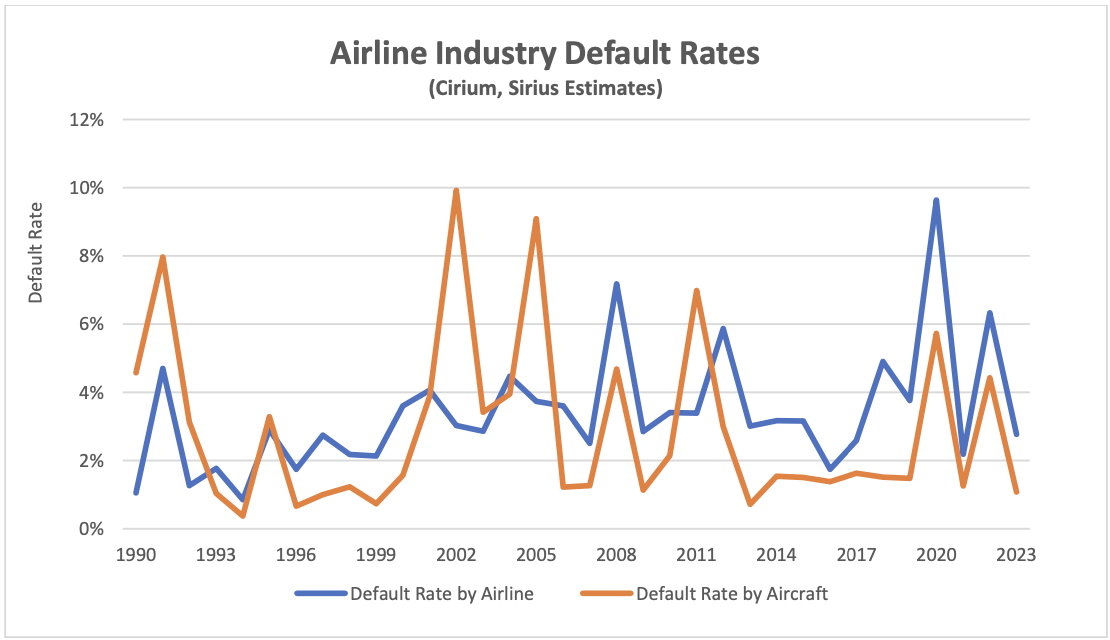
The main cause of the variation between the two default rates is the impact of large US airlines going into bankruptcy. In years where this does not happen the default rate by airline is higher than the default rate by aircraft because on average smaller airlines are more likely to default. In the interests of brevity this discussion will focus on defaults by airline - for our key conclusions defaults by affected aircraft give different but overall, quite similar results.
2023 saw a return to a more normal level of defaults following the shocks of the pandemic in 2020 and Russia’s expropriation of lessor-owned aircraft in 2022. Although 2020 was a record year for defaults there were also significant rent deferrals granted by lessors to airlines which can reasonably be considered as additional payment delinquency that is not captured by our methodology. As most of these deferred amounts have been repaid this was a strong case of enlightened self interest on the part of the lessors, although this is clearer with hindsight than it was at the time. One should bear in mind that the nature of a lessor’s credit exposure to an airline is different to that of an unsecured lender because the lessor typically has the benefit of asset ownership and a lease security package that may include cash security deposits, letters of credit and other features. This has allowed lessors to grant significant forbearance to airlines at various other times as well as the extreme case of 2020-2021.
One notable feature of our estimated default history is that it is not highly correlated with traffic growth. The chart above compares the default rate by airline with traffic growth for every year where defaults were above average with the highest default rates on the left. Traffic declined in only 3 of the twelve years concerned, and the year 2012 is particularly interesting with the fourth highest level of defaults despite robust 5.9% growth in RPKs. One explanation for this may be a hangover effect with airlines weakened by the economic downturn occasioned by the financial crisis finally defaulting due to specific problems unrelated to the industry cycle. There are many airlines that have yet to rebuild their balance sheets after the pandemic and a consequent risk of something similar happening in the next few years.
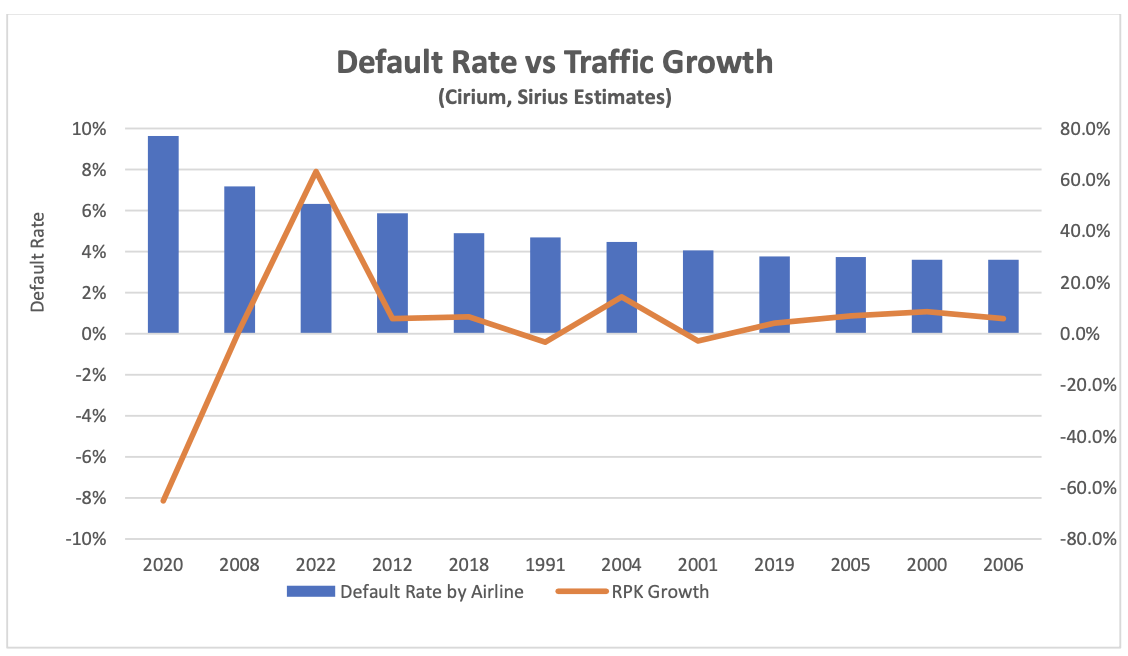
Another significant and related result of our analysis is that default rates by region are not strongly correlated as can be seen in the table below. This should not really be surprising as analysis of traffic growth and airline profits by region shows a similar pattern. We believe this lack of correlation is a key explanation of how the aircraft leasing industry remains financially robust despite serving a single relatively risky industry.
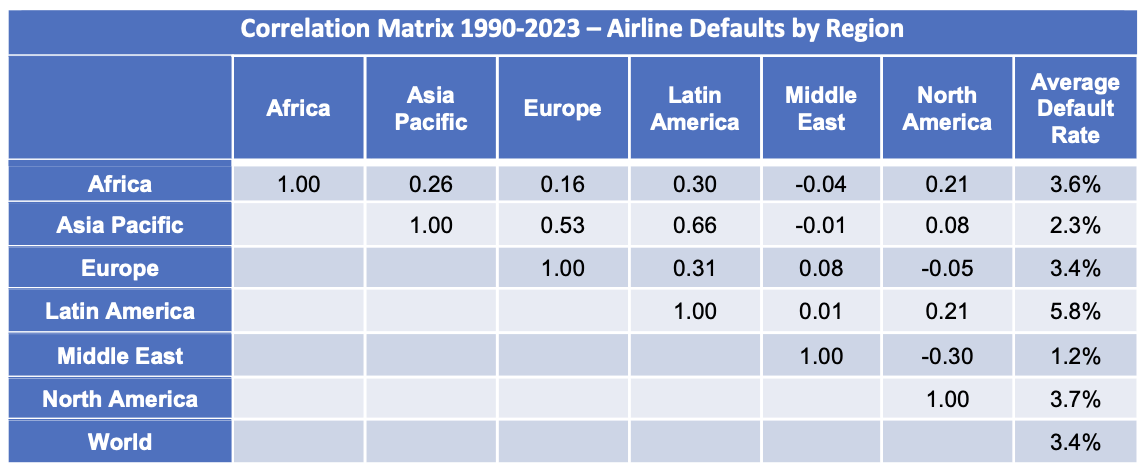
We also sought to see what impact airline size has had on default rates. To do this we divided airlines into quintiles based on size as measured by number of seats, with each quintile representing roughly the same number of airlines. The chart below shows the population of airlines by quintile which has been quite stable since the late 2000s. During this period, bigger airlines have grown faster than smaller airlines resulting in a more concentrated industry.
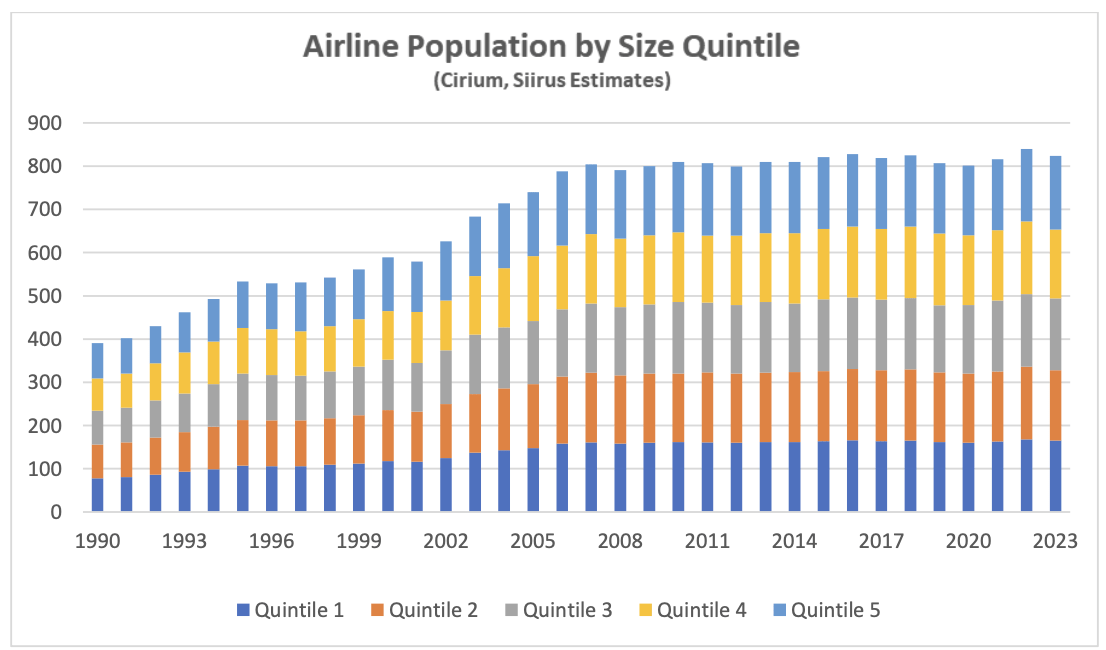
The default rates by quintile are visually confusing but the numbers in the following table help to put some structure around the results.
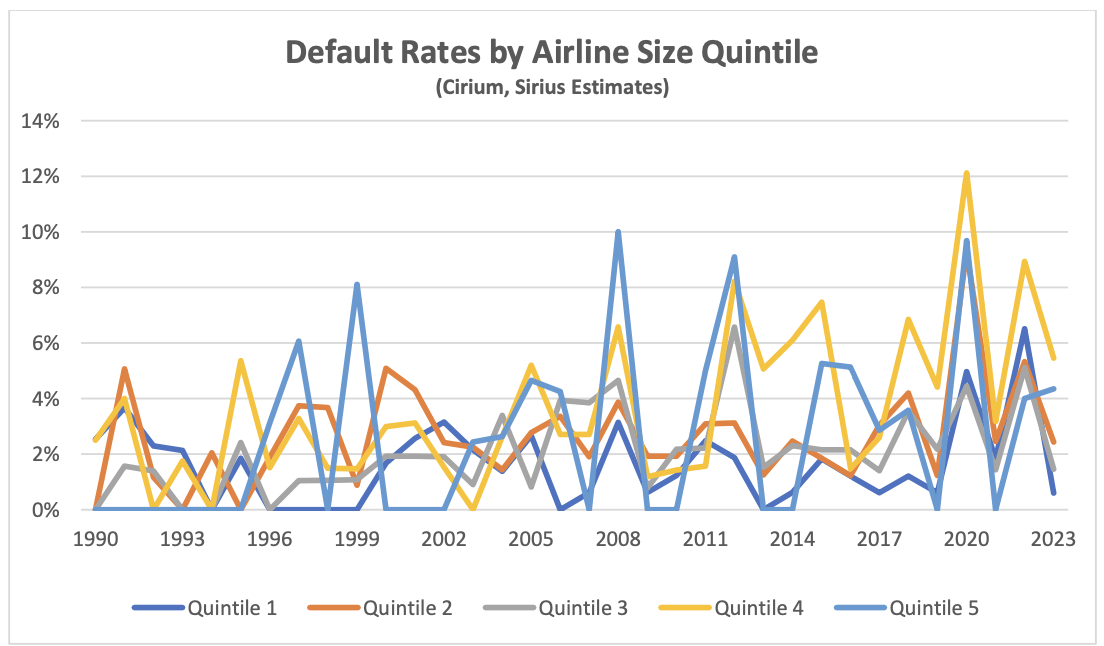
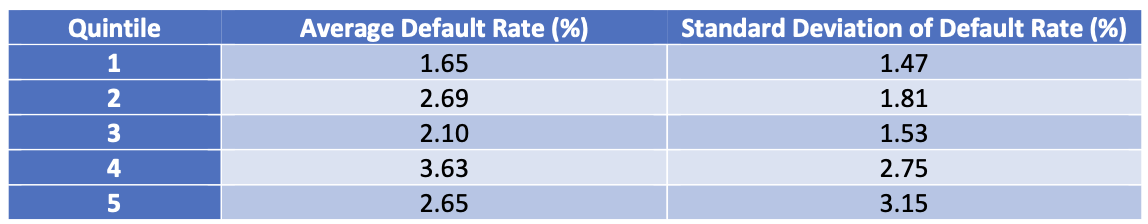
The table shows that the biggest airlines have the lowest and least volatile default level – volatility matters because it is harder to manage a default rate that is “spiky”. Once we go to the other quintiles there is no observable relationship between size and default rate, but there is a definite upward trend in volatility as airlines become smaller. Overall, our analysis suggest size has a limited influence on creditworthiness, and it would be wrong to assume that the lower default rate for larger airlines makes them “investment-grade” by a flawed analogy with credit ratings. The airlines in Quintile 1 have a default rate of 1.7% vs 3.4% for all airlines – for purposes of comparison the average default rate for Moody’s investment-grade bond issuers was 0.1% p.a. vs 4.3% p.a. for speculative-grade for the same period.
It’s also worth considering whether a broader data set might have implications for how the rating agencies look at the credit status of the airline industry. Although the universe of airlines with public ratings is small, the rating agencies conduct a lot of private ratings as part of rating aircraft ABS transactions. Although these private ratings remain confidential, general feedback is typically that average credit ratings for the airlines in these portfolios is “high B/low BB” i.e. middling speculative grade.
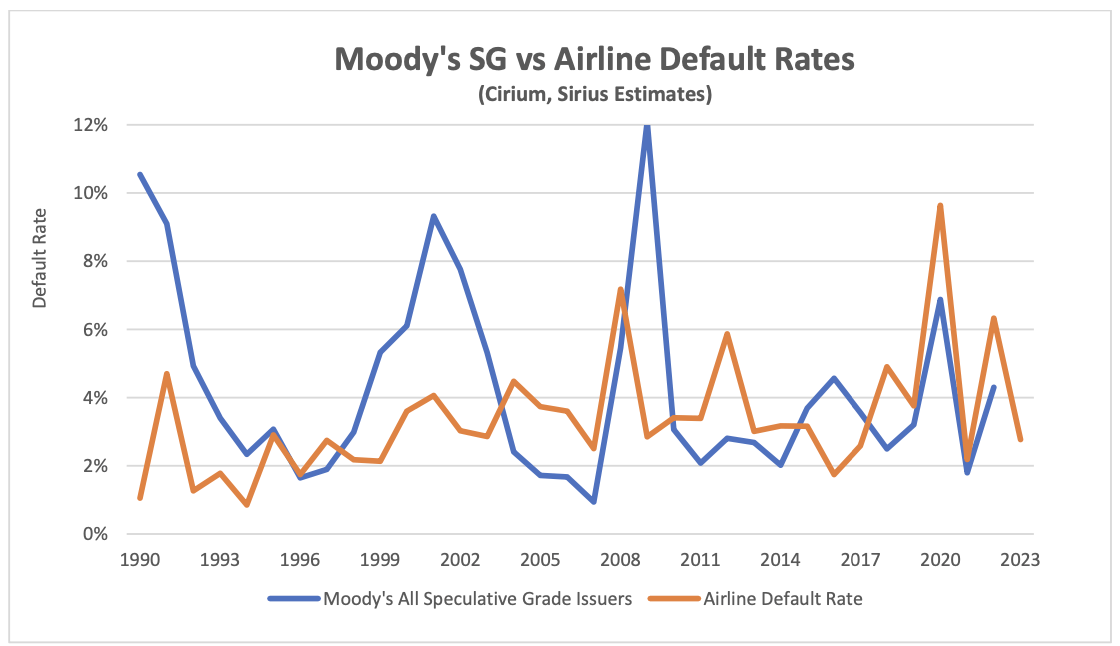
A comparison of our estimated airline default rate with the default rate for all bond issuers rated speculative grade by Moody’s shows airlines with both a lower default rate (3.4% p.a. vs 4.3% p.a.) and lower volatility (1.8% standard deviation vs 2.8%). It looks unlikely that the rating agencies are being overly optimistic about airline credit quality, but the most striking difference arises in volatility where it seems the benefit of geographical diversification more than offsets the benefit of industry diversification (we assume that the Moody’s issuer universe is concentrated in the US). It is worth reiterating our previous comment the limitations on making fair comparisons between our airline default estimates and historic bond defaults, but these results are striking none the less.
Appendix – Airline Industry Default Study Methodology
- Airline fleets data source is Cirium Fleets Analyzer
- Airline population limited to airlines with 6 or more aircraft at year end during study period
– There are 1,146 airlines that had a fleet of 6 or more aircraft out of 2,793 total airlines - Historic default events are Research based or Rules based.
- Research based events are derived from study of relevant academic/government publications and online resources (Airlines for America, Wikipedia)
o Single airlines can default on multiple occasions
o Cessation/suspension of operations assumed to result in default unless there is clear evidence that this was not the case
o Every single airline with its own licence (“AOC”) counts as a default e.g., both the LATAM and Avianca groups filed for bankruptcy in 2020, and as a result each of their subsidiaries, which also had distinct licences, experienced a default and is counted separately. - A Rules based event only occurs for airlines based in an emerging market country (per World Bank classification) where default processes are assumed to be more informal. A Rules based event occurs if:
o An airline with 15 or more aircraft has a year-on-year fleet reduction of 20% or more, or
o An airline with less than 15 aircraft has a year-on-year fleet reduction of 3 or more aircraft
o Some events are eliminated if research shows there clearly was no default i.e. Copa Airlines Colombia - An airline cannot default two years in a row e.g. bankruptcy shortly followed by cessation of operations is treated as a single default
- Adjusted Defaults by Airline are the combination of Research Based and Rules Based events which are filtered to eliminate mergers and duplication of events.
- Adjusted Defaults by Aircraft take the fleet size the year before the defaults occurs, not the max fleet size for the airline.
[1] The crack spread is the difference between the price of crude oil and refined products such as jet fuel.
[2] RPKs is the acronym for revenue passenger kilometres, which is the product of the number of paying passengers times distance flown.
[3] ASKs is the acronym for available seat kilometres, which is the product of the number of available seats flown times distance flown.
[4] Airbus normally quotes its production rates based on an 11.5-month year for single-aisle aircraft.
[5] ACMI stands for Aircraft, Crew, Maintenance, and Insurance and is also known as wet leasing and/or damp leasing.
[6] Fleet numbers are as of December 31st, 2022.
Disclaimer
This Presentation has been made to you solely for general information purposes and is not intended to provide, and should not be relied upon for legal, tax, accounting, investment, or financial advice. This Presentation is not a sales material and does not constitute or form any part of any offer, invitation or recommendation to the recipient, its affiliates or any other person to underwrite, sell or purchase securities, assets or any other product, nor shall it or any part of it form the basis of, or be relied upon, in any way in connection with any contract or transaction decision relating to any securities, assets or any other product. None of Sirius, its affiliates or shareholders shall have any responsibility or liability to the recipient, its affiliates, shareholders or any third party in relation to this Presentation or any other document or materials prepared by Sirius or its affiliates, officers, directors, employees, advisers or agents. Sirius and its affiliates, officers, directors, employees, advisers and agents have taken all reasonable care to ensure that the information contained in this Presentation is accurate. Neither Sirius nor any of its affiliates, officers, directors, employees, advisors or agents has any obligation to update this Presentation. Under no circumstances should the delivery of this Presentation, irrespective of when it is made, create an implication that there has been no change in the affairs of the entities that are the subject of this Presentation. This Presentation may be updated and amended by a supplement and, where such supplement is prepared, this Presentation will be read and construed with such supplement. The statements herein which contain such terms as "may", "will", "should", "expect", "anticipate", "estimate", "intend", "continue" or "believe" or the negatives thereof or other variations thereon or comparable terminology are forward-looking statements and not historical facts. No representation or warranty, express or implied, is made as to the fairness, accuracy or completeness of such statements, estimates and projections. The recipient should not place reliance on any forward-looking statements. Neither Sirius nor its affiliates undertakes any obligation to update or revise the forward-looking statements contained in this Presentation to reflect events or circumstances occurring after the date of this Presentation or to reflect the occurrence of anticipated events. The information set out in this Presentation has been prepared by Sirius based upon various methodologies and calculations which it believes to be reasonable and appropriate. Past performance cannot be a guide to future performance. In preparing this Presentation, Sirius has relied upon and assumed, without independent verification, the accuracy and completeness of all information available from public sources or which was provided to it or otherwise reviewed by it. This Presentation supersedes and replaces any other information provided by Sirius or its affiliates, officers, directors, employees, advisers or agents in respect of the content of the Presentation. No information or advice contained in this Presentation shall constitute advice to an existing or prospective investor in respect of his personal position. None of Sirius, its affiliates, its or its affiliates’ officers, directors, employees or advisers, connected persons or any other person accepts any liability whatsoever for any loss howsoever arising, directly or indirectly, from this Presentation or its contents.

Industry Update Q3 2023
Macro-Economic Background
The IMF’s latest update to its World Economic Outlook (October 2023) shows a marginal improvement from their April update. The IMF’s discussion of the world economy centres on the impact of central banks’ efforts to control inflation which is causing moderately low growth by historical standards. This situation is expected to persist through 2024.
Global economic growth is a key driver of long-term growth of air travel. However, since early 2022 its impact has been overshadowed by the fall and recovery in traffic associated with the Covid 19 pandemic. As recovery is largely complete the influence of overall economic conditions on air travel is likely to reassert itself.
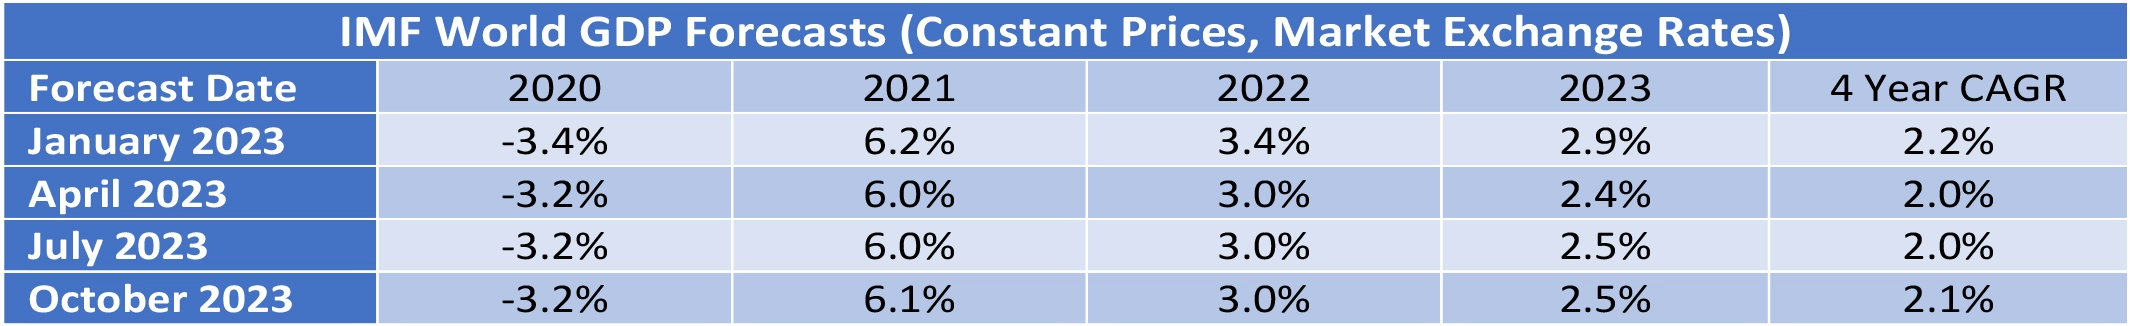
The US Dollar has weakened since its recent peak in September 2022, providing relief for airlines outside the US for dollar-denominated costs such as fuel, aircraft rents and aircraft spares.
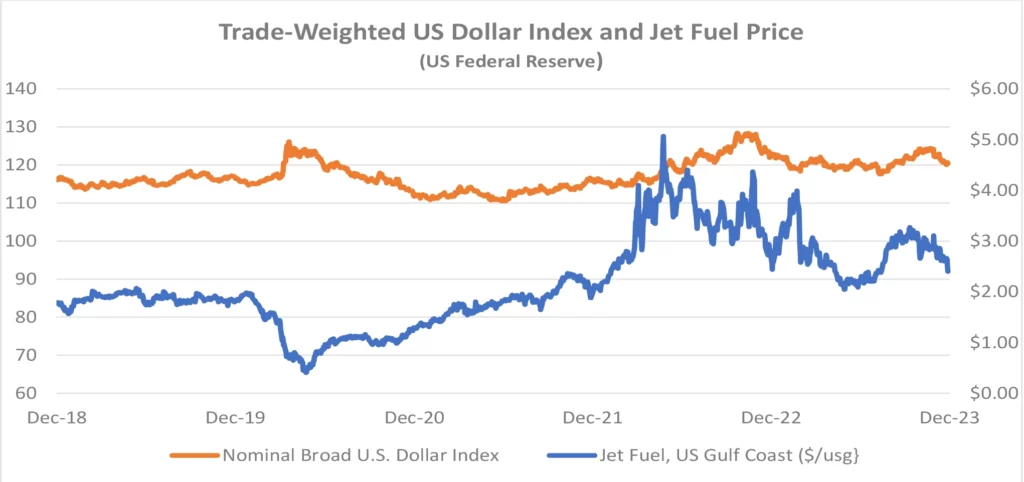
The price of jet fuel has fallen back after a sharp increase through September. The IATA chart below shows that a key characteristic of current jet fuel market conditions is the historically high level of the “crack spread”[1]at over $30 per barrel. Some of the issues that have contributed to this increase include the pace of traffic recovery, especially in Asia Pacific, and reported local refinery issues in the US and Europe. It seems reasonable to expect that the crack spread will reduce over time but with a lot of volatility around this trend.
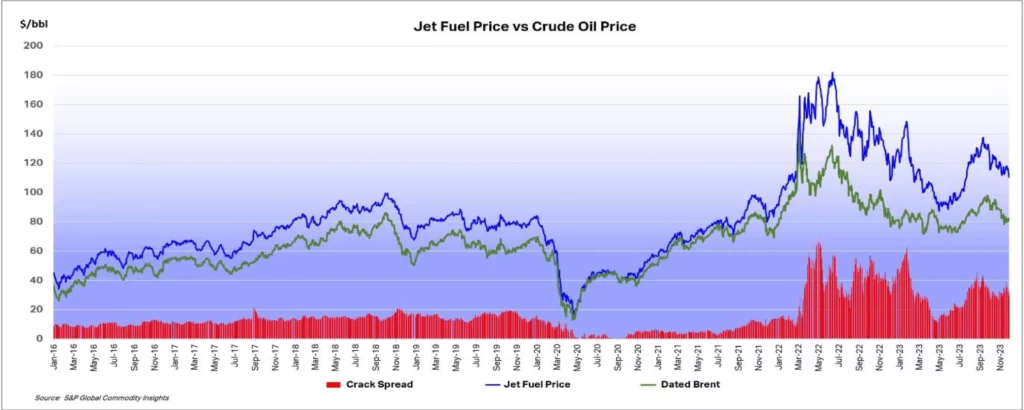
Another indicator that is potentially important to aircraft investors is the breakeven inflation rate on US Treasury Inflation-Protected Securities (TIPS). This indicator measures inflation expectations and it matters because used aircraft values are strongly influenced by the cost of new aircraft and over time this cost is linked to US Dollar inflation. In the short term this linkage is driven by escalation clauses in aircraft purchase contracts and in the long term by the general input cost environment for the aircraft manufacturers. The chart below compares the breakeven rate for 10-year and 5-year TIPS
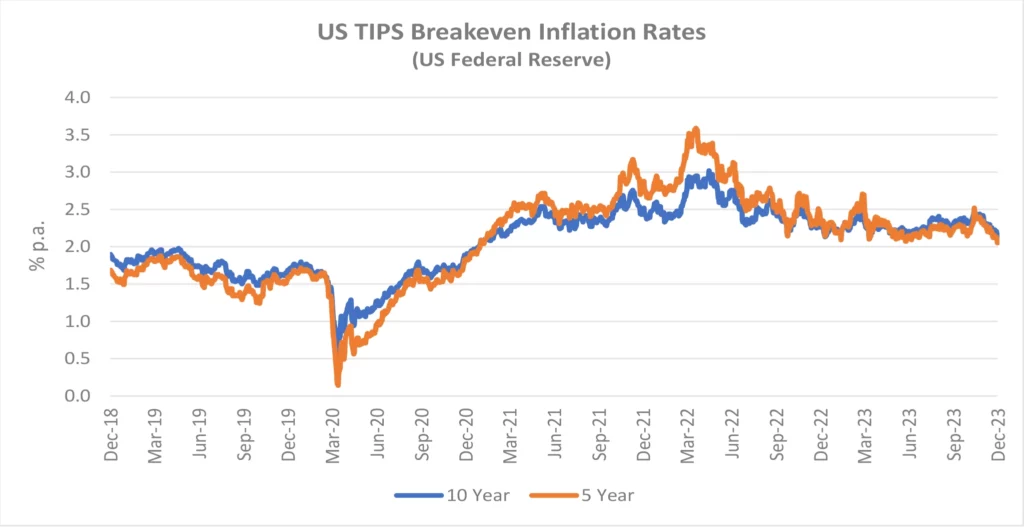
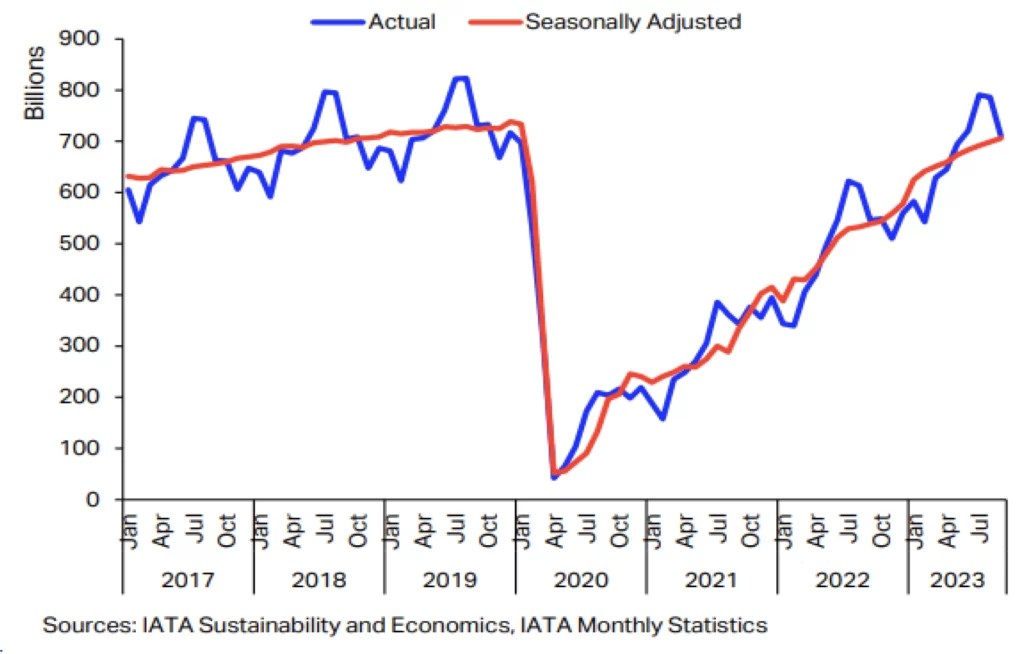
The strong recovery in air travel from the start of 2022 has continued through 2023 and overall RPKs for the month of September were only 2.7% below the comparable figures for 2019. Asia Pacific was the strongest performing regions as government restrictions (especially in China) were finally relaxed. As in 2022, there was a much bigger increase in international traffic vs domestic traffic, mainly because the former is still coming off a much lower base.
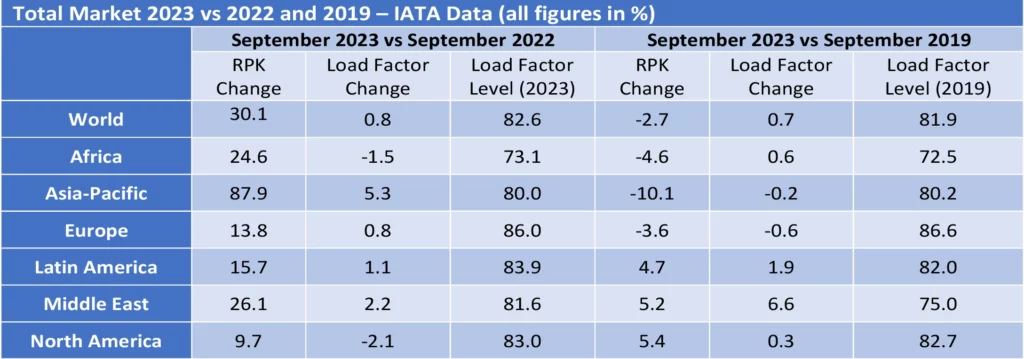
The chart below shows the changes in RPKs[2] and ASKs[3] by month and has a pattern that we expect to continue through the rest of the year. First the level of increases in RPKs gradually reduces because the year-on-year comparison is with a month in 2022 that was subject to a greater level of traffic recovery. Second the rate of increase in RPKs and ASKs becomes more alike as the recovery in load factors is largely complete, so additional capacity needs to be deployed to support further traffic growth.
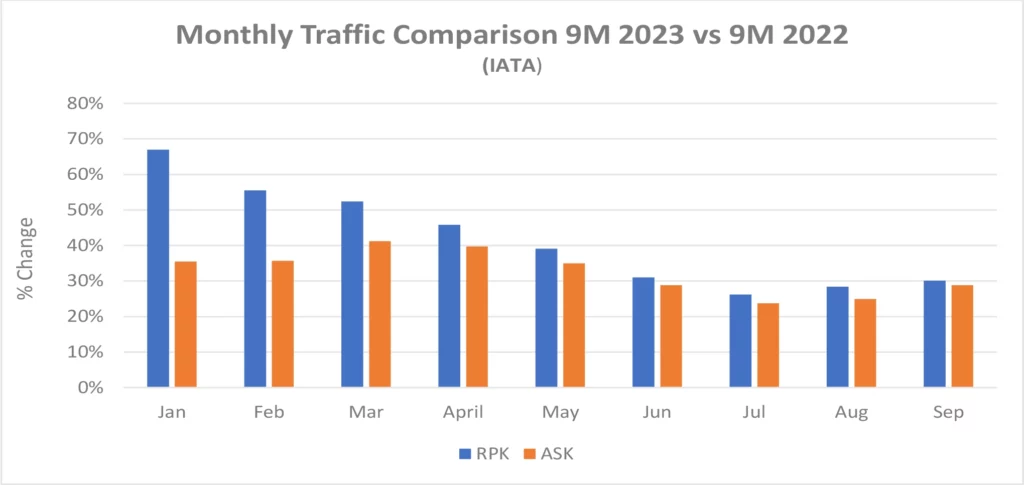
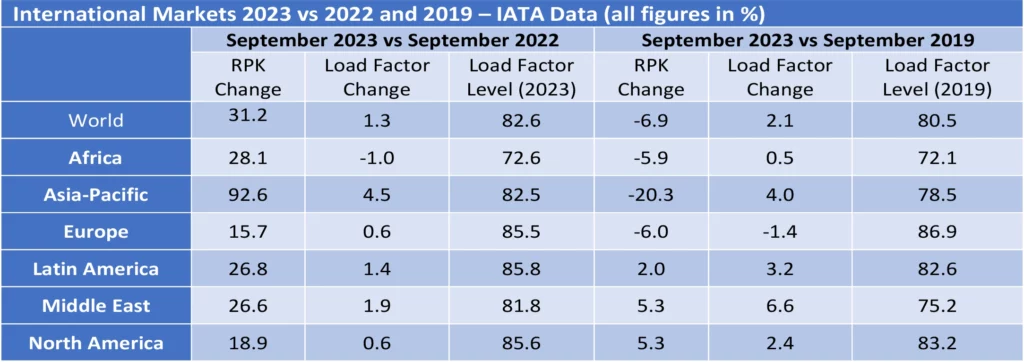
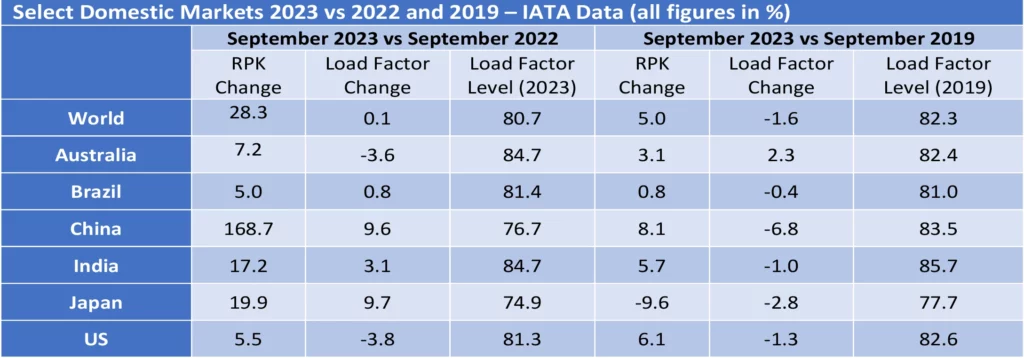
IATA’s recent reports on passenger traffic note that seven-day forward bookings have been flat-lining since early November mainly due to weakness in domestic China, but it mat be too early to call the end of the recovery given that demand in many regions remains extremely robust.
Although some short-haul aircraft serve international routes nearly all long-haul aircraft do so, and this is reflected in the relative demand for single-aisle (narrowbody) and twin-aisle (widebody) aircraft. Aircraft demand can be measured in terms of aircraft in service and ASKs, the standard measure of aircraft capacity deployed by airlines which indicates how intensively aircraft are being flown. Single aisle aircraft in service and ASK levels for Q2 2023 were ahead of the comparable period in 2019. This is consistent with the 5.1% increase in domestic traffic in June 2023 compared to June 2019.
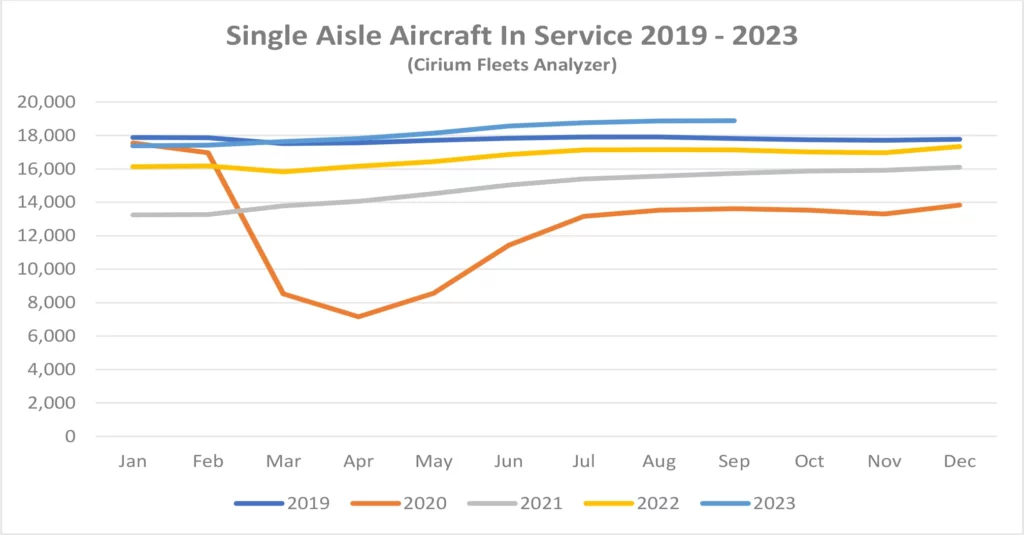
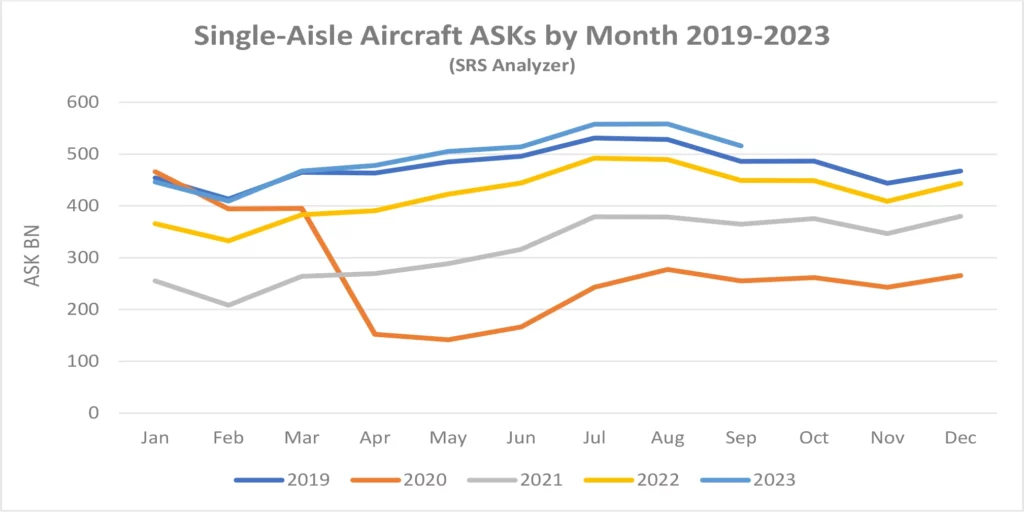
Full recovery has yet to be achieved for twin-aisle aircraft, mainly due to weak traffic to and from, and within the Asia-Pacific region. The figures by region in the tables above are based on airline domicile, so weak Europe to Asia traffic reduces recorded international RPKs in other regions. Twin-aisle aircraft in service has shown a greater improvement relative to 2019 than ASKs which suggests that aircraft are being returned to service with lower utilisation in anticipation of continued recovery.
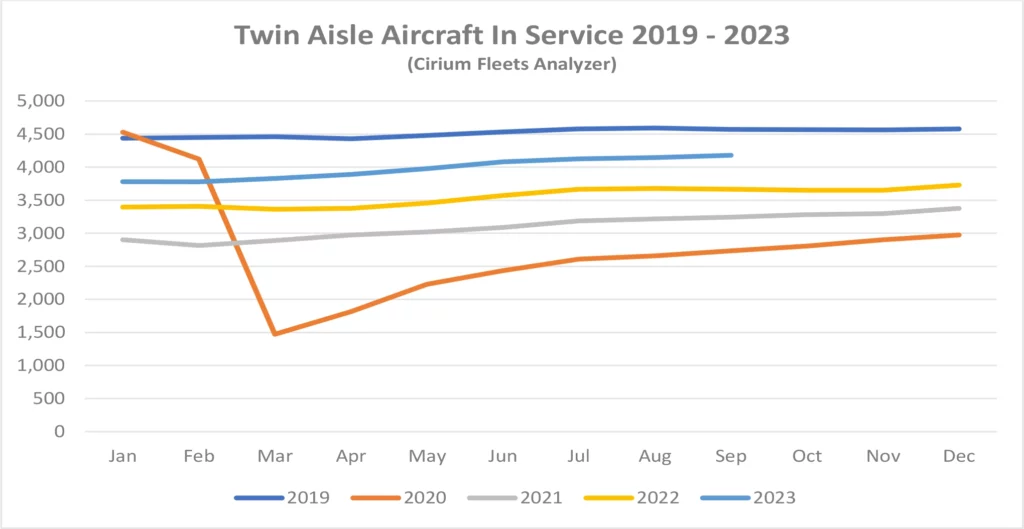
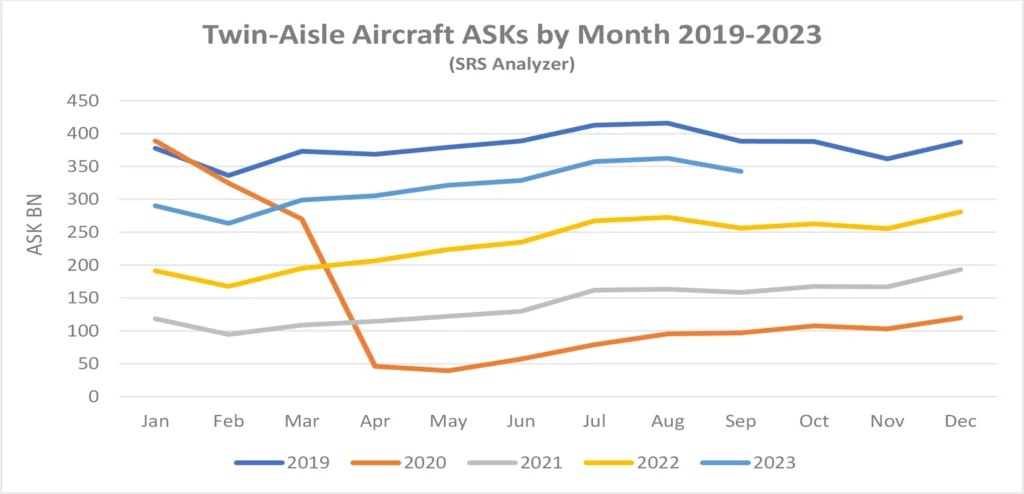
New Aircraft Supply
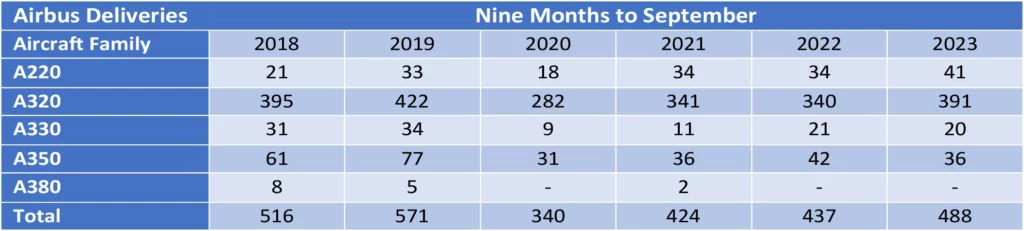
Airbus missed its 2022 delivery target significantly due to supply chain problems. Its final total of 661 aircraft compared with initial guidance of 720 It has once again set a target of 720 deliveries for 2023. This year’s guidance has a good chance of being realised as Airbus has a historic pattern of high deliveries in Q4 compared to the rest of the year and deliveries through September were 51 ahead of 2022.
The latest status of Airbus’s production plans is:
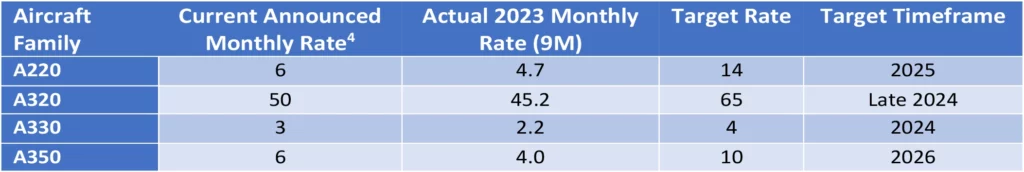
The only significant production target not captured in the table above is the objective to raise A320 family production to 75 per month by 2026.
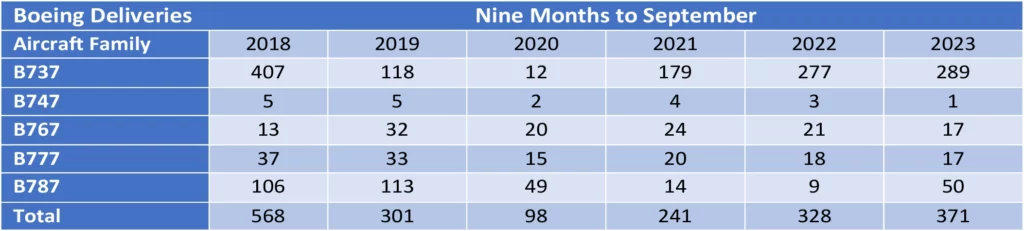
The latest status of Boeing’s production plans is:
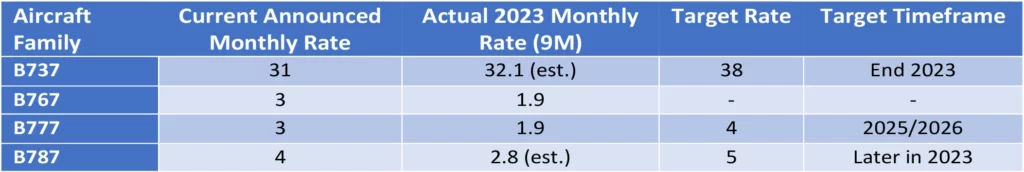
Boeing has reduced its guidance for B737 Max deliveries in 2023 from between 400 and 450 to between 375 and 400. This is mainly due to manufacturing problems such as the requirement for rework of some fuselage sections manufactured by Spirit AeroSystems. B737 inventory increased from 220 to 250 in Q3 so it is back to where it was at the start of the year. Any significant further reduction is probably dependent on their ability to restart deliveries to Chinese airlines (85 of the aircraft in inventory are contracted for delivery to China). Boeing has also announced a medium-term production target of 50 aircraft per month by 2025/2026. The FAA deadline for certification of the Max 7 and Max 10 variants has been pushed back by new legislation and they are now planned to enter service in 2024 (Boeing had previously targeted EIS for the Max 7 in 2023).
Q1 2023 saw the delivery of the last B747 which like the B767 had not seen any passenger variants sold for several years. That has also been the case recently for the B777, but this is likely to change with the entry into service of the B777-8 and B777-9 from 2025. Boeing has also had quality and production problems with the B787, its main passenger twin-aisle offering. It suspended deliveries in May 2021 and restarted in Q3 2022. Production levels for are back at 3 aircraft per month going to 5 by the end of 2023 and 10 by 2025/2026. As with the Max Boeing holds a significant inventory of undelivered aircraft - 75 at the end of Q3 vs 100 at the end of 2022. Boeing has said it expects to deliver most of them within the next two years.
The number of commercial jets delivered by OEMs other than Airbus and Boeing remains subdued.
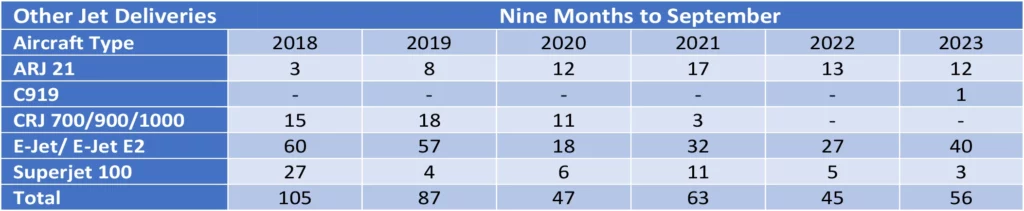
The reduction in new aircraft production by Airbus and Boeing compared to 2018/2019 has had a major impact in mitigating the impact of the pandemic on the balance of aircraft supply and demand. Major lessors such as AerCap and Aircastle have reported unusually strong demand for lease extensions of both single-aisle and twin-aisle used aircraft as airlines seek to lock in existing capacity given the uncertainty around future deliveries. These comments confirm what Sirius has seen in the market from early 2023. This quarter’s special topic discussion will cover the capacity issue in more detail.
Airline Industry Financial Performance
The most recent IATA financial forecast which was discussed in our Q1 2023 update showed upward revisions for 2023 industry net income forecasts and there have been some very strong Q2 2023 earnings reported by major European airlines.
Despite this positive background global airline share prices have been volatile in both absolute and relative terms. Recent market concerns include the potential softening of airlines pricing power, increased costs especially fuel and maintenance, and in some cases operational disruption caused by requirements for increased engine maintenance.
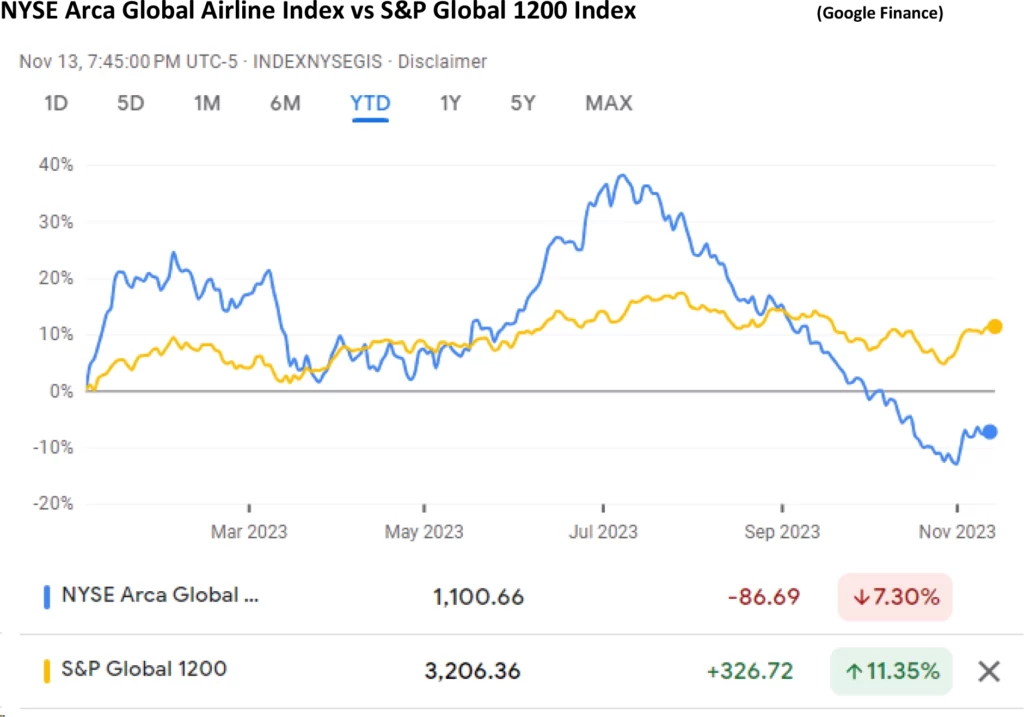
The largest airline to fail so far in 2023 is Go First of India. In its bankruptcy filing the airline declared its main problem was the need to ground about half its A320 Neo fleet due to problems with the PW1127G engine (see above). Viva Air suspended operations citing financial problems caused by the uncertainty around approval by the Colombian government of its acquisition by Avianca. Flyr filed for bankruptcy because of liquidity problems. iAero Airway’s Chapter 11 filing in September is not as financially significant as the number of aircraft involved might suggest – its current fleet of 43 aircraft is on average 28 years old and the airline was a marginal provider of capacity through the ACMI market[5].
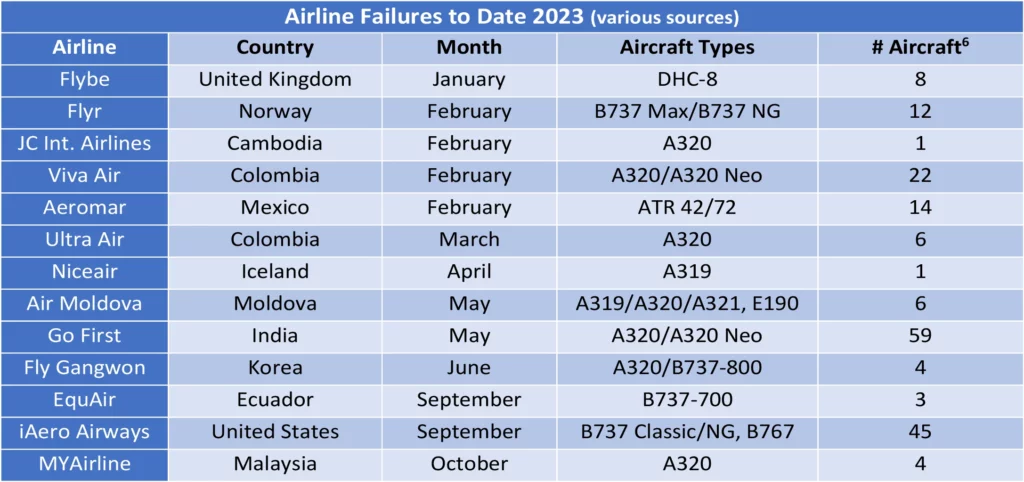
A significant new development in airline credit is a series of settlement payments by Russian insurers in respect of claims by aircraft lessors relating to the effective expropriation of their aircraft after Russia’s invasion of the Ukraine in 2022. These transactions typically involve the transfer of aircraft ownership to a Russian entity and reduce outstanding claims under other insurance policies. There is relevant government approval for all of them under sanctions legislation.
The major lessors had to write off substantially all their investment in aircraft in Russia in their 2022/2023 financial years amounting to c. $10BN in total across the industry. This very conservative approach was driven by the uncertainty of the amount and timing of recoveries under various insurance policies, including contingent risk insurance policies. These payments indicate that the additional protections the lessors procured as part of their original risk management strategy are starting to pay off in a material way.
Special Topic – How tight is airline capacity?
There is strong evidence that demand for aircraft has tightened up significantly in the last 12 months. Our regular analysis of trends in aircraft in service and ASKs supports this view, along with increases in aircraft values lease rates. These developments all reflect a cyclical recovery in traffic and in the case of lease rates a sustained rise in US$ interest rates. One unusual recent market development is the high level of lease extensions of older aircraft, both single-aisle and twin-aisle according to AerCap and other lessors.
There is an industry consensus that this focus by the airlines on access to capacity is driven by long-running disruption to the supply of new aircraft. Since 2018 Boeing has had to suspend deliveries of the B737 Max and B787 for extended periods and still retains a significant inventory of undelivered aircraft. Both Boeing and Airbus have also had significant supply chain problems leading to widespread delivery delays and missed production targets.
We agree with this view, but it is worth noting that on first look there is not a shortage of aircraft as such. As the chart below shows the total fleet of both single-aisle and twin-aisle aircraft has increased since 2017, the year before the start of disruptions to new aircraft supply. As of September 30th ,2023, the single-aisle fleet was at an all-time high of 21,102 and the twin-aisle was at 99% of its all-time high of 5,109 achieved at the end of 2019. This small decrease reflects a logical market adjustment to very high twin-aisle aircraft deliveries in the late 2010s (see our Q1 2022 Industry update for a more detailed discussion)[7].
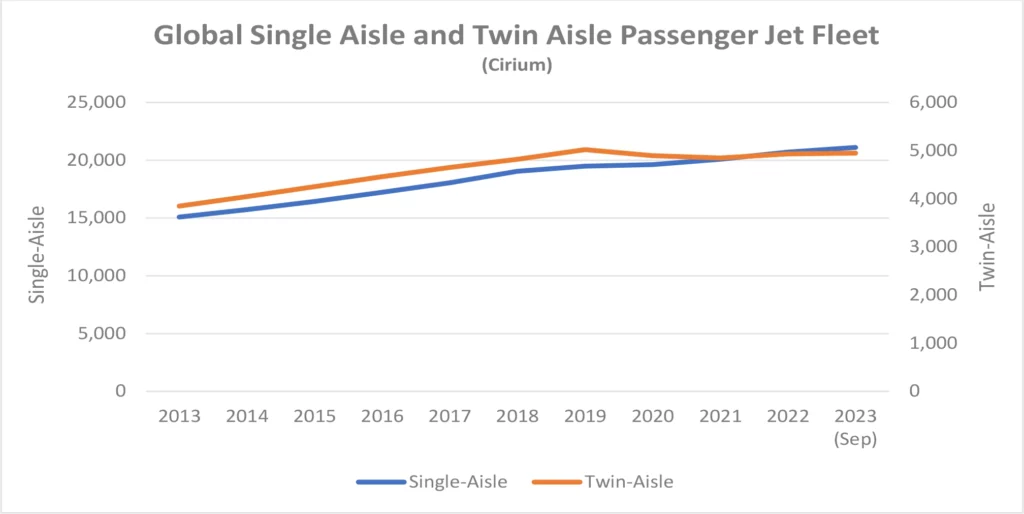
It is also unlikely that the impact of fleet age has been significant (older aircraft are more likely to be stored rather than in service and fly fewer hours when they are in service). Fleet age has increased slightly since 2017 but remains well within its historic range of 10 to 12 years old.
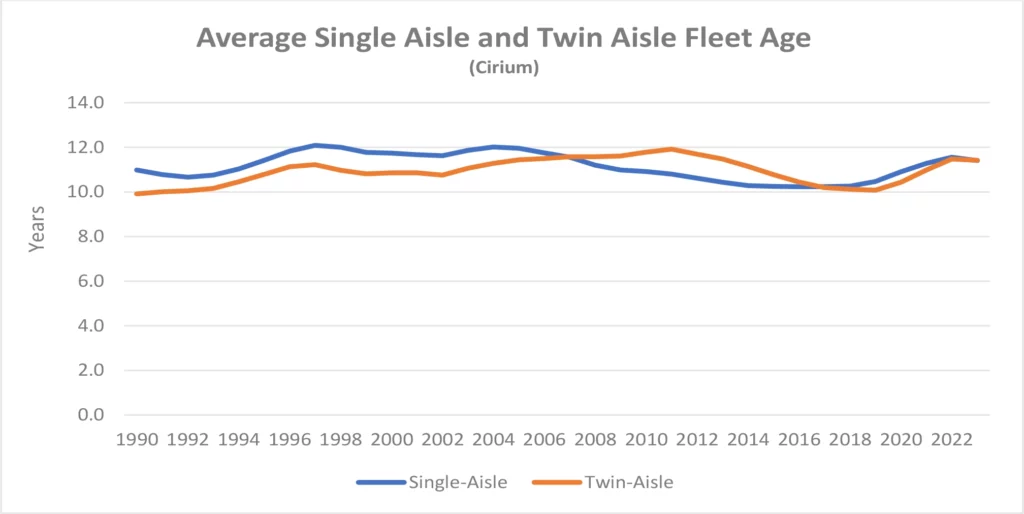
We believe that the key issue for single-aisle aircraft is a drop in productivity caused by a lack of durability and reliability for new technology engines, particularly Pratt & Whitney’s GTF. We can demonstrate this by doing a “snapshot” survival analysis. Survival curves show the percentage of passenger aircraft remaining in passenger service by age. Ultimately aircraft leave passenger service by being retired or converted to another use, predominantly freighter. Before this point there can be routine temporary exits from service for maintenance or change of operator, or non-routine storage in a market downturn.
The next chart compares the survival performance of single-aisle aircraft as of September 2023 with the average for the years 2007-2019, to capture the most recent full cycle from peak to peak as an unbiased benchmark for comparison purposes. One would expect the snapshot curve to be less smooth than a twelve-year average, but the September 2023 storage levels for aircraft less than 6 years old are very high by historical standards. It would be normal for aircraft in this age range not in service not to be in airline operation e.g., “white tails” owned by the manufacturer or repossessed aircraft owned by lessors or other financiers following an airline bankruptcy (for older aircraft a significant proportion of aircraft in storage are in maintenance or being modified for a new operator but this should not be a major factor for aircraft in this age range).In contrast to this normal pattern 337 of the 385 stored single-aisle aircraft (88%) are operated by airlines.
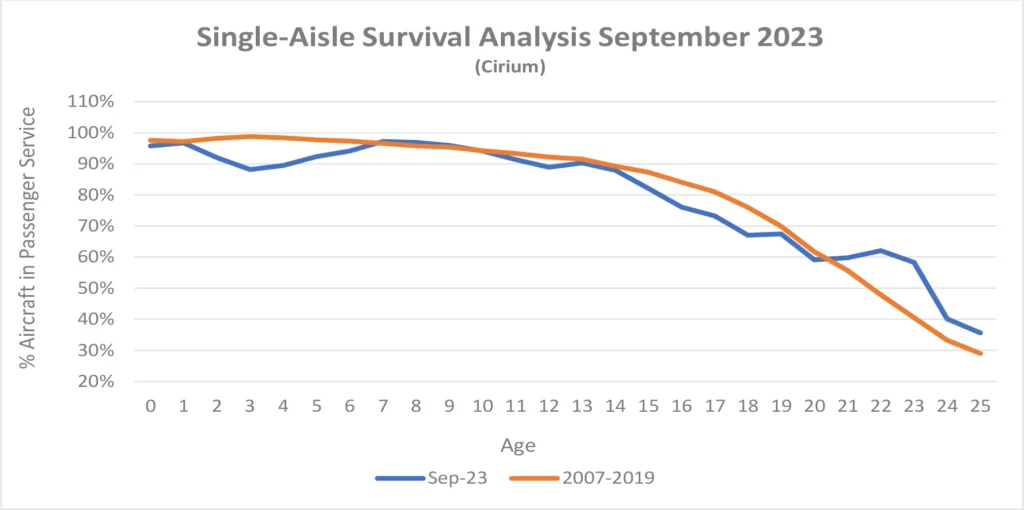
The P&W 1000G family accounts for 280 (73%) of aircraft in storage vs 68 (18%) for the CFM LEAP and has well publicised manufacturing materials problems, but few industry commentators are suggesting that the LEAP will have overhaul intervals anywhere near as long as those achieved by its predecessor the CFM 56. This means that fixing the problem will be a slow process as the only real solution is a big increase in the supply of spare engines to allow the aircraft to be operated while the original engines are being rectified or overhauled. The engine manufacturers are not well placed to meet this requirement due to manufacturing and supply chain constraints which are aggravated by the aircraft manufacturers’ desire to increase the output of new aircraft.
The impact of this shortfall of aircraft in service is more pronounced because the aircraft concerned are younger. As part of our proprietary industry forecast, we estimate the typical maximum volume of ASKs produced by an aircraft of a given type and age by forecast year. We would expect an A320 Neo to produce more ASKs than an A320 Ceo because:
- The A320 Neo will fly longer routes so that it will cover a greater distance for a given level of flight hours; and
- It will have more seats.
The same factors apply for the B737 Max 8 vs the B737-800.
This combination of factors leads to meaningful differences in productivity per aircraft unit as illustrated in the table below. The ASK “productivity premium” is 16.2% for the A320 Neo and 14.7% for the B737 Max 8. Maximum aircraft kilometres is a Sirius estimate based on analysis of historic flight hours and cycles by aircraft type and assumes optimal aircraft utilization, The number of seats for each aircraft type is a global average taken from SRS Analyser.
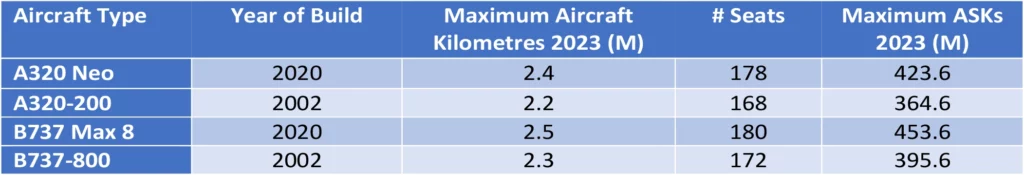
Turning to the twin-aisle market the same snapshot survival analysis gives us a very different picture with weakness right across the age spectrum. We have limited this analysis to long range twin-engine aircraft as this is clearly the prevailing market standard for twin-aisle aircraft after the ending of A380 production; this is an important distinction as these aircraft have performed better than predecessor types in terms of survival and therefore give a more challenging benchmark.
There are no reported engine problems for new technology twin-aisle aircraft on a scale comparable to those afflicting their single-aisle counterparts. The downward blip for 2–3-year-old aircraft is not quite apples to apples with the single-aisle analysis because it includes 12 B787s stored by Boeing out of 44 total aircraft stored less than 6 years old. In contrast there are only 5 B737 Max aircraft in the single-aisle numbers out of a total of 385 aircraft stored less than 6 years old. These numbers are presumably driven by Cirium’s definition of a white tail as the overall undelivered inventory of B737 Max aircraft is much higher than for the B787 (see New Aircraft Supply above).
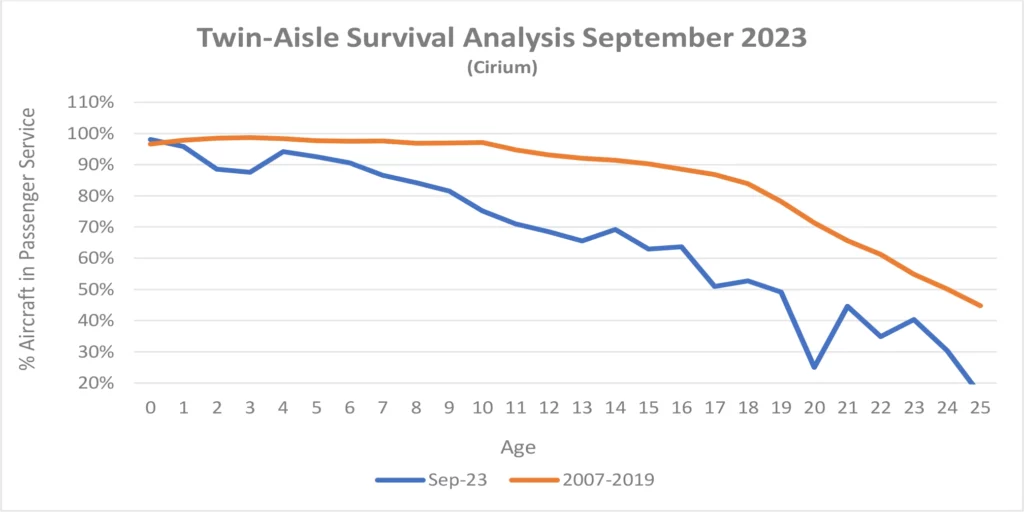
Given there is no obvious shortage of twin-aisle capacity what might motivate airlines to extend leases? This discussion will be speculative as we do not have the detail of the leases that have been extended, but anyway…
Airlines may be sceptical about the ability of Airbus and Boeing to increase output in line with announced production plans. There has been the specific problem with B787 production in the last two years and there is the more general issue of the low level of current production rates by historic standards. After the onset of Covid 19 the manufacturers reduced production to levels where the market would inevitably rebalance at some point in the future. Increased production rates have been announced to levels that have readily been achieved in the past but require a rough doubling from current rates. This is a bigger proportional increase than for single-aisle aircraft types which some airlines may deem challenging.
Another possible motivation is to lock in rents in an airline-friendly market environment. Rising interest rates and supply/demand rebalancing are both likely to increase rents in the future.
[1] The crack spread is the difference between the price of crude oil and refined products such as jet fuel.
[2] RPKs is the acronym for revenue passenger kilometres, which is the product of the number of paying passengers times distance flown.
[3] ASKs is the acronym for available seat kilometres, which is the product of the number of available seats flown times distance flown.
[4] Airbus normally quotes its production rates based on an 11.5-month year for single-aisle aircraft.
[5] ACMI stands for Aircraft, Crew, Maintenance, and Insurance and is also known as wet leasing and/or damp leasing.
[6] Fleet numbers are as of December 31st, 2002.
[7] Our definition of single-aisle aircraft includes regional jets with more than 50 seats.
Disclaimer
This Presentation has been made to you solely for general information purposes and is not intended to provide, and should not be relied upon for legal, tax, accounting, investment, or financial advice. This Presentation is not a sales material and does not constitute or form any part of any offer, invitation or recommendation to the recipient, its affiliates or any other person to underwrite, sell or purchase securities, assets or any other product, nor shall it or any part of it form the basis of, or be relied upon, in any way in connection with any contract or transaction decision relating to any securities, assets or any other product. None of Sirius, its affiliates or shareholders shall have any responsibility or liability to the recipient, its affiliates, shareholders or any third party in relation to this Presentation or any other document or materials prepared by Sirius or its affiliates, officers, directors, employees, advisers or agents. Sirius and its affiliates, officers, directors, employees, advisers and agents have taken all reasonable care to ensure that the information contained in this Presentation is accurate. Neither Sirius nor any of its affiliates, officers, directors, employees, advisors or agents has any obligation to update this Presentation. Under no circumstances should the delivery of this Presentation, irrespective of when it is made, create an implication that there has been no change in the affairs of the entities that are the subject of this Presentation. This Presentation may be updated and amended by a supplement and, where such supplement is prepared, this Presentation will be read and construed with such supplement. The statements herein which contain such terms as "may", "will", "should", "expect", "anticipate", "estimate", "intend", "continue" or "believe" or the negatives thereof or other variations thereon or comparable terminology are forward-looking statements and not historical facts. No representation or warranty, express or implied, is made as to the fairness, accuracy or completeness of such statements, estimates and projections. The recipient should not place reliance on any forward-looking statements. Neither Sirius nor its affiliates undertakes any obligation to update or revise the forward-looking statements contained in this Presentation to reflect events or circumstances occurring after the date of this Presentation or to reflect the occurrence of anticipated events. The information set out in this Presentation has been prepared by Sirius based upon various methodologies and calculations which it believes to be reasonable and appropriate. Past performance cannot be a guide to future performance. In preparing this Presentation, Sirius has relied upon and assumed, without independent verification, the accuracy and completeness of all information available from public sources or which was provided to it or otherwise reviewed by it. This Presentation supersedes and replaces any other information provided by Sirius or its affiliates, officers, directors, employees, advisers or agents in respect of the content of the Presentation. No information or advice contained in this Presentation shall constitute advice to an existing or prospective investor in respect of his personal position. None of Sirius, its affiliates, its or its affiliates’ officers, directors, employees or advisers, connected persons or any other person accepts any liability whatsoever for any loss howsoever arising, directly or indirectly, from this Presentation or its contents.

Industry Update Q2 2023
Macro-Economic Background
The IMF’s latest update to its World Economic Outlook (July2023) shows a marginal improvement from their April update. The IMF’s discussion of the world economy centres on the impact of central banks’ efforts to control inflation which is causing moderately low growth by historical standards. This situation is expected to persist through 2024.
Global economic growth is vital to the long-term growth of air travel. However, in the next few years the key drivers of traffic growth will likely be very specific to the airline industry, especially the recovery from the industry downturn caused by the Covid 19 pandemic.
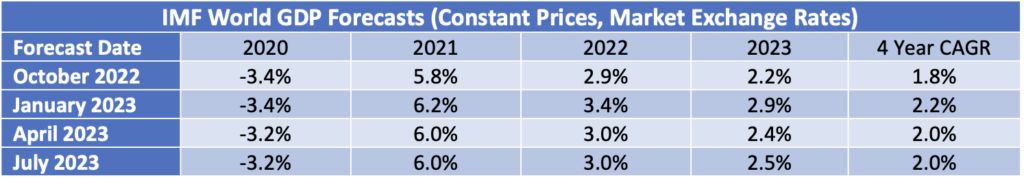
The US Dollar has weakened since its recent peak in September 2022, providing relief for airlines outside the US for dollar-denominated costs such as fuel, aircraft rents and aircraft spares.
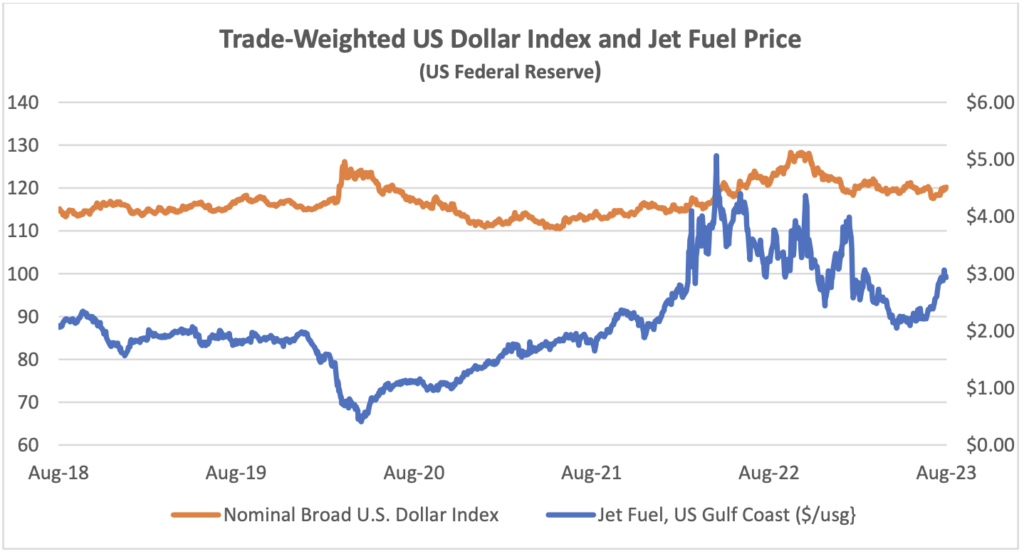
The price of jet fuel has increased sharply in the last three months and as the IATA chart below shows this is mainly due to an increase in the “crack spread”[1]. Some of the issues that have contributed to this increase include the pace of traffic recovery, especially in Asia Pacific, and reported local refinery issues in the US and Europe. The current level of the crack spread is high by historic standards, and it seems reasonable to expect that it will reduce over time.
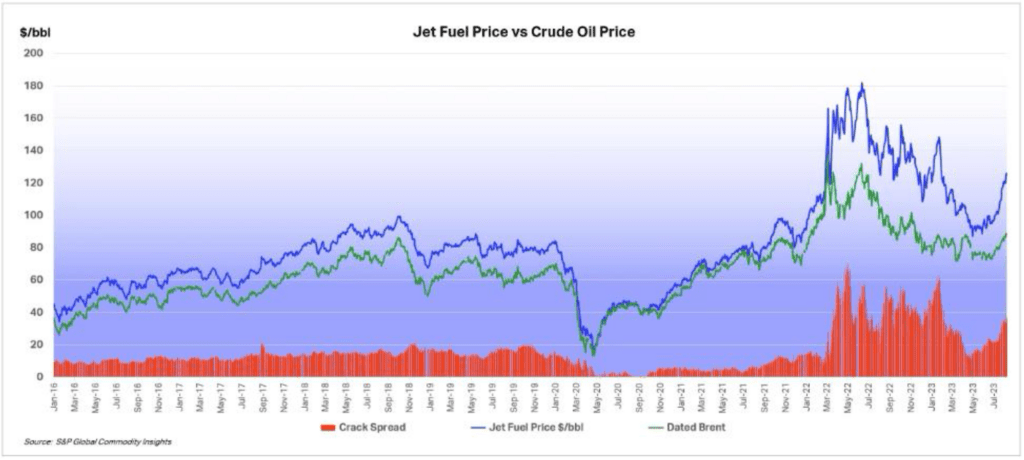
Another indicator that is potentially important to aircraft investors is the breakeven inflation rate on US Treasury Inflation-Protected Securities (TIPS). This indicator measures inflation expectations and it matters because used aircraft values are strongly influenced by the cost of new aircraft and over time this cost is linked to US Dollar inflation. In the short term this linkage is driven by escalation clauses in aircraft purchase contracts and in the long term by the general input cost environment for the aircraft manufacturers. The chart below compares the breakeven rate for 10-year and 5-year TIPS.
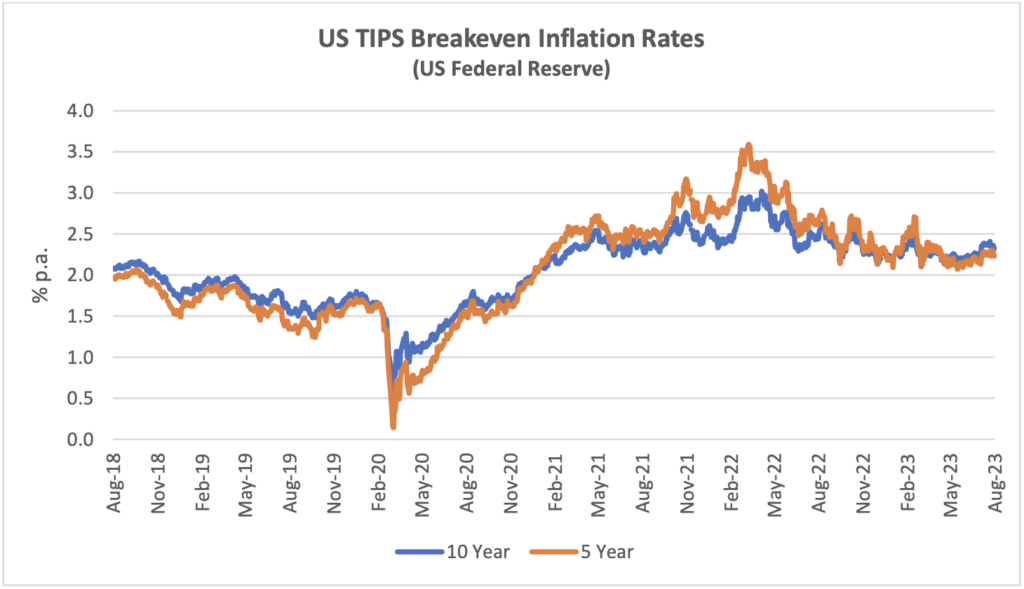
Traffic and Aircraft Demand
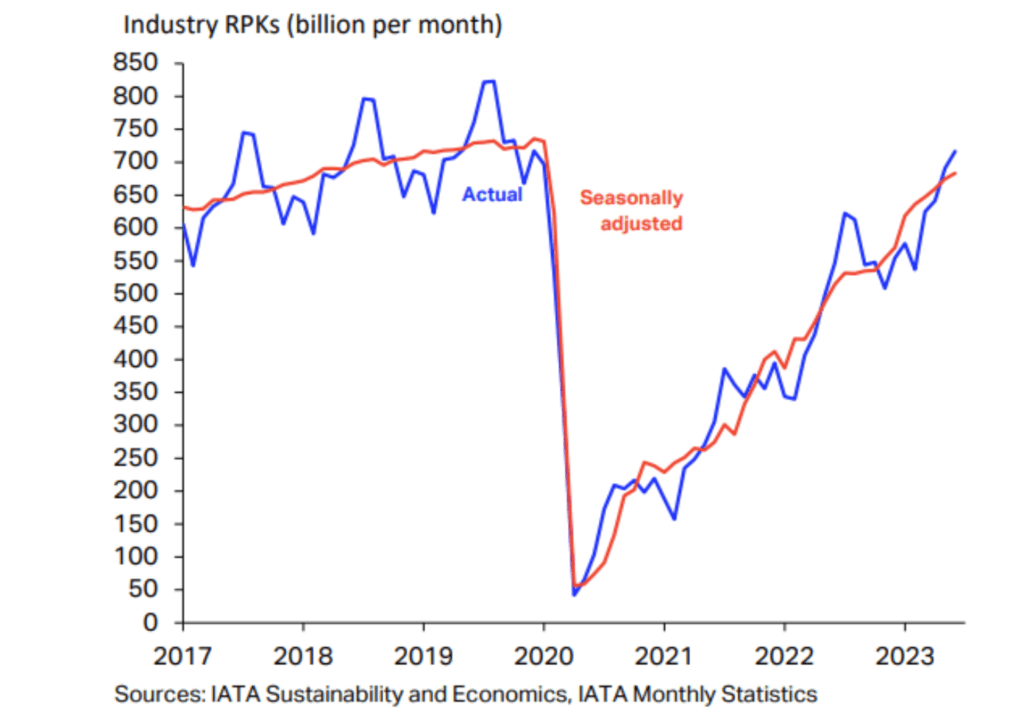
The strong recovery in air travel from the start of 2022 has continued through H1 2023 and overall RPKs for the month of June were only 5.8% below the comparable figures for 2019. Asia Pacific was the strongest performing regions as government restrictions (especially in China) were finally relaxed. As in 2022, there was a much bigger increase in international traffic vs domestic traffic, mainly because the former is still coming off a much lower base.

For H1 2023 as a whole traffic was up 47.2%. The chart below shows the changes in RPKs[2] and ASKs[3] by month and has a pattern that we expect to continue through the rest of the year. First the level of increases in RPKs gradually reduces because the year-on-year comparison is with a month in 2022 that was subject to a greater level of traffic recovery. Second the rate of increase in RPKs and ASKs becomes more alike as the recovery in load factors is largely complete, so additional capacity needs to be deployed to support further traffic growth.
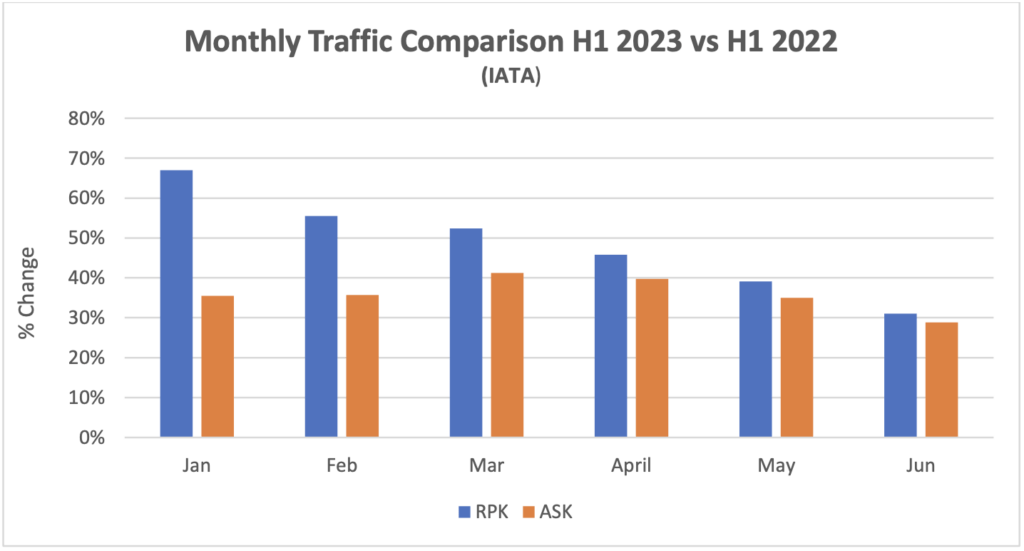
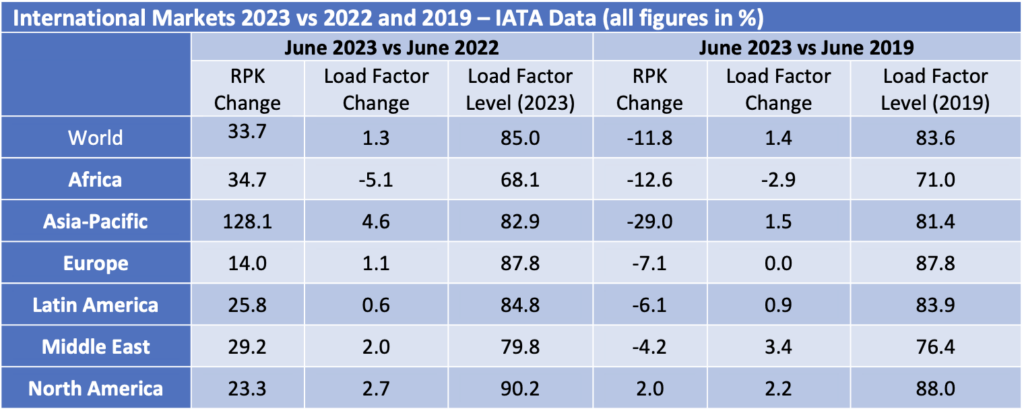

Although some short-haul aircraft serve international routes nearly all long-haul aircraft do so, and this is reflected in the relative demand for single-aisle (narrowbody) and twin-aisle (widebody) aircraft. Aircraft demand can be measured in terms of aircraft in service and ASKs, the standard measure of aircraft capacity deployed by airlines which indicates how intensively aircraft are being flown. Single aisle aircraft in service and ASK levels for Q2 2023 were ahead of the comparable period in 2019. This is consistent with the 5.1% increase in domestic traffic in June 2023 compared to June 2019.
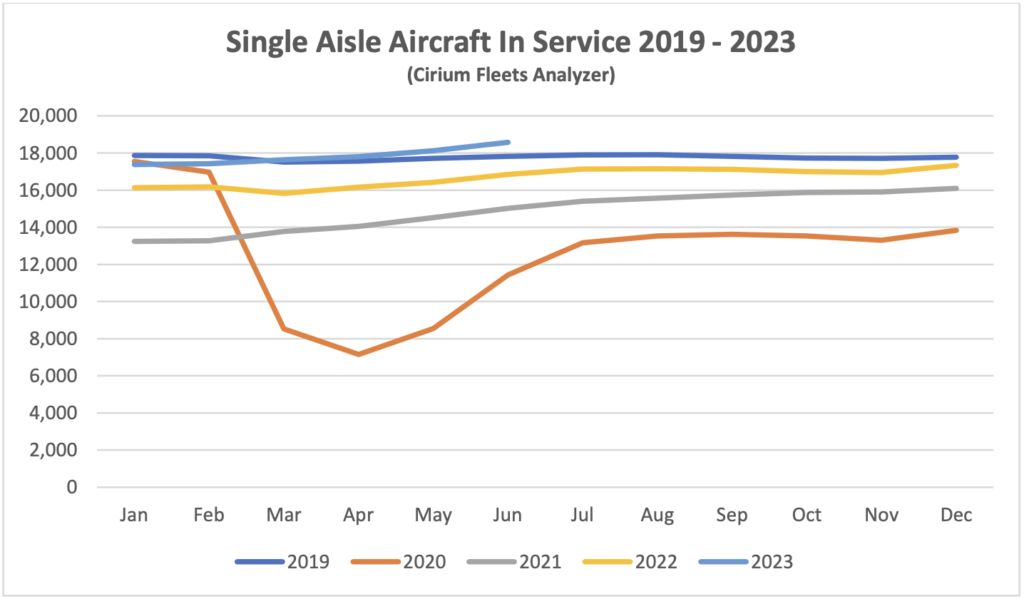
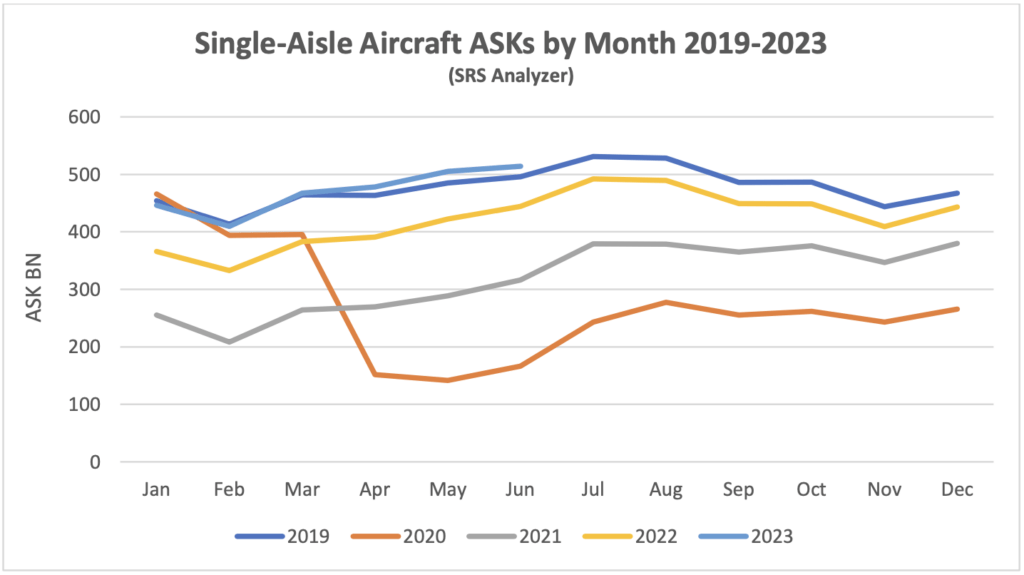
Full recovery has yet to be achieved for twin-aisle aircraft, mainly due to weak traffic to and from, and within the Asia-Pacific region. The figures by region in the tables above are based on airline domicile, so weak Europe to Asia traffic reduces recorded international RPKs in other regions. Twin-aisle aircraft in service has shown a greater improvement relative to 2019 than ASKs which suggests that aircraft are being returned to service with lower utilisation in anticipation of continued recovery.
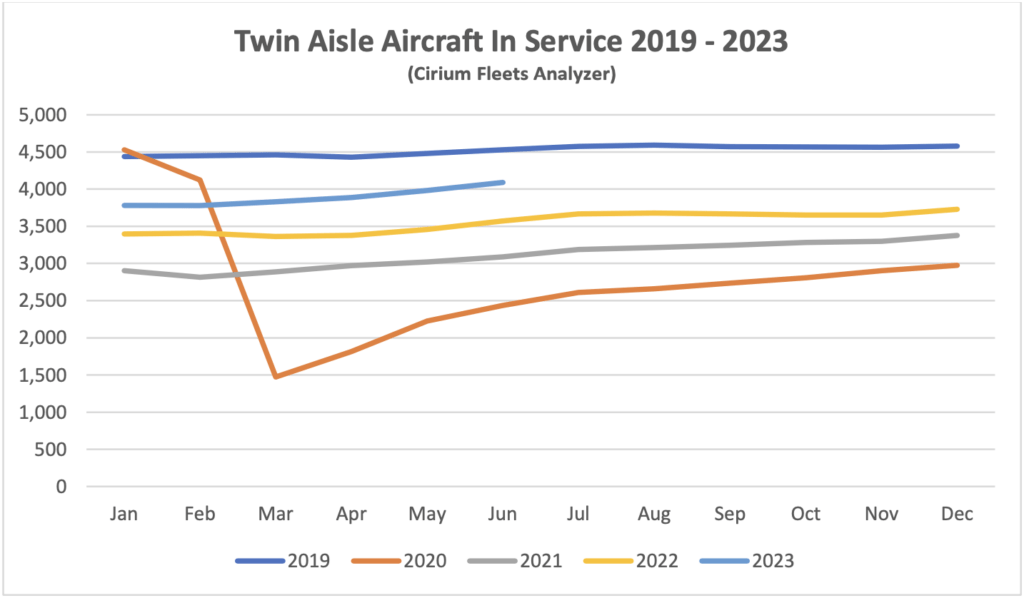
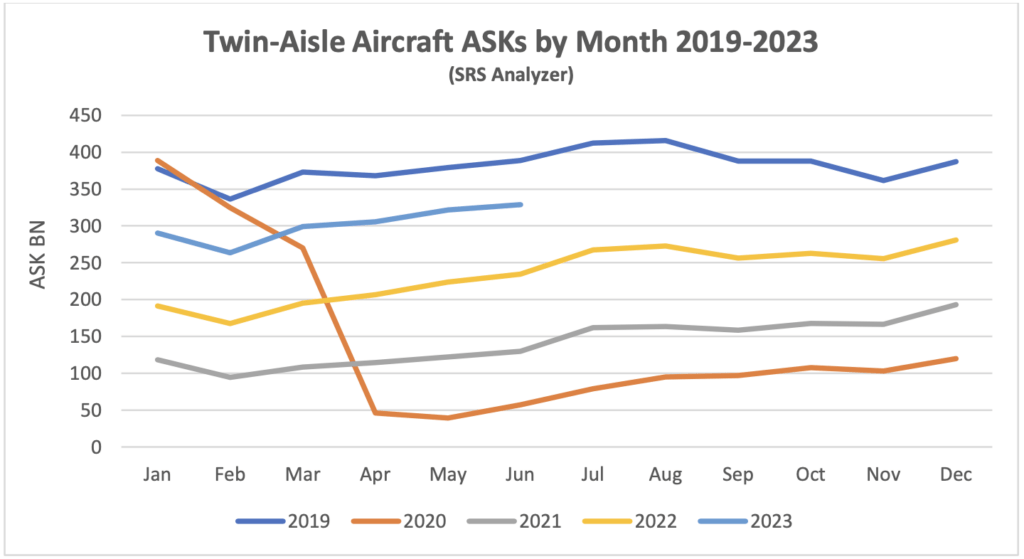
New Aircraft Supply
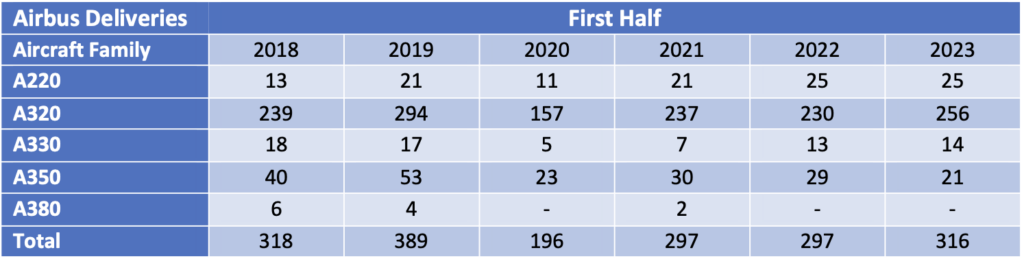
Airbus missed its 2022 delivery target significantly due to supply chain problems. Its final total of 661 aircraft compared with an initial target of 720 It has once again set a target of 720 deliveries for 2023, but this will require a significant step-up from H1 performance. The table below highlights achieved production rates in H1 2023 vs official announced current rates, with the aggregate achieved rate of 55 aircraft per month some way below the aggregate announced rate of 65.
The latest status of Airbus’s production plans is:
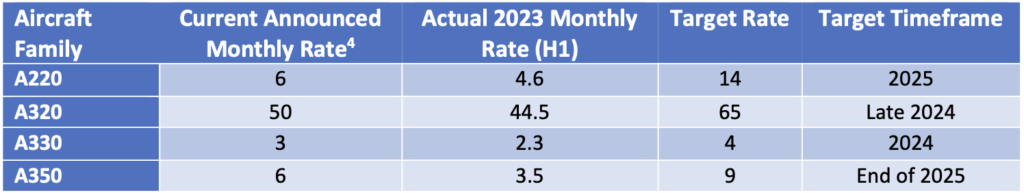
The only significant production target not captured in the table above is the objective to raise A320 family production to 75 per month by 2026.
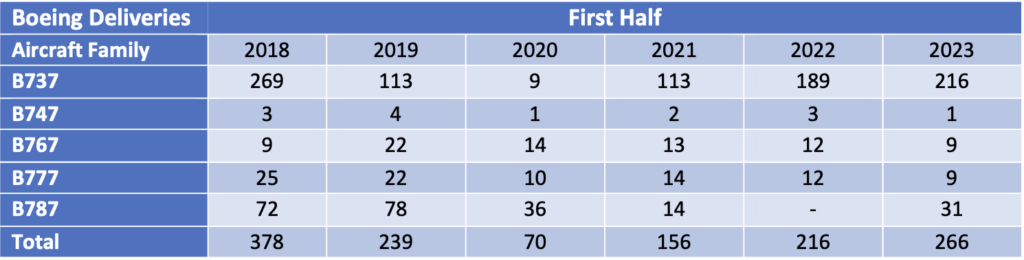
The latest status of Boeing’s production plans is:
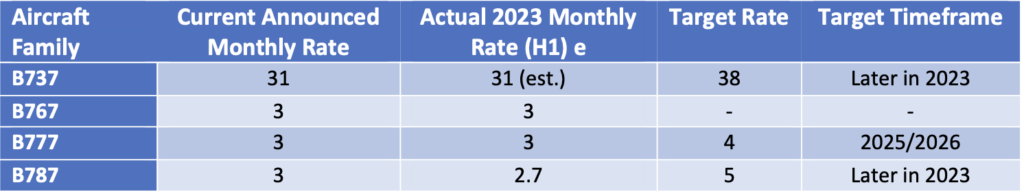
Boeing plans to deliver between 400 and 450 B737 Max aircraft in 2023, up from 387 in 2022. Part of this will be achieved by reducing aircraft in inventory, although this is a slow process due to rework requirements for these aircraft to enter service. B737 inventory fell from 250 to 225 in Q1 and 220 in Q2 a reduction of 5 per month. Boeing’s guidance for the full year is a reduction of 8 to 10 units per month, which is probably partly dependent on their ability to increase deliveries to Chinese airlines (85 of the aircraft in inventory in June 2023 are contracted for delivery to China). The other contributor to higher deliveries will be an increase in monthly production from 31 to 38. There remains significant uncertainty around Boeing’s ability to meet its targets due to supply chain problems such as the requirement for rework of some fuselage sections manufactured by Spirit AeroSystems. Boeing has also announced a medium-term production target of 50 aircraft per month by 2025/2026.
Despite this overall improvement the Max still faces challenges. The FAA deadline for certification of the Max 7 and Max 10 variants has been pushed back by new legislation and they are now planned to enter service in 2024 (Boeing had previously targeted EIS for the Max 7 in 2023).
Q1 2023 saw the delivery of the last B747 which like the B767 had not seen any passenger variants sold for several years. That has also been the case recently for the B777, but this is likely to change with the entry into service of the B777-8 and B777-9 from 2025. Boeing has also had quality and production problems with the B787, its main passenger twin-aisle offering. It suspended deliveries in May 2021 and restarted in Q3 2022. Production levels for are back at 3 aircraft per month going to 5 by the end of 2023 and 10 by 2025/2026. As with the Max Boeing holds a significant inventory of undelivered aircraft - 85 at the end of Q2 vs 100 at the end of 2022. Boeing has said it expects to deliver most of them within the next two years.
The number of commercial jets delivered by OEMs other than Airbus and Boeing remains subdued.
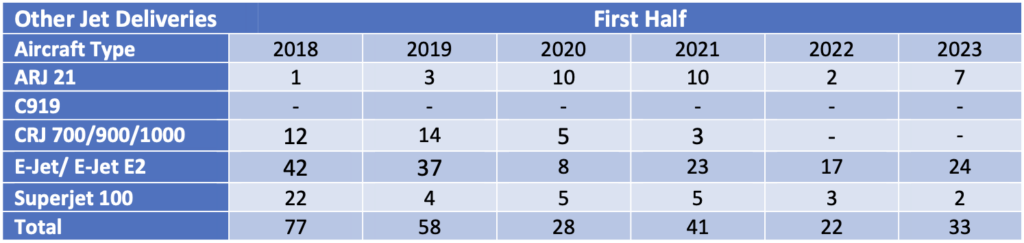
The reduction in new aircraft production by Airbus and Boeing has had a major impact in mitigating the impact of the pandemic on the balance of aircraft supply and demand, especially for single-aisle aircraft. If the OEMs had been able to continue delivering aircraft at their pre-pandemic peak levels the total world fleet would now reflect over 3,060 additional deliveries. One of the key supply chain bottlenecks relates to engines – this is partly down to labour shortages but there is also an issue with a greater than anticipated requirement for spare parts because the new technology CFM LEAP and P&W GTF engines are experiencing persistent technical problems and require more frequent overhauls than expected when they entered service. The shortage of spare parts and spare engines is now causing some airlines to temporarily ground aircraft, particularly in regions where the operating environment is harsh due to aridity, high temperatures and air pollution.
EasyJet recently announced that they will take delivery of 11 used A320 Ceo aircraft on lease through Q1 2024. This illustrates the impact of the supply constraints described above and is noteworthy because low-cost carriers such as easyJet do not have large engineering departments like IAG and Lufthansa Group to facilitate the integration of used aircraft into their operations.
Airline Industry Financial Performance
So far this year global airline share prices have been volatile with a strong start and summer offset by a significant sell-off from March to May. The most recent IATA financial forecast which was discussed in our last update showed upward revisions for 2023 industry net income forecasts and there have been some very strong Q2 2023 earnings reported by major European airlines. This good news is not necessarily captured by the index as it has a heavy focus on North America where the industry recovery is longer established.
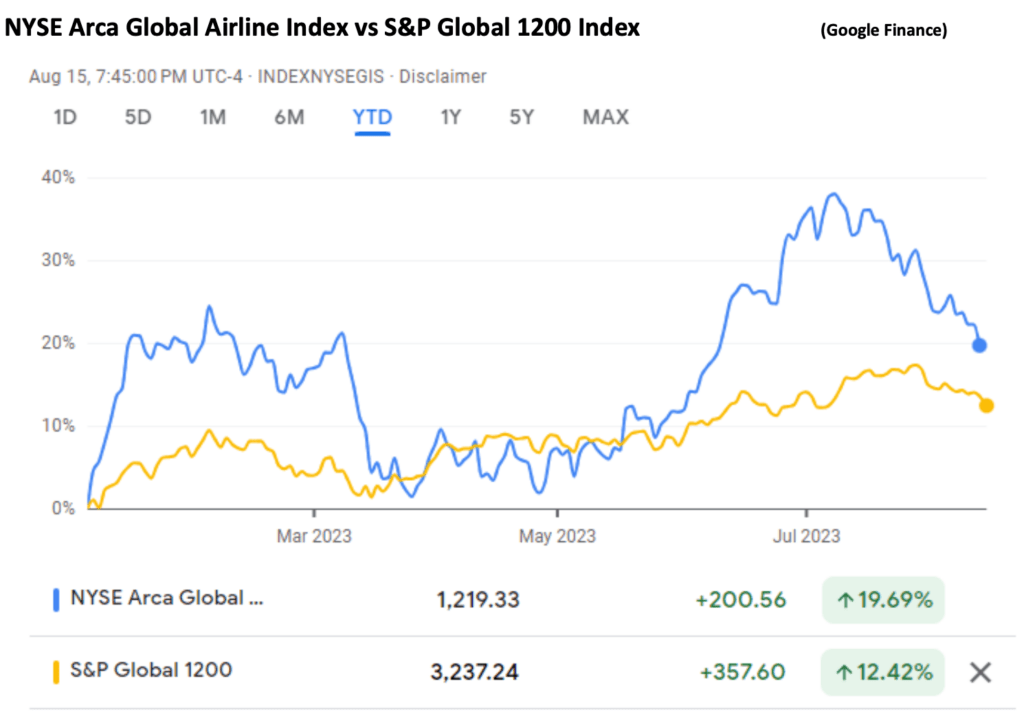
The largest airline to fail so far in 2023 is Go First of India. In its bankruptcy filing the airline declared its main problem was the need to ground about half its A320 Neo fleet due to problems with the PW1127G engine (see above). Viva Air suspended operations citing financial problems caused by the uncertainty around approval by the Colombian government of its acquisition by Avianca. Flyr filed for bankruptcy because of liquidity problems.
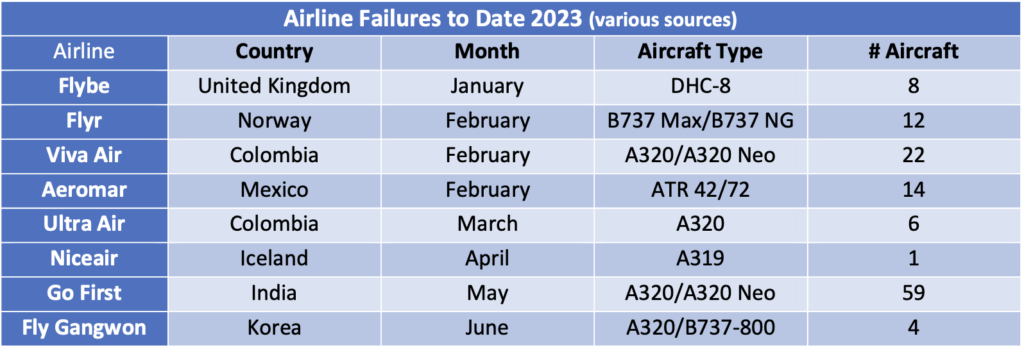
Special Topic – Aircraft Leasing Industry Financial Performance through 2022
We last reviewed the financial performance of the aircraft leasing industry as of 2020. It has been a very tough business environment in the subsequent two years with the de facto expropriation of most aircraft leased to Russian airlines in 2022 adding to the challenges posed by the pandemic. Despite these problems the aggregate performance of the industry has been relatively stable, particularly relative to the performance of the airline industry[4].
The only two aircraft leasing companies to seek the protection of the courts were Nordic Aviation Capital and Voyager, both in 2020 so before Russia invaded the Ukraine. The two companies both pursued relatively niche asset strategies compared to most aircraft lessors with a focus on regional aircraft and widebody aircraft respectively.
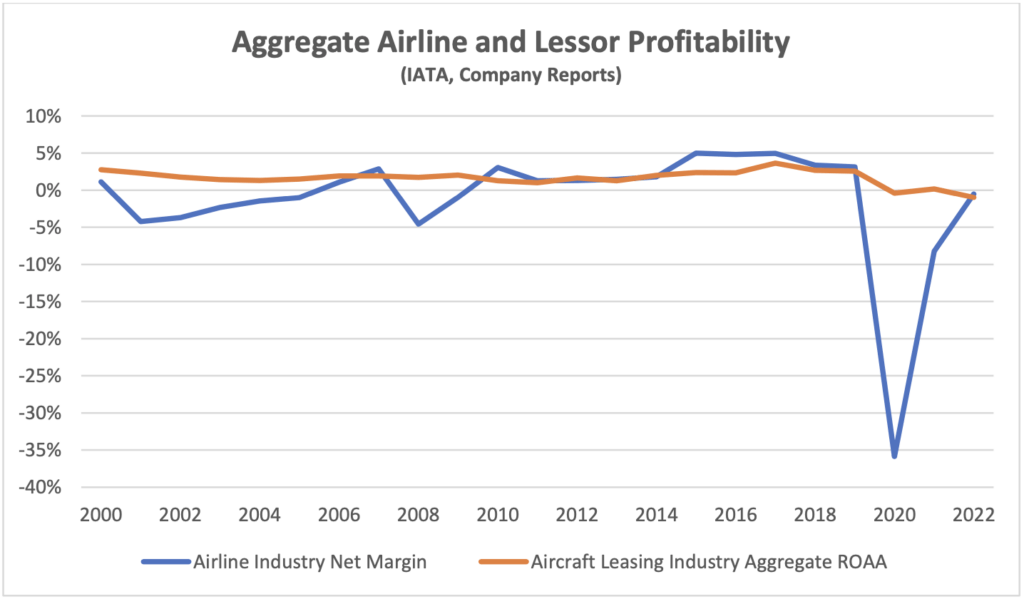
This difference in performance is also reflected in relative share price performance. The chart below compares the performance of the NYSE Arca Global Airline Index with the three largest public aircraft lessors over 5 years. The lessor stocks have significantly outperformed the airline industry during this period which encompasses the pandemic.
2022 was by far the worst year for the lessors because of the write-downs associated with the aircraft expropriated by Russia, with a negative 1.0% return on assets. In practically all cases these write-downs were for the entire net exposure to these assets. The impact of these events on lessor share prices may have been mitigated because of the likelihood of at least partial recovery of losses through various insurance policies. The claims made by the lessors are subject to court proceedings and the timing of any recoveries is uncertain.
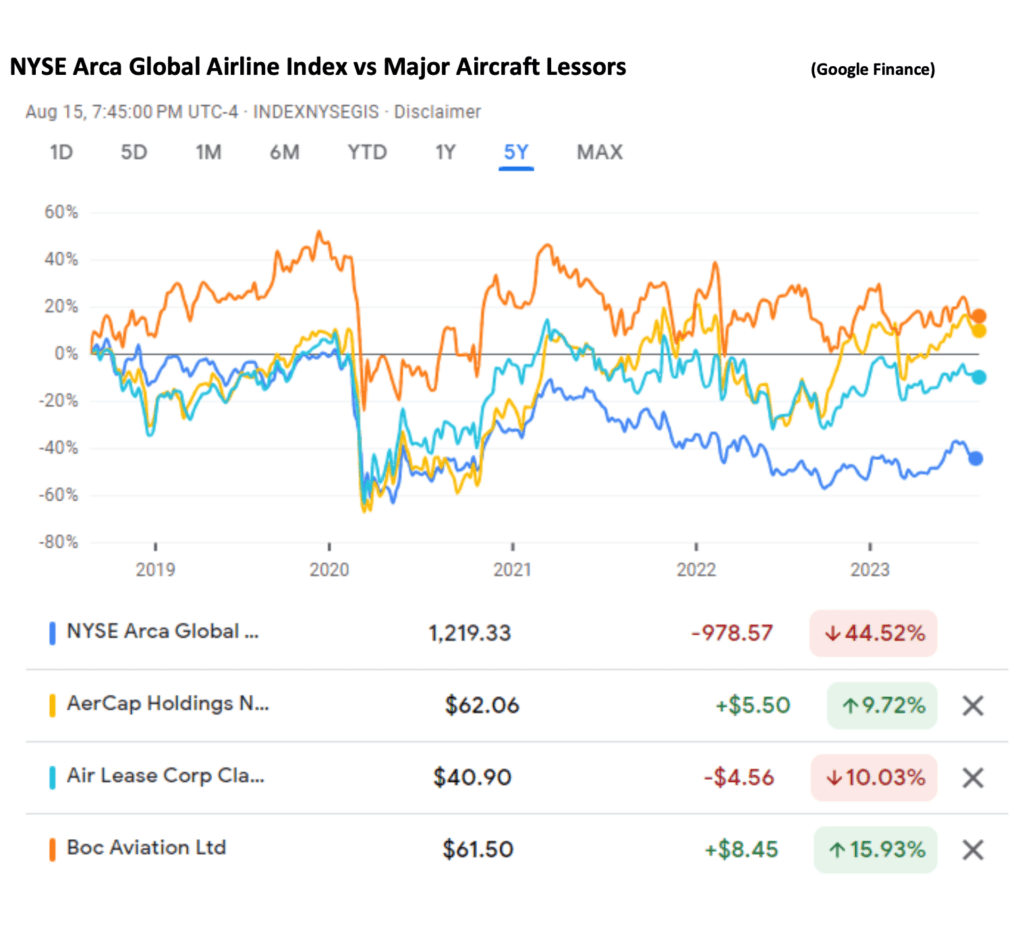
Despite this robust performance there are some concerns around the short to medium term outlook for the industry and one issue that stands out is the drop in net lease rental yield. This performance indicator is the net rent earned by the lessor excluding maintenance rent etc.as a percentage of average aircraft book value. For the purposes of calculating the latter we include assets such as maintenance rights and lease premiums as both these items are allocations of amounts paid for used aircraft and their exclusion would inflate net lease yield compared to aircraft bought new. The chart below shows the range of yields achieved by the group of lessors we follow over the last ten years. There has been a clear reduction of c. 3% p.a. since 2019 which coincides with the onset of the pandemic, and it seems worthwhile to analyse what has caused this and what the prospects are for any recovery.
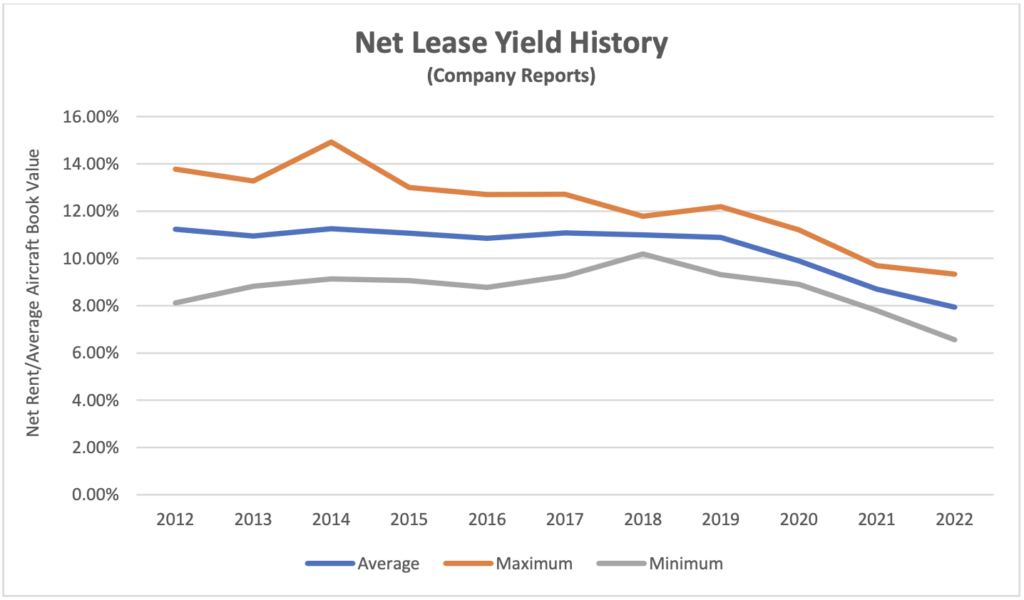
Part of the explanation is lower interest rates. If we look at average debt cost this has declined by a little over 1% p.a. during the same period. As the chart shows these industry averages change slowly over time because lessors substantially hedge their fixed rate leases with fixed rate debt at lease inception. Aircraft leasing is a very competitive industry and one would expect lower funding costs to be passed on in lower lease rates, so lower debt cost explains roughly one third of the overall rental yield decline (in passing, the c. 2.0% p.a. minimum debt cost from 2012 to 2015 was achieved by one large lessor that negotiated a high proportion of floating-rate leases that it could match fund with floating rate debt, and it had a relatively low lease yield relative to its peers as a result). With recent increases in US interest rates, we should expect higher debt costs and rents in the future, but these increases will be gradual.
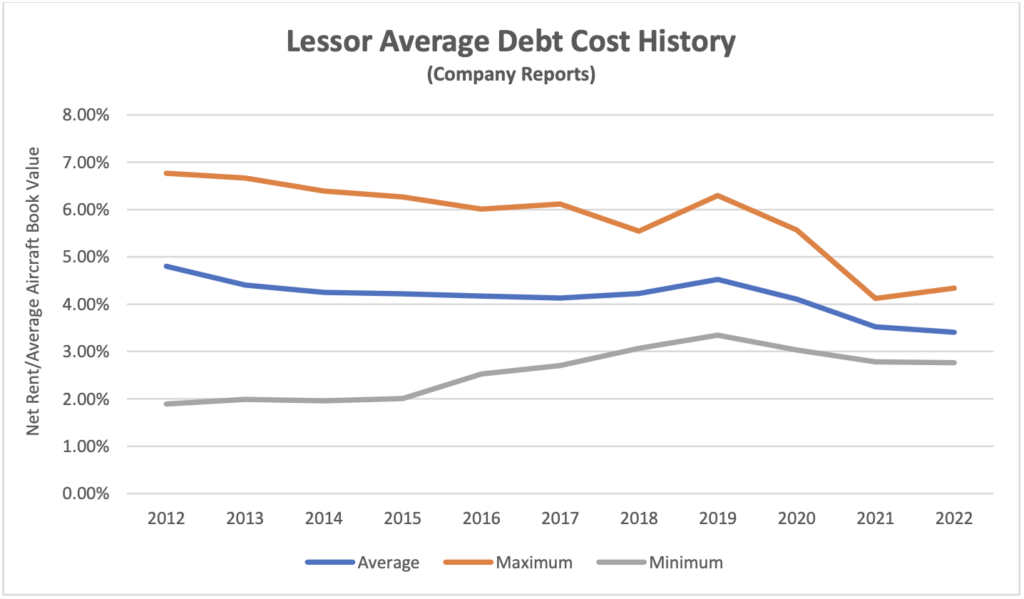
Despite the credit impact of the pandemic and Russia, bad debts have been relatively small. Credit impairments for the three years 2020-2022 have amounted to just 1.4% of aggregate net rent. There are several reasons why this happens, but probably the most important is that early lease termination is a common element of managing a delinquent lessee so rent no longer accrues. Lessors are rightly very focussed on the integrity of their assets and associated records so physical possession is more important than “running the meter”. There is still some exposure to future bad debts as aggregate receivables and deferred rents were 18% of net rent in 2022 but the reduction achieved from 25% in 2021 suggests that for the most part these exposures are being managed down successfully.
The flip side of early termination is that there has been a sharp increase in the number of aircraft off lease. The chart below shows the ten-year view across the industry as a whole and it is reasonable to suppose that the group of lessors we follow would have had a similar experience (we cannot produce completely accurate numbers by lessor as it is not always clear which aircraft are owned and which are managed).
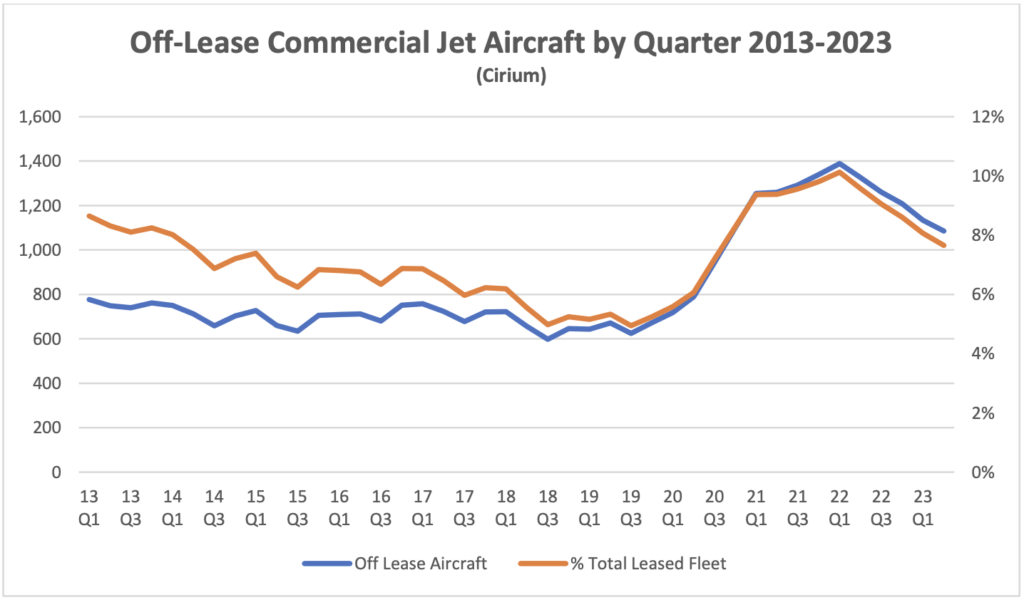
The fleet percentage line shows that relative reductions in off-lease aircraft after a downturn are slow and steady, but it is reasonable to expect there will be continuing improvement in this metric in 2023 and beyond, particularly with the supply chain issues affecting new aircraft deliveries.
In addition to increases in off-lease aircraft there was unprecedented economic stress associated with those aircraft that remained on lease. Large numbers of leased aircraft entered storage and aircraft in service showed sharp reductions in utilisation, as shown in the charts below. The first shows off-lease and on-lease but stored aircraft relative to the total leased fleet and the second shows utilization by aircraft class for aircraft on lease and in service.
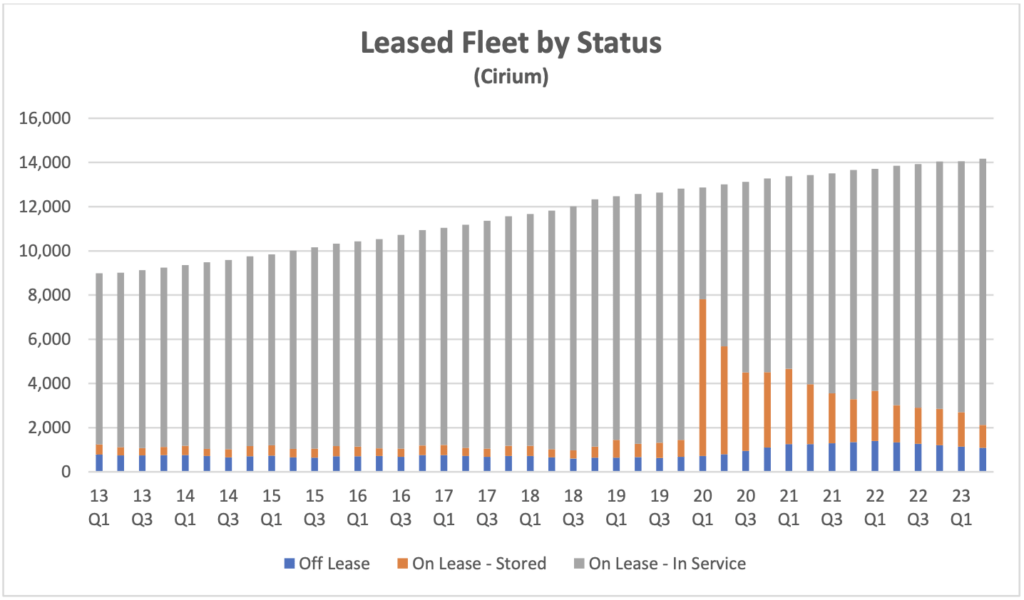
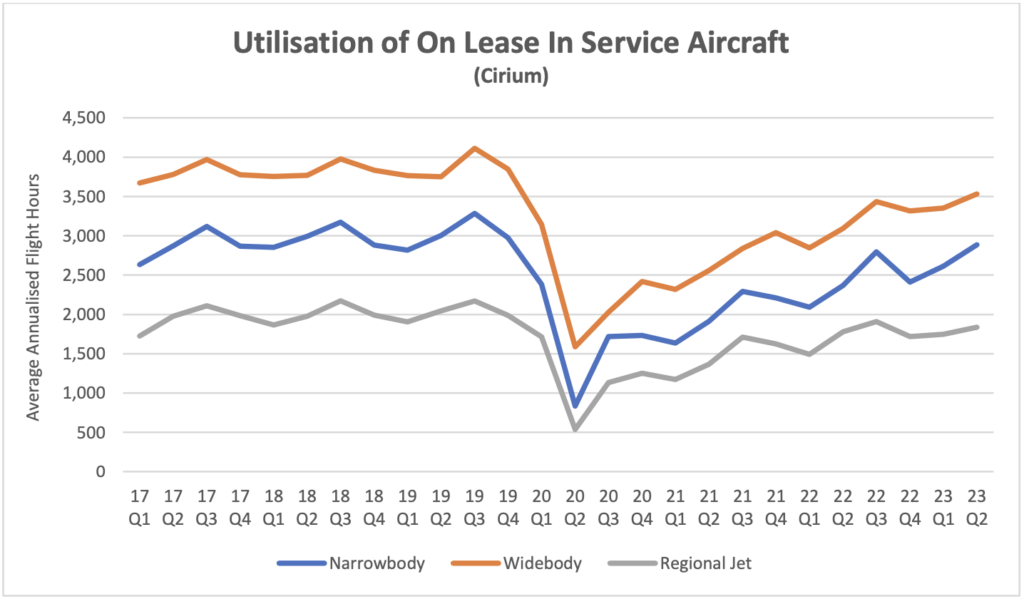
This kind of stress is clearly going to have an impact on rental income. This can arise in several ways in addition to rent deferrals which have already been discussed. When airlines are in bankruptcy protection leases can be restructured with lower rents (sometimes in return for a lease extension) and/or “power by the hour” arrangements where airlines only pay rent if the aircraft flies. From the lessor’s point of view such arrangements may be the best available option despite the concessions involved. Such arrangements may also arise if there is just the threat of bankruptcy rather than actual court proceedings.
In conclusion the aircraft leasing industry has once again demonstrated the defensive value of contracted lease income streams and a geographically diversified customer base in the most adverse of circumstances. Of the 3% reduction in net rental yield since 2019 we can account for 1% by the impact of lower debt costs and some of the rest by the impact of lease terminations and restructurings, although it is impossible to be definitive. One other factor which should be considered is the long-term impact of aggressive price competition from new entrants, particularly Chinese lessors. We expect that outcomes will vary quite significantly by lessor reflecting customer concentrations and equipment mix.
[1] The crack spread is the difference between the price of crude oil and refined products such as jet fuel.
[2] RPKs is the acronym for revenue passenger kilometres, which is the product of the number of paying passengers times distance flown.
[3] ASKs is the acronym for available seat kilometres, which is the product of the number of available seats flown times distance flown.
[4] Sirius has created the time series of aggregate aircraft leasing industry returns by based on public financial information in respect of the following companies: AerCap, Aircastle, Air Lease Corp., ALAFCO, Aviation Capital Group, Avolon, AWAS, BOC Aviation, CDB Aviation, DAE Capital, Fly Leasing, GECAS, Genesis Lease, ILFC, Intrepid/Voyager, Nordic Aviation Capital and SMBC Aviation Capital. We have excluded NAC from our calculations for 2022 because their net income includes a $2.6 BN gain on restructuring of financial liabilities and some other large one-off items.
Disclaimer
This Presentation has been made to you solely for general information purposes and is not intended to provide, and should not be relied upon for legal, tax, accounting, investment, or financial advice. This Presentation is not a sales material and does not constitute or form any part of any offer, invitation or recommendation to the recipient, its affiliates or any other person to underwrite, sell or purchase securities, assets or any other product, nor shall it or any part of it form the basis of, or be relied upon, in any way in connection with any contract or transaction decision relating to any securities, assets or any other product. None of Sirius, its affiliates or shareholders shall have any responsibility or liability to the recipient, its affiliates, shareholders or any third party in relation to this Presentation or any other document or materials prepared by Sirius or its affiliates, officers, directors, employees, advisers or agents. Sirius and its affiliates, officers, directors, employees, advisers and agents have taken all reasonable care to ensure that the information contained in this Presentation is accurate. Neither Sirius nor any of its affiliates, officers, directors, employees, advisors or agents has any obligation to update this Presentation. Under no circumstances should the delivery of this Presentation, irrespective of when it is made, create an implication that there has been no change in the affairs of the entities that are the subject of this Presentation. This Presentation may be updated and amended by a supplement and, where such supplement is prepared, this Presentation will be read and construed with such supplement. The statements herein which contain such terms as "may", "will", "should", "expect", "anticipate", "estimate", "intend", "continue" or "believe" or the negatives thereof or other variations thereon or comparable terminology are forward-looking statements and not historical facts. No representation or warranty, express or implied, is made as to the fairness, accuracy or completeness of such statements, estimates and projections. The recipient should not place reliance on any forward-looking statements. Neither Sirius nor its affiliates undertakes any obligation to update or revise the forward-looking statements contained in this Presentation to reflect events or circumstances occurring after the date of this Presentation or to reflect the occurrence of anticipated events. The information set out in this Presentation has been prepared by Sirius based upon various methodologies and calculations which it believes to be reasonable and appropriate. Past performance cannot be a guide to future performance. In preparing this Presentation, Sirius has relied upon and assumed, without independent verification, the accuracy and completeness of all information available from public sources or which was provided to it or otherwise reviewed by it. This Presentation supersedes and replaces any other information provided by Sirius or its affiliates, officers, directors, employees, advisers or agents in respect of the content of the Presentation. No information or advice contained in this Presentation shall constitute advice to an existing or prospective investor in respect of his personal position. None of Sirius, its affiliates, its or its affiliates’ officers, directors, employees or advisers, connected persons or any other person accepts any liability whatsoever for any loss howsoever arising, directly or indirectly, from this Presentation or its contents.
Industry Update Q1 2023
Macro-Economic Background
The IMF’s latest update to its World Economic Outlook (April 2023) shows a slight decline from their January update due to a combination of negative factors including the impact of Russia’s invasion of the Ukraine, supply chain disruption etc. with most of the drop occurring in the main developed economies.
Global economic growth is vital to the long-term growth of air travel. However, in the next few years the key drivers of growth will likely be very specific to the airline industry, especially the recovery from the industry downturn caused by the Covid 19 pandemic.
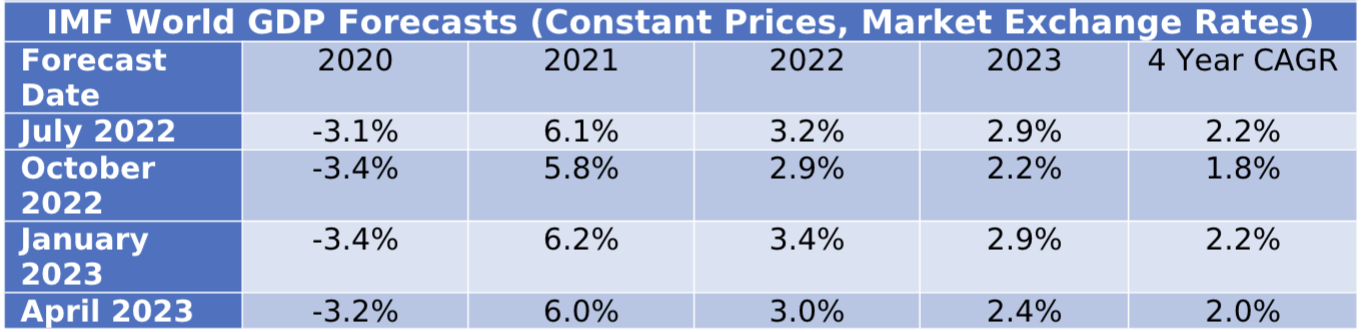
The US Dollar has weakened since its recent peak in September 2022, providing relief for airlines outside the US for dollar-denominated costs such as fuel, aircraft rents and aircraft spares. Jet fuel is also on a downwards trend, albeit with a lot of volatility.
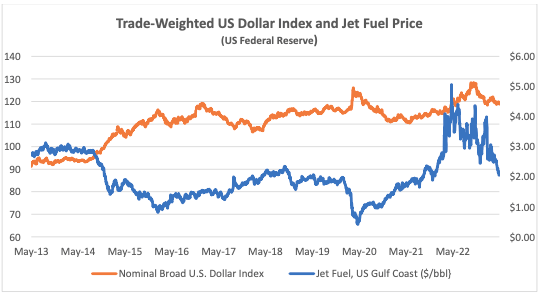
The drop in the price of fuel has mainly been a function of a reduction in the “crack spread” which is the difference between the price of crude oil and refined products. Disruption of global supply caused this spread to reach very high levels by historical standards after Russia invaded Ukraine and to remain elevated for some time. Ultimately this has proved to be a temporary phenomenon as the iATA chart below shows.
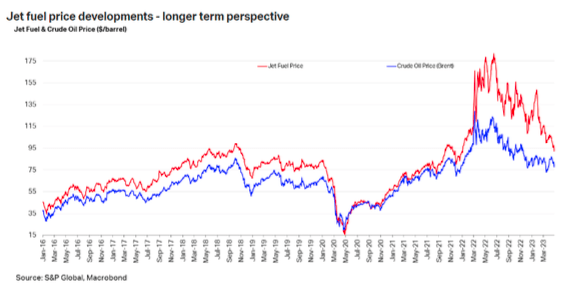
Another indicator that is potentially important to aircraft investors is the breakeven inflation rate on US Treasury Inflation-Protected Securities (TIPS). This indicator measures inflation expectations and it matters because used aircraft values are strongly influenced by the cost of new aircraft and over time this cost is linked to US Dollar inflation. In the short term this linkage is driven by escalation clauses in aircraft purchase contracts and in the long term by the general input cost environment for the aircraft manufacturers. The chart below compares the breakeven rate for 10-year and 5-year TIPS.
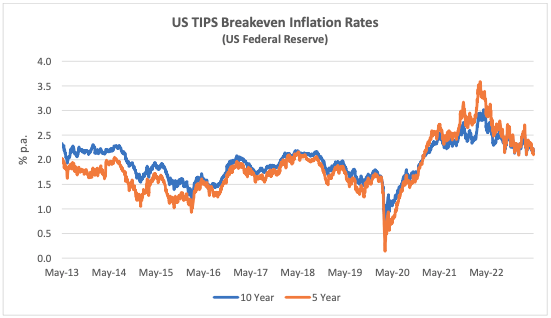
Traffic and Aircraft Demand
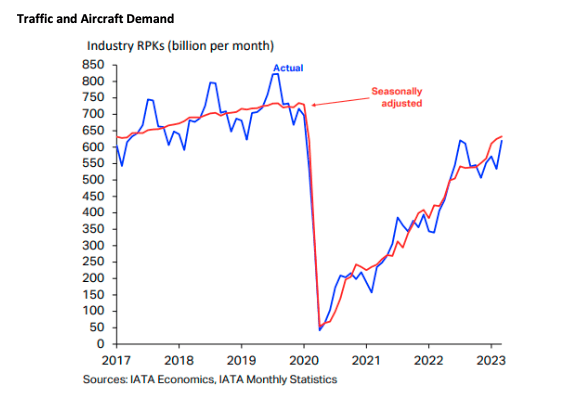
The strong recovery in air travel from the start of 2022 has continued through Q1 2023 although overall RPKs for the month of March remained 12.0% below the comparable figures for 2019. Asia Pacific was the strongest performing regions as government restrictions (especially in China) were finally relaxed. As in 2022, there was a much bigger increase in international traffic vs domestic traffic, mainly because the former is still coming off a much lower base.
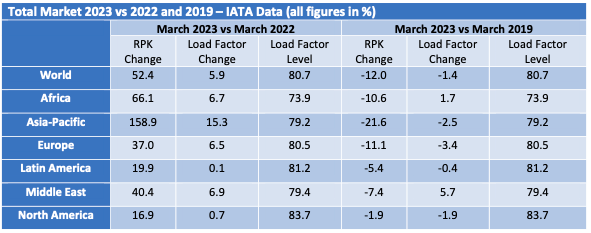
For the quarter as a whole traffic was up 58.3%. The chart below shows the changes in RPKs[1] and ASKs[2] by month and has a pattern that we expect to continue through the rest of the year. First the level of increases in RPKs gradually reduces because the year-on-year comparison is with a month in 2022 that was subject to a greater level of traffic recovery. Second the rate of increase in RPKs and ASKs becomes more alike as the recovery in load factors is largely complete, so additional capacity needs to be deployed to support further traffic growth.
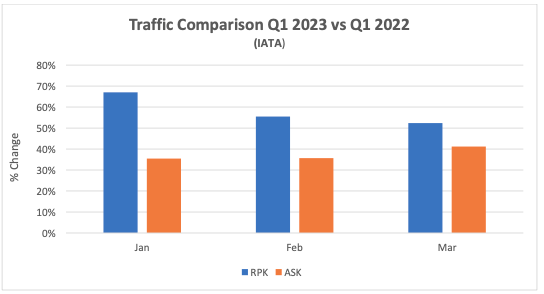

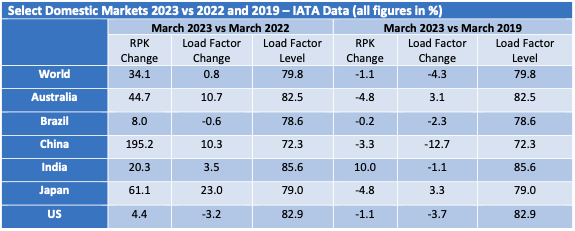
Although some short-haul aircraft serve international routes nearly all long-haul aircraft do so, and this is reflected in the relative demand for single-aisle (narrowbody) and twin-aisle (widebody) aircraft. Aircraft demand can be measured in terms of aircraft in service and ASKs, the standard measure of aircraft capacity deployed by airlines which indicates how intensively aircraft are being flown. Single aisle aircraft in service and ASK levels for Q1 2023 were in line with the comparable period in 2019. Full recovery has yet to be achieved for twin-aisle aircraft, mainly due to weak traffic to and from, and within the Asia-Pacific region. The figures by region in the tables above are based on airline domicile, so weak Europe to Asia traffic reduces recorded European international RPKs.
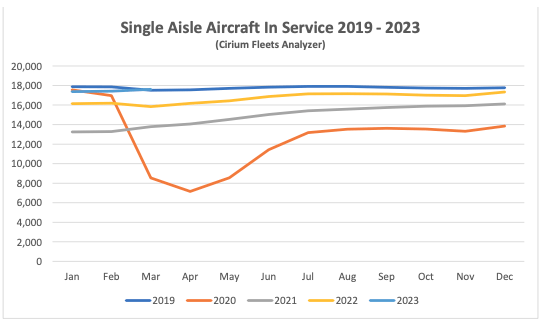
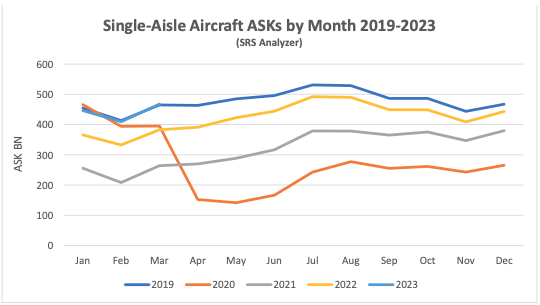
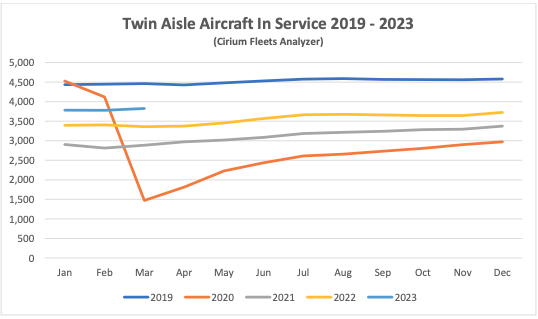
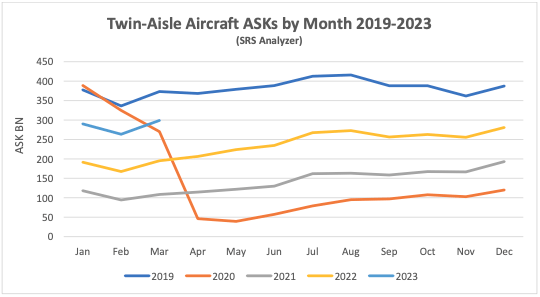
New Aircraft Supply
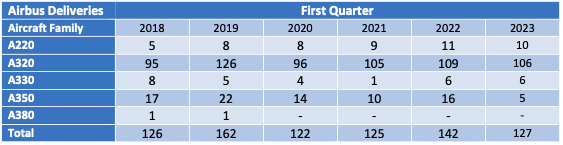
Airbus missed its 2022 delivery target significantly due to supply chain problems. Its final total of 661 aircraft compared with an initial target of 720 It has once again set a target of 720 deliveries for 2023, but this will require a significant step-up from Q1 performance where year on year deliveries were down 11%.
The latest status of Airbus’s production plans is:
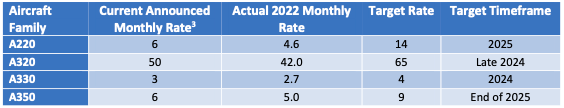
The only significant production target not captured in the table above is the objective to raise A320 family production to 75 per month by 2026.
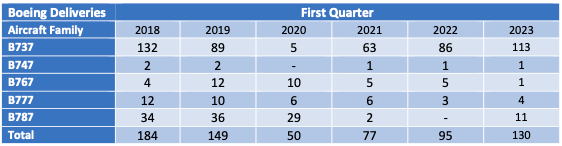
The latest status of Boeing’s production plans is:
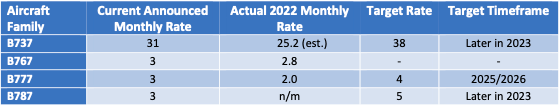
Boeing plans to deliver between 400 and 450 B737 Max aircraft in 2023, up from 387 in 2022. Part of this will be achieved by reducing aircraft in inventory, although this is a slow process due to rework requirements for these aircraft to enter service. B737 inventory fell from 250 to 225 in Q1 and Boeing’s guidance for the full year is a reduction of 8 to 10 units per month. The other contributor to higher deliveries will be an increase in monthly production from 31 to 38. There remains significant uncertainty around Boeing’s ability to meet its targets due to supply chain problems such as the requirement for rework of some fittings manufactured by Spirit AeroSystems. Boeing has also announced a medium-term production target of 50 aircraft per month by 2025/2026.
Despite this overall improvement the Max still faces challenges. It has yet to be recertified by the Chinese authorities although this is expected to be resolved soon. The FAA deadline for certification of the Max 7 and Max 10 variants has been pushed back by new legislation and they are now planned to enter service in 2023 and 2024 respectively.
Q1 2023 saw the delivery of the last B747 which like the B767 had not seen any passenger variants sold for several years. That has also been the case recently for the B777, but this is likely to change with the entry into service of the B777-8 and B777-9 from 2025. Boeing has also had quality and production problems with the B787, its main passenger twin-aisle offering. It suspended deliveries in May 2021 and restarted in Q3 2022. Production levels for are back at 3 aircraft per month going to 5 by the end of 2023 and 10 by 2025/2026. As with the Max Boeing holds a significant inventory of undelivered aircraft - 95 at the end of Q1 vs 100 at the end of 2022. Boeing has said it expects to deliver most of them within the next two years.
The number of commercial jets delivered by OEMs other than Airbus and Boeing remains subdued.
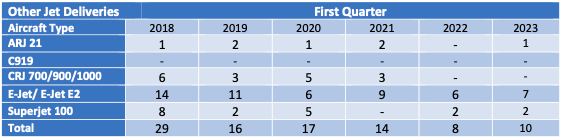
EasyJet recently announced that they will take delivery of 11 used A320 Ceo aircraft on lease through the Q1 2024. This illustrates the impact of the supply constraints described above and is noteworthy because low-cost carriers such as easyJet do not have large engineering departments like IAG and Lufthansa Group to facilitate the integration of used aircraft into their operations.
Airline Industry Financial Performance
We will address the latest IATA forecast below as part of our discussion of the airline credit outlook.
Global airline share prices have sold off significantly since March 2023, mainly due to a less favourable outlook for US airline earnings.
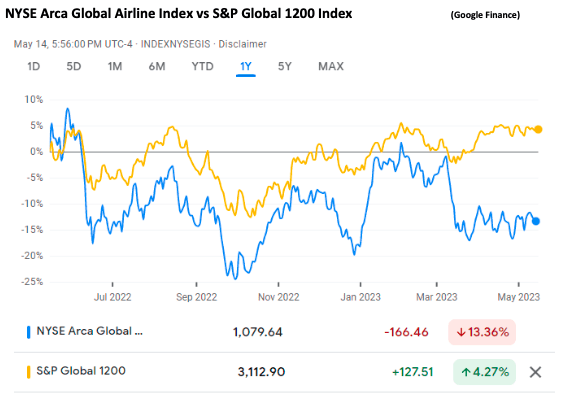
The largest airline to fail so far in 2023 is Go First of India. In its bankruptcy filing the airline declared its main problem was the need to ground about half its A320 Neo fleet due to problems with the PW1127G engine (see above). Viva Air suspended operations citing financial problems caused by the uncertainty around approval by the Colombian government of its acquisition by Avianca. Flyr filed for bankruptcy because of liquidity problems.
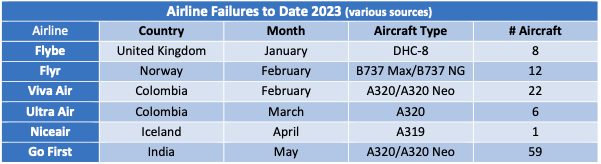
Special Topic – Airline Industry Credit Outlook
2022 was a tough year for airline defaults, mainly due to the effective expropriation of aircraft leased to Russian airlines after the invasion of Ukraine. Sirius conducts proprietary research into airline defaults and has assembled a dataset going back to 1970 which includes all airlines that have ever operated more than five passenger jet aircraft. Our data includes two types of defaults:
• Research-based defaults which are derived from a detailed study of industry sources; and
• Rules-based defaults which occur when the fleet of an airline based in a high-risk country
drops by 20% or more year on year. This approach is designed to capture informal defaults that may not involve formal bankruptcy proceedings.
Our methodology shows 2022 as the third-highest year for airline defaults by issuer after 2020 and 2008. To put airline industry experience in context the chart below compares it with the track record for Moody’s All Speculative Grade Issuers - this seems a reasonable comparison given the very small number of investment grade airlines. The average of airline defaults from 1994 is 3.5% p.a. vs 3.9% p.a. for the Moody’s universe so the former is not a uniquely risky industry, even if some of the risks it faces are unique given its global characteristics. Absent another geopolitical shock history suggests is it reasonable to expect a moderation in defaults for 2023 once there is reasonable economic outlook, and experience so far this year is in line with this expectation.
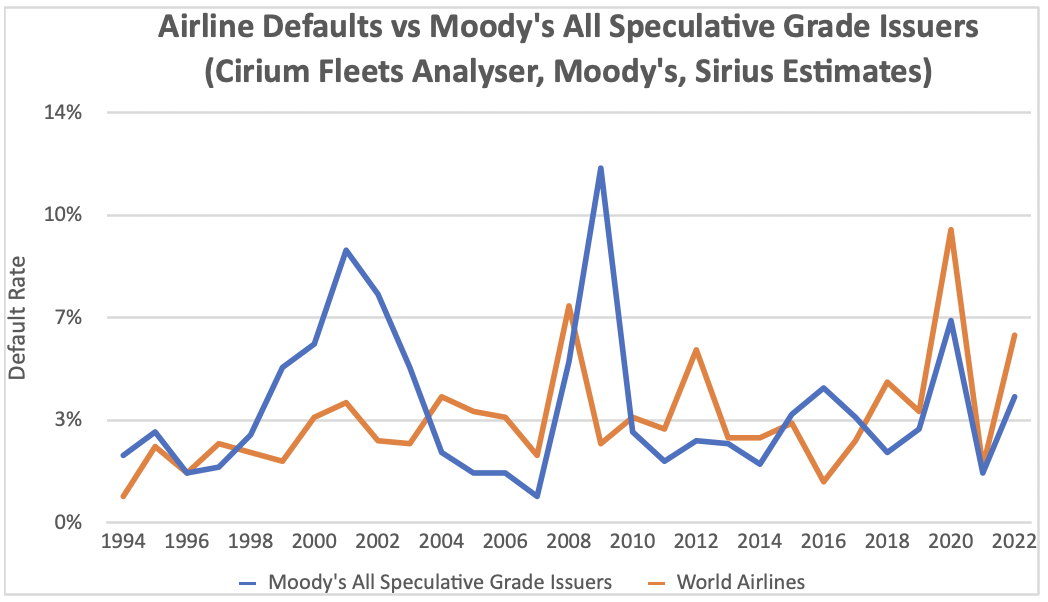
IATA’s semi-annual Global Outlook for Air Transport includes the most widely referenced forecast for airline industry financial performance. The December 2022 edition shows the airline industry returning to near breakeven in 2022 and moving into profit in 2023. North America is forecast to be by far the strongest performer followed by Europe while the Middle East, Asia-Pacific, Latin America and Africa remain loss-making through 2023. The differences in profitability are not very great apart from North America and Asia-Pacific, with 2023 EBIT margins for Africa, Europe, the Middle East and Latin America falling within a range of -1.1% to +0.8%. The single biggest reason for North America’s outperformance is its lack of exposure to the impact of a historically strong US Dollar, and the biggest reason for Asia-Pacific’s underperformance is relatively high government travel restrictions.
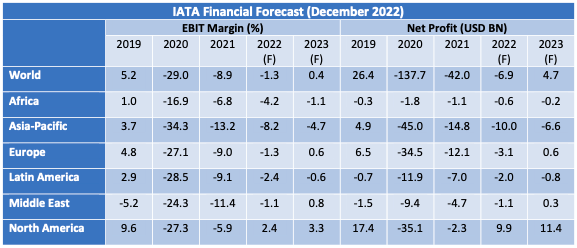
As we approach the half-way point of 2023 it might be useful to take a closer look at the assumptions behind IATA’s forecast and see how they look compared to actual outcomes so far this year.
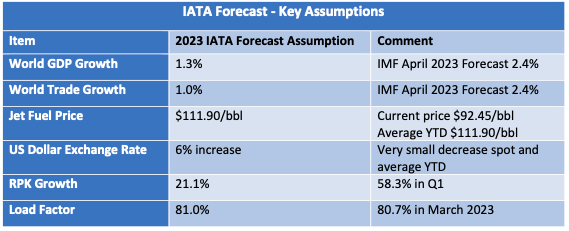
There are no key assumptions that appear too optimistic based on actual experience to date. The latest IMF forecasts for world output and trade in 2023 are in fact well ahead, but as we note above air travel growth at present is not tightly connected to the overall economy right now. A combination of lower fuel costs and a stable US Dollar should be helpful for airline margins, particularly outside of North America. Traffic growth has some potential to outperform. Although cumulative year on year growth will decline from the level achieved in Q1, by March RPKs were only 12% lower than in March 2019 and the overall forecast is for 2023 RPKs to be down 14.5% on 2019. These figures imply that a final traffic recovery is ahead of schedule, and on a further positive note global domestic bookings were 20% ahead of 2019 levels by mid-April. There is little chance of meaningful upside on load factors as these are already back near historic highs.
Another way to look at changes in airline industry credit status is to follow changes in public ratings. Ratings actions to date in 2023 have involved six upgrades and two downgrades as set out in the table below. The overall outcome here is modestly positive, as the upgrades apply to bigger airlines.
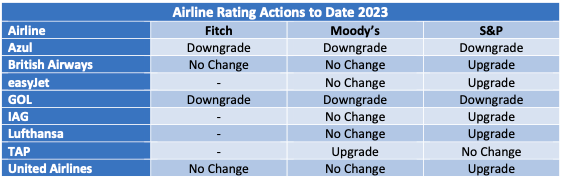
Our analysis of historic defaults suggests that the industry cycle is not necessarily the most important cause in periods where there is no extreme event such as the pandemic. Often there are factors specific to a particular airline that are more important such as quality of management, labour relations etc. One reasonably common occurrence is that an airline that did not avail of bankruptcy protection in a major downturn is forced to do so a few years later because of increased competition from airlines that did. Despite a reasonably positive industry outlook there is a good chance of this and other kinds of “aftershocks” occurring this year and next.
[1] RPKs is the acronym for revenue passenger kilometres, which is the product of the number of paying passengers times distance flown.
[2] ASKs is the acronym for available seat kilometres, which is the product of the number of available seats flown times distance flown.
[3] Airbus normally quotes its production rates based on an 11.5-month year for single-aisle aircraft.
Disclaimer
This Presentation has been made to you solely for general information purposes and is not intended to provide, and should not be relied upon for legal, tax, accounting, investment, or financial advice. This Presentation is not a sales material and does not constitute or form any part of any offer, invitation or recommendation to the recipient, its affiliates or any other person to underwrite, sell or purchase securities, assets or any other product, nor shall it or any part of it form the basis of, or be relied upon, in any way in connection with any contract or transaction decision relating to any securities, assets or any other product. None of Sirius, its affiliates or shareholders shall have any responsibility or liability to the recipient, its affiliates, shareholders or any third party in relation to this Presentation or any other document or materials prepared by Sirius or its affiliates, officers, directors, employees, advisers or agents. Sirius and its affiliates, officers, directors, employees, advisers and agents have taken all reasonable care to ensure that the information contained in this Presentation is accurate. Neither Sirius nor any of its affiliates, officers, directors, employees, advisors or agents has any obligation to update this Presentation. Under no circumstances should the delivery of this Presentation, irrespective of when it is made, create an implication that there has been no change in the affairs of the entities that are the subject of this Presentation. This Presentation may be updated and amended by a supplement and, where such supplement is prepared, this Presentation will be read and construed with such supplement. The statements herein which contain such terms as "may", "will", "should", "expect", "anticipate", "estimate", "intend", "continue" or "believe" or the negatives thereof or other variations thereon or comparable terminology are forward-looking statements and not historical facts. No representation or warranty, express or implied, is made as to the fairness, accuracy or completeness of such statements, estimates and projections. The recipient should not place reliance on any forward-looking statements. Neither Sirius nor its affiliates undertakes any obligation to update or revise the forward-looking statements contained in this Presentation to reflect events or circumstances occurring after the date of this Presentation or to reflect the occurrence of anticipated events. The information set out in this Presentation has been prepared by Sirius based upon various methodologies and calculations which it believes to be reasonable and appropriate. Past performance cannot be a guide to future performance. In preparing this Presentation, Sirius has relied upon and assumed, without independent verification, the accuracy and completeness of all information available from public sources or which was provided to it or otherwise reviewed by it. This Presentation supersedes and replaces any other information provided by Sirius or its affiliates, officers, directors, employees, advisers or agents in respect of the content of the Presentation. No information or advice contained in this Presentation shall constitute advice to an existing or prospective investor in respect of his personal position. None of Sirius, its affiliates, its or its affiliates’ officers, directors, employees or advisers, connected persons or any other person accepts any liability whatsoever for any loss howsoever arising, directly or indirectly, from this Presentation or its contents.
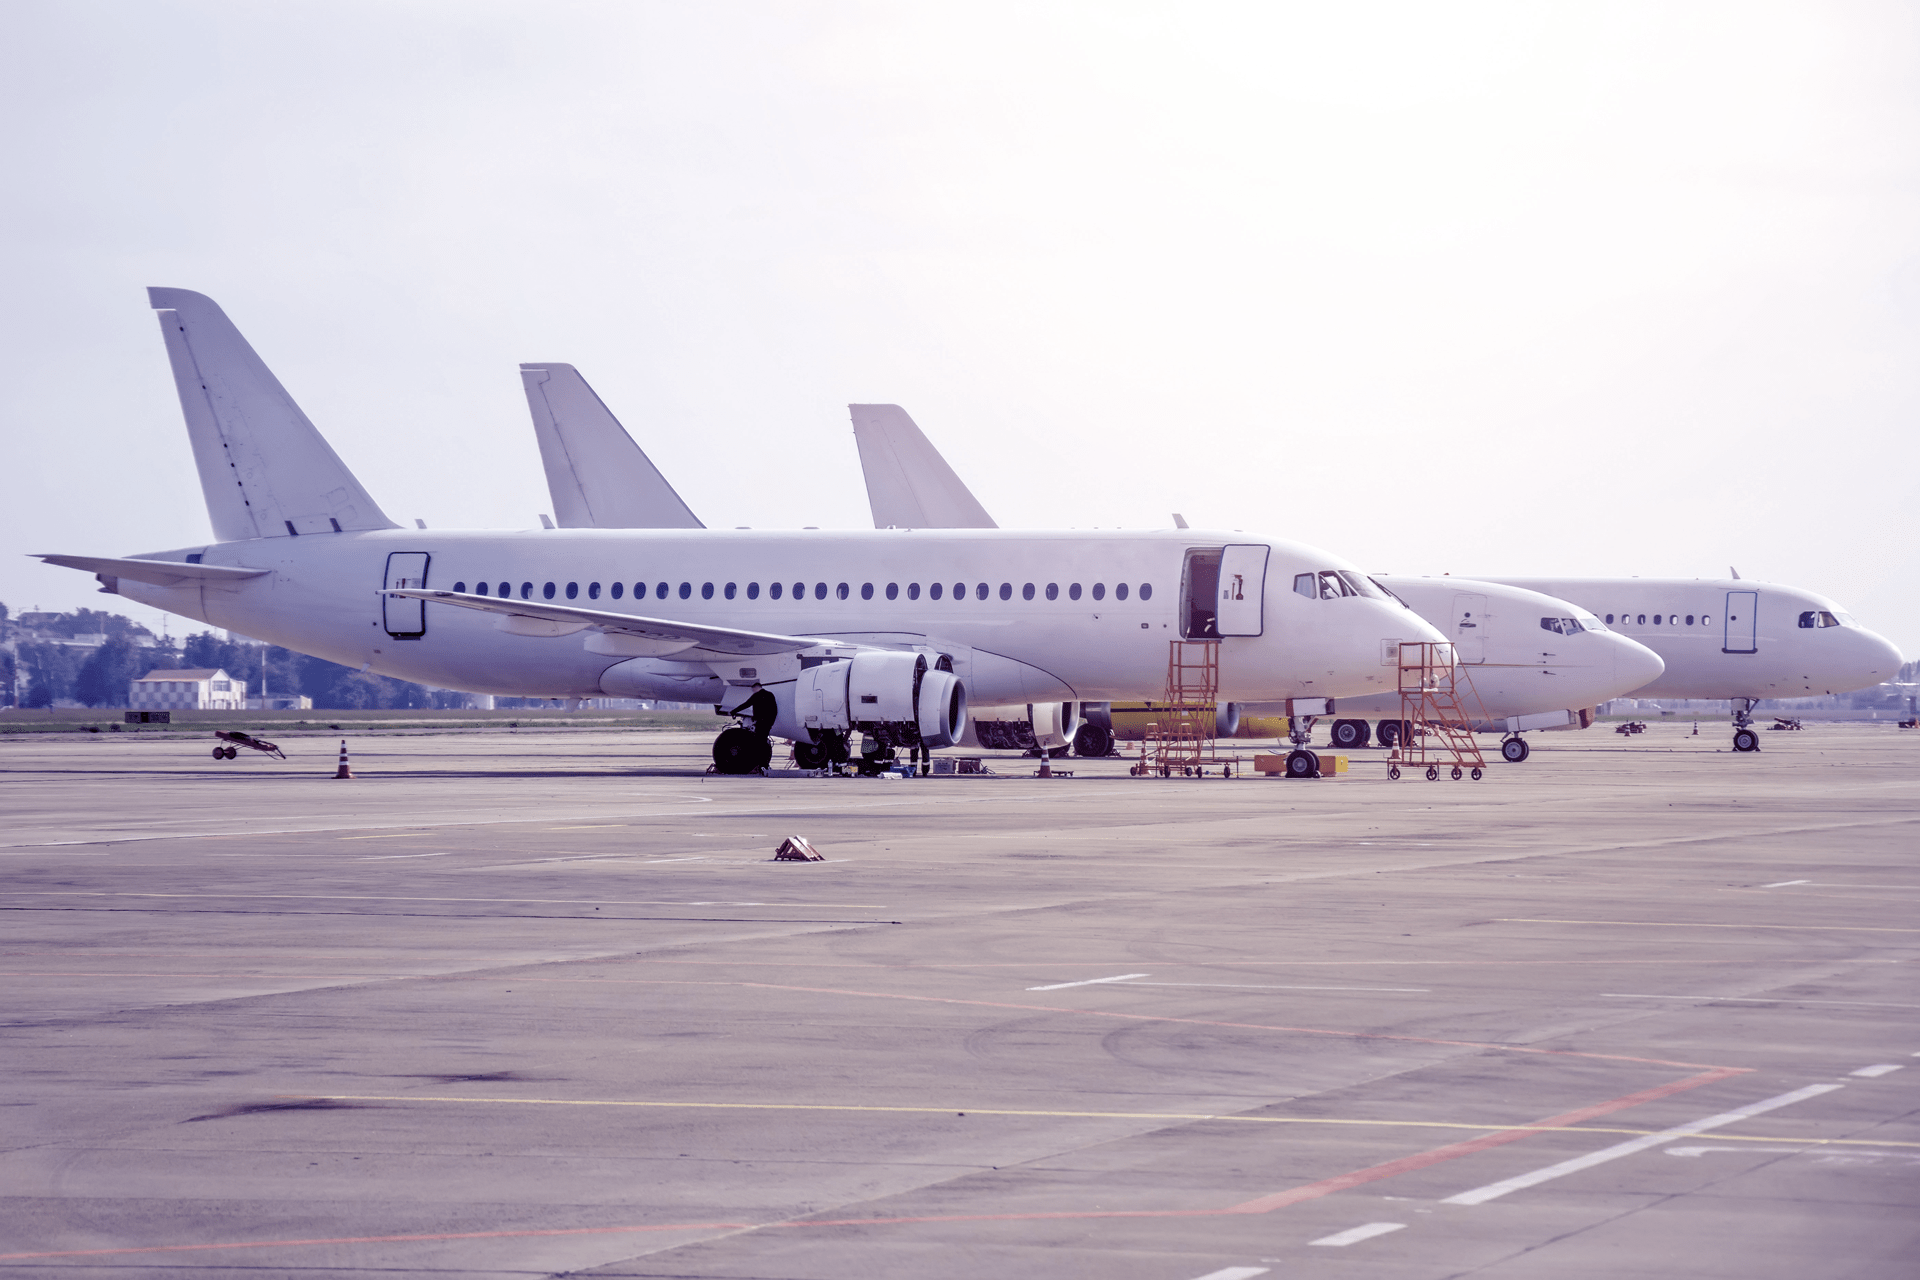
Industry Update Q4 2022
Macro-Economic Background
The IMF’s latest update to its World Economic Outlook (January 2023) shows a significant improvement on its forecast in October 2022. In retrospect this forecast probably discounted significant economic disruption from Russia’s invasion of the Ukraine that ultimately did not happen. Overall, for the entire period from the start of 2019 to the end of 2023 overall growth is back where it was estimated to be in the middle of last year.
Global economic growth is vital to the long-term growth of air travel. However, in the next few years the key drivers of growth will likely be very specific to the airline industry, especially the recovery from the industry downturn caused by the Covid 19 pandemic.
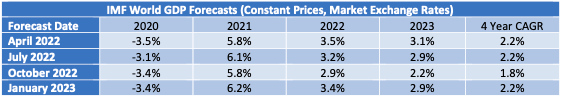
The US Dollar has weakened since its recent peak in September 2022, providing relief for airlines outside the US for dollar-denominated costs such as fuel, aircraft rents and aircraft spares. Jet fuel is also on a downwards trend, albeit with a lot of volatility.
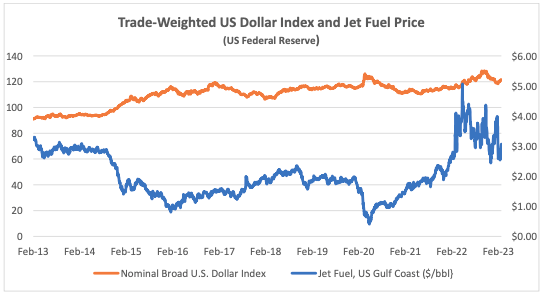
Another indicator that is potentially important to aircraft investors is the breakeven inflation rate on US Treasury Inflation-Protected Securities (TIPS). This indicator measures inflation expectations and it matters because used aircraft values are strongly influenced by the cost of new aircraft and over time this cost is linked to US Dollar inflation. In the short term this linkage is driven by escalation clauses in aircraft purchase contracts and in the long term by the general input cost environment for the aircraft manufacturers.
The chart below compares the breakeven rate for 10-year and 5-year TIPS to highlight the differences in expectations for the different time horizons. The shorter maturity has been more volatile, especially since the onset of the pandemic, but there is a strong overall correlation that suggests changed inflation expectations are not for a transitory “blip”.
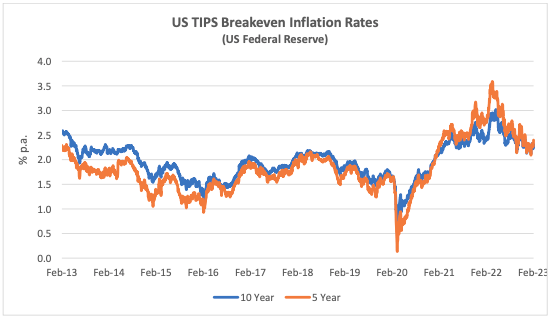
Traffic and Aircraft Demand
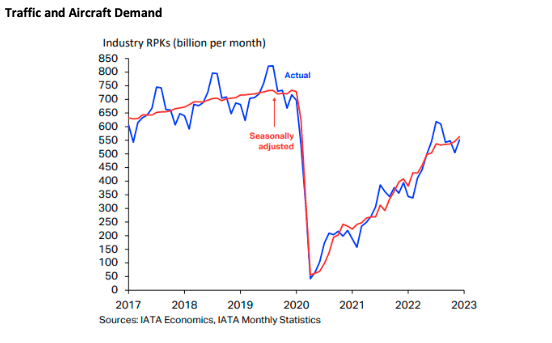
The strong recovery in air travel from the start of 2022 has continued through Q4 although overall RPKs for the month of December remained 23.1% below the comparable figures for 2019. Europe and the Middle East are the strongest performing regions because their recovery has mainly occurred this year, whereas the Americas already achieved a significant recovery in 2021. Asia- Pacific remains the weakest region (see discussion below).
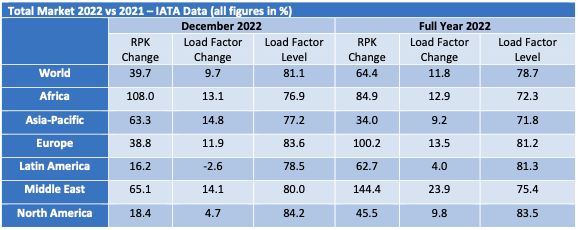
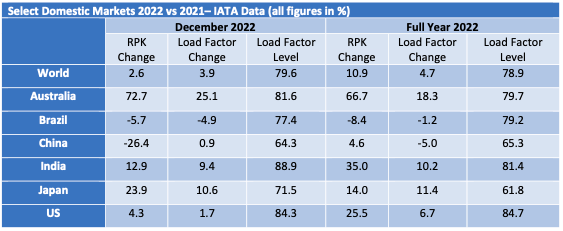
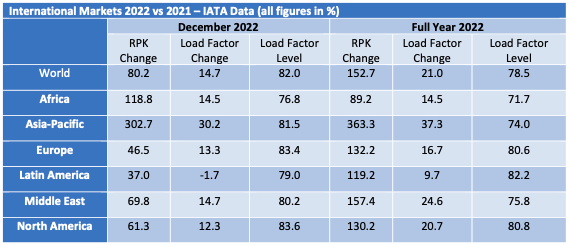
The main outlier in the pace of recovery has been the Asia-Pacific region due to a much slower relaxation of government restrictions on international travel and the impact of China’s zero-Covid policy on its domestic market. To illustrate this the chart below compares traffic in 2019 and 2022 for Asia-Pacific and ROW (Rest of the World). Although ROW international traffic has recovered more slowly than ROW domestic, this is mainly down to drop in flights from other regions to Asia- Pacific (IATA’s regional statistics are based on the airline’s domicile rather than traffic flows).
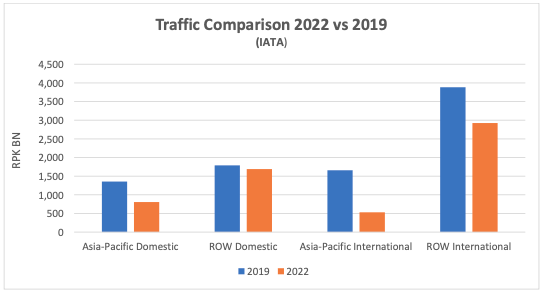
Although some short-haul aircraft serve international routes nearly all long-haul aircraft do so, and this is reflected in the relative demand for single-aisle (narrowbody) and twin-aisle (widebody) aircraft. Aircraft demand can be measured in terms aircraft in service and ASKs[1], the standard measure of aircraft capacity deployed by airlines which indicates how intensively aircraft are being flown. Single aisle aircraft in service levels are now very close to where they were in 2019 with a slightly weaker recovery in ASKs due to lower utilization. The comparable figures for twin aisle aircraft remain much weaker.
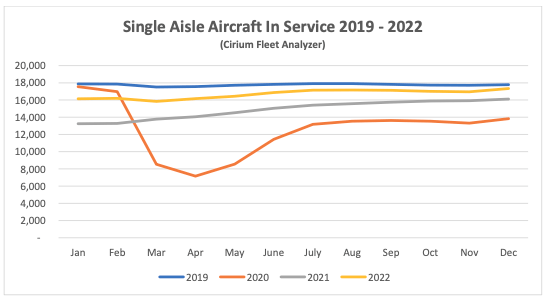
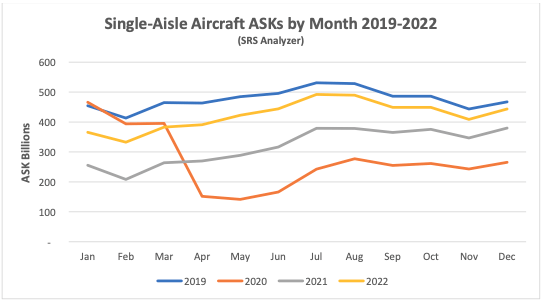
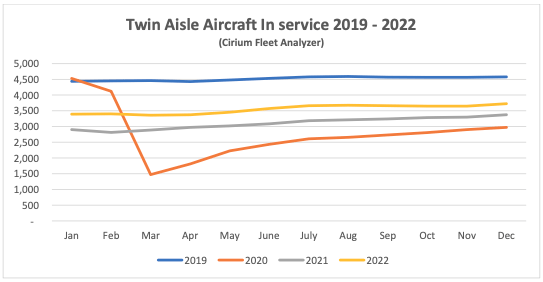
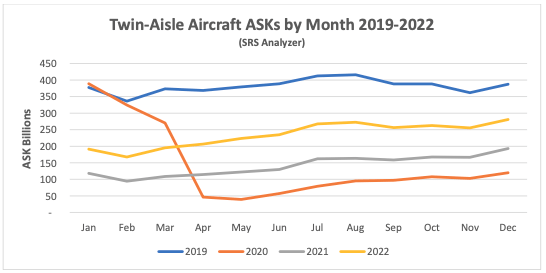
New Aircraft Supply

Airbus missed its delivery 2022 target significantly. Its final total of 661 aircraft compared with an initial target of 720, which was reduced to 700 around the beginning of Q4. The shortfall was caused by supply chain problems, particularly with engines.
The latest status of Airbus’s production plans is:
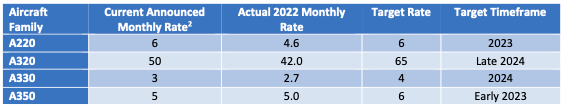
Airbus recently announced delays in planned production increases for the A320 family due to supply chain problems. The increase to 65 aircraft per month has slipped by about a year to late 2024 and the further increase to 75 has gone from mid-decade to late 2026. Some planned increases for twin- aisle aircraft were announced, with the A330 Neo going from 3 to 4 per month in 2024 and the A350 going from 5 to 6 per month later this year, and possibly going to 9 by the end of 2025.
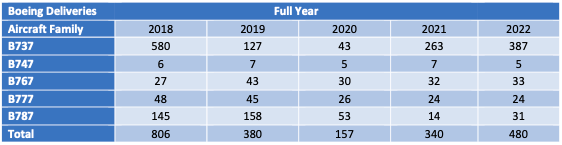
The latest status of Boeing’s production plans is:
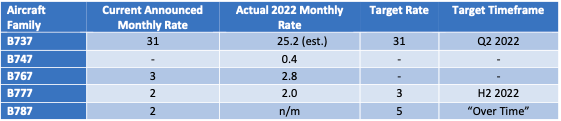
Boeing significantly increased B737 Max deliveries in 2022 and by year end had achieved the target monthly production rate of 31 that it announced when it resumed production in 2021. Boeing’s inventory of manufactured but undelivered B737 Max aircraft is dropping slowly, from 335 aircraft at the end of 2021 to 250 at the end of 2022 (our estimated actual monthly production rate nets off the inventory reduction of 85 from 387 total deliveries). Boeing has stretched out the period over which it expects to deliver these aircraft. Its most recent guidance is that it will reduce this inventory at a rate of 8-10 per month with some deliveries not occurring until 2025. Earlier discussion of an increase in production to 38 per month has been shelved due to supply chain problems.
Despite this overall success the B737 max still faces challenges. It has yet to be recertified by the Chinese authorities although this is expected to be resolved soon. The FAA deadline for certification of the B737 Max 7 and Max 10 variants has been pushed back by new legislation and they are now planned to enter service in 2023 and 2024 respectively.
Boeing has also had quality and production problems with the B787, its main passenger twin-aisle product (nearly all B747, B767 and B777 deliveries are freighters or tankers). It suspended deliveries in May 2021 and restarted in Q3 2022. Production levels for now remain “very low”, and 100 undelivered aircraft are in inventory. Boeing has said it expects to deliver most of them within the next two years.
The number of commercial jets delivered by OEMs other than Airbus and Boeing declined slightly in 2022 but outcomes varied significantly by manufacturer. There was a big reduction for the SSJ due to the impact of sanctions on Sukhoi, particularly the announcement by the SSJ’s engine supplier Powerjet that it is withdrawing from the Russian market. There were increases for Embraer and COMAC, and the latter delivered its first C919 which is a medium sized single-aisle aircraft that competes directly with the A320 and B737 aircraft families. This is a big step forward for Chinese aircraft manufacturing and the C919 will likely be the focus of much curiosity within the industry as to its performance in terms of operating economics and productivity.
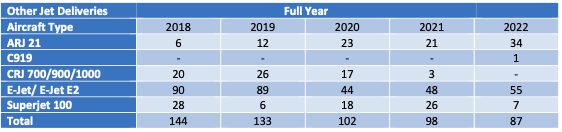
Airline Industry Financial Performance
IATA’s December 2022 financial forecast shows the airline industry returning to near breakeven in 2022 and moving into profit in 2023. North America is by far the strongest performer followed by Europe and the Middle East. Asia-Pacific, Latin America and Africa remain loss-making through 2023. The differences in profitability are not very great apart from North America and Asia-Pacific, with 2023 EBIT margins for Africa, Europe, the Middle East and Latin America falling within a range of - 1.1% to +0.8%. The single biggest reason for North America’s outperformance is its lack of exposure to the impact of a historically strong US Dollar, and the biggest reason for Asia-Pacific’s underperformance is relatively high government travel restrictions.
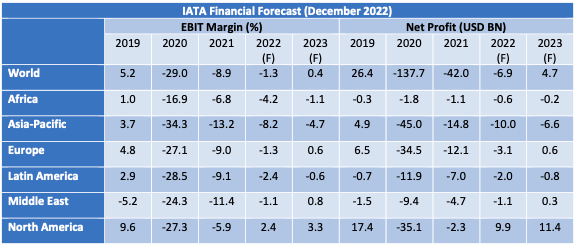
Global airline share prices have improved since the end of 2022, outperforming the overall market. Despite macro headwinds robust travel demand is allowing for higher ticket prices and capacity is constrained by airline failures, a low level of airline start-ups and low new aircraft deliveries.
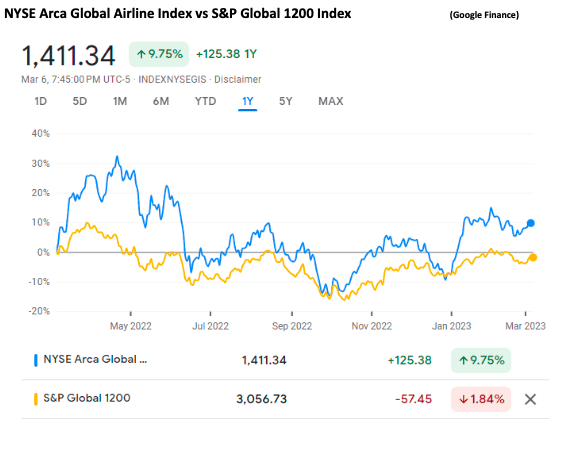
The major airline credit event in 2022 was the effective confiscation of aircraft leased to Russian airlines by western lessors, which we discussed in detail in our Q1 2022 publication. There has been no fundamental change since then, although recent reports that some western aircraft are being cannibalised for spare parts is in line with our discussion of likely future developments.
In July 2022 SAS applied for Chapter 11 bankruptcy protection in the US courts. This is the only major airline bankruptcy so far this year. We have not been able to identify any other significant airline failures outside Russia since the start of 2022. Also, in June Comair (South Africa) entered liquidation after a successful restructuring in 2020. These events illustrate the fragile financial condition of many airlines post-pandemic and their vulnerability to adverse events such as the pilot strike at SAS. Hong Kong Airlines entered bankruptcy proceedings in the Hong Kong and London courts in December, but these proceedings appear to be designed to implement a pre-agreed restructuring following the bankruptcy of its shareholder Hainan Airlines Group in 2021.
Given the high level of fuel prices and the US Dollar there is a good chance of further failures this winter, particularly if there is a recession (already in January 2023 Flyr of Norway and Flybe of the UK have filed for bankruptcy).
Special Topic – Aircraft Economic Life
When the negative impact of Covid 19 on air traffic was understood in 2020 there was much speculation that the increase in stored aircraft would be the precursor to a spike in aircraft retirals. Looking back from early 2023 this speculation seems to have been misplaced - retirals in 2020 through 2022 turned out to be lower in absolute and relative terms than in 2019. This chart and the others in this discussion refer to passenger aircraft only – although some passenger aircraft have their lives extended by conversion to freighter and other uses the numbers are relatively small.
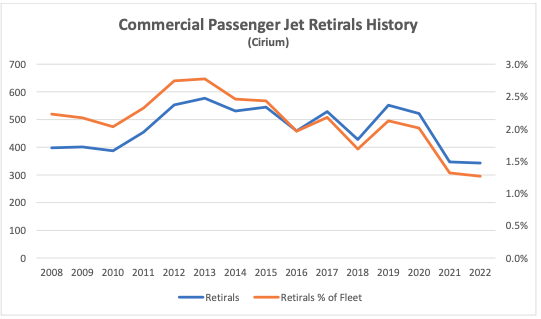
There was a big spike in aircraft storage but, as in previous industry downturns this did not result in an increase in retirals.
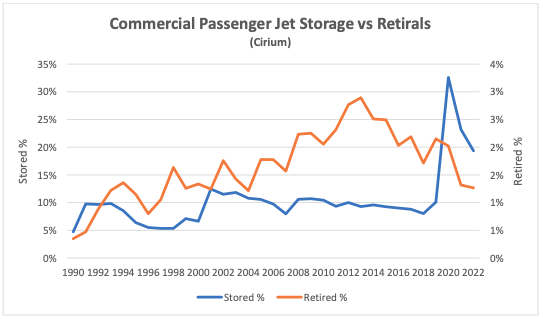
The chart below average fleet and retirement ages from 1990. Both are relatively stable, especially fleet age (the small increase from 2018 reflects the big drop in new aircraft deliveries discussed above).
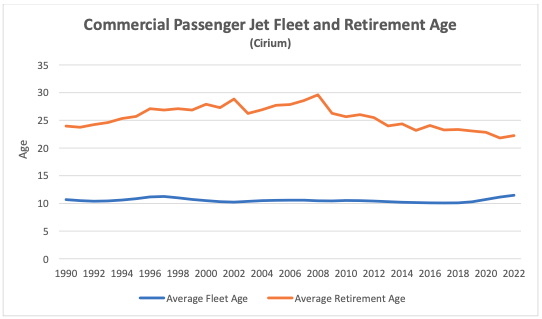
There is more variability in retirement age, but the main changes here seem to be more secular than cyclical, and in particular there has been a marked drop in average retirement age since the financial crisis. There are some possible explanations that do not bear too much scrutiny:
• Aircraft supply and demand is an unlikely explanation given that the two peaks in retirement age coincide with the aftermath of 9/11 and the onset of the financial crisis; and
• Fuel prices probably do have an impact, but retirement age is much less cyclical.
Part of the answer is looking at who controls the aircraft[3] For the last 20 years lessors have consistently retired aircraft at a younger age than airlines and during this period their fleet share has increased from 25% to 48%.
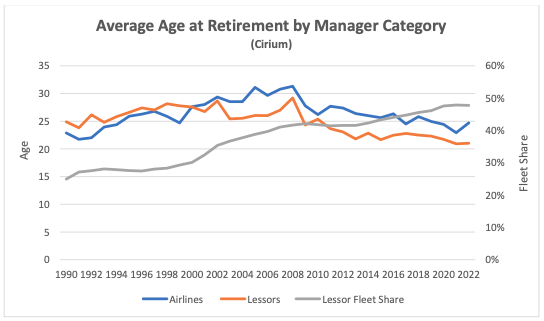
Lessors obviously need a good reason to retire aircraft as this results in an opportunity loss of revenue. However, lessors have to make a commercial judgement which also takes account of the costs associated with obtaining this revenue and the break-up value of the aircraft. Costs may include both overhaul and reconfiguration expense if a new airline operator is being sought.
Break-up value is largely driven by engine values, which are in turn very dependent on the value of engine spare parts. The engine manufacturers have an effective monopoly on new spare parts and have historically enjoyed significant pricing power until c.10 years from when the relevant aircraft type ceases production. For many years engine spare parts prices have increased by 6-7% p.a. while new aircraft prices have increased by 1.0-1.5% p.a.
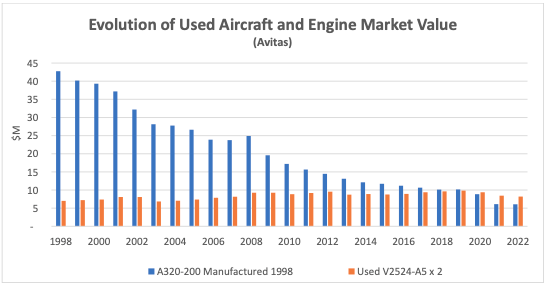
These trends have created a situation where stand-alone engine values can exceed an aircraft’s value including engines well before the point where the aircraft has reached its potential service life. Where an existing airline operator is happy to extend a lease, a lessor will have very little cost associated with extending its revenue stream and is likely to choose this option so not all aircraft will be broken up at the same age.
It should be borne in mind that not all engine types have the same level of marketability. The CFM56 and V2500 engine types associated with the A320 Ceo and B737 NG aircraft families are maintained by several different market participants who compete to buy used engines. Where engines are subject to a total care agreement with the engine OEM this is generally not the case as the engine OEM is the sole supplier of engine maintenance services.
One way to test the importance of break-up values is to look at what has happened with different members of the A320 Ceo and B737 NG families. Break-up values are very similar for all family members but the larger aircraft types command higher rents, so if break-up values matter, we should expect to see smaller types retired earlier and in greater numbers. The chart below shows how the different family members have performed through 2022. Smallest to largest aircraft types are presented left to right.
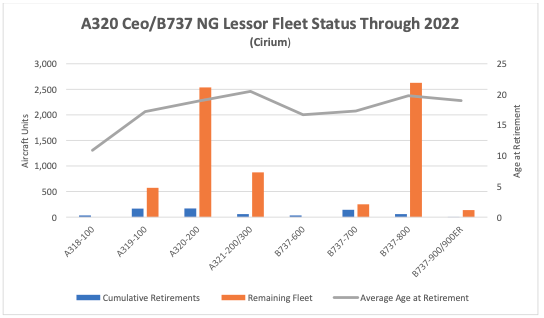
Based on the chart this approach helps to explain what is happening in the single-aisle aircraft market. However there has been a similar pattern of earlier retirement ages for small regional jets and twin-aisle aircraft where there is a much less robust engine market. It may well be that lessor decisions for these aircraft classes are driven by the same kind of economic analysis as for single- aisle aircraft, but the lessors have fewer and less attractive options.
[1] ASKs is the acronym for available seat kilometres, which is the product of the number of seats flown and distance flown.
[2] Airbus normally quotes its production rates based on an 11.5-month year for single-aisle aircraft.
[3] For the purposes of this discussion, we use the Cirium Fleets Analyser concept of aircraft Manager to denote control.