
Macro-Economic Background
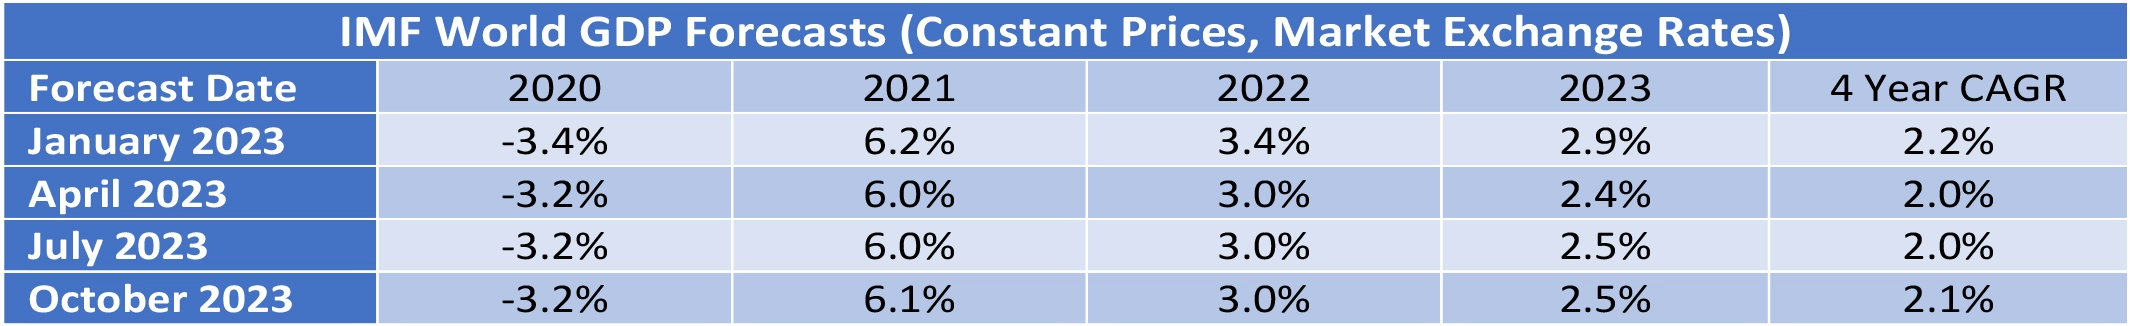
The IMF’s latest update to its World Economic Outlook (October 2023) shows a marginal improvement from their April update. The IMF’s discussion of the world economy centres on the impact of central banks’ efforts to control inflation which is causing moderately low growth by historical standards. This situation is expected to persist through 2024.
Global economic growth is a key driver of long-term growth of air travel. However, since early 2022 its impact has been overshadowed by the fall and recovery in traffic associated with the Covid 19 pandemic. As recovery is largely complete the influence of overall economic conditions on air travel is likely to reassert itself.
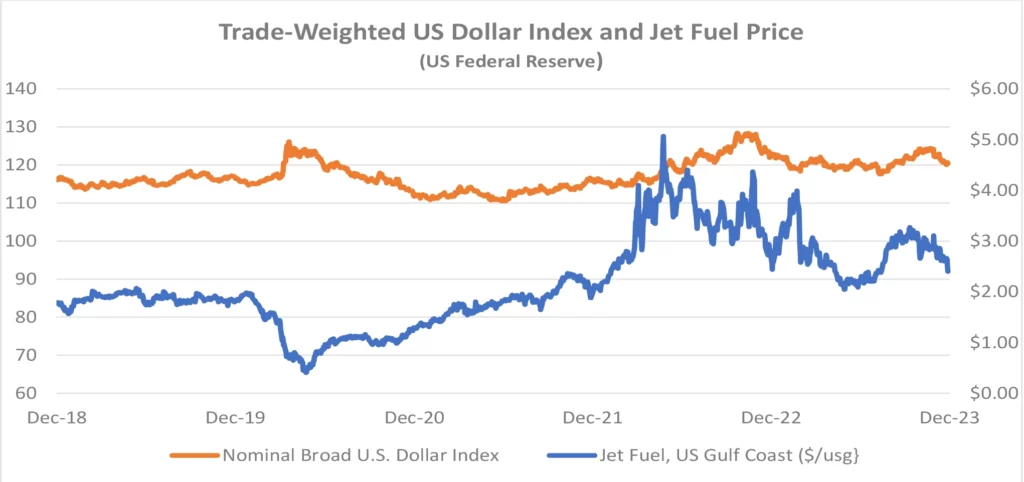
The US Dollar has weakened since its recent peak in September 2022, providing relief for airlines outside the US for dollar-denominated costs such as fuel, aircraft rents and aircraft spares.
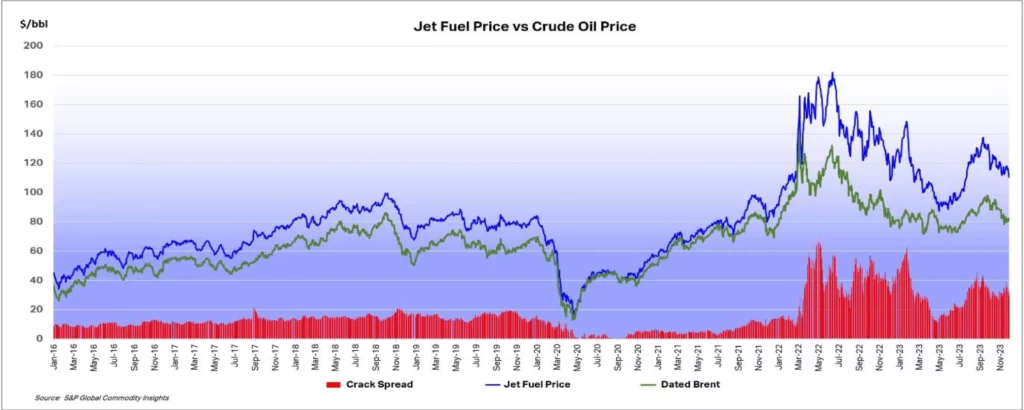
The price of jet fuel has fallen back after a sharp increase through September. The IATA chart below shows that a key characteristic of current jet fuel market conditions is the historically high level of the “crack spread”[1]at over $30 per barrel. Some of the issues that have contributed to this increase include the pace of traffic recovery, especially in Asia Pacific, and reported local refinery issues in the US and Europe. It seems reasonable to expect that the crack spread will reduce over time but with a lot of volatility around this trend.
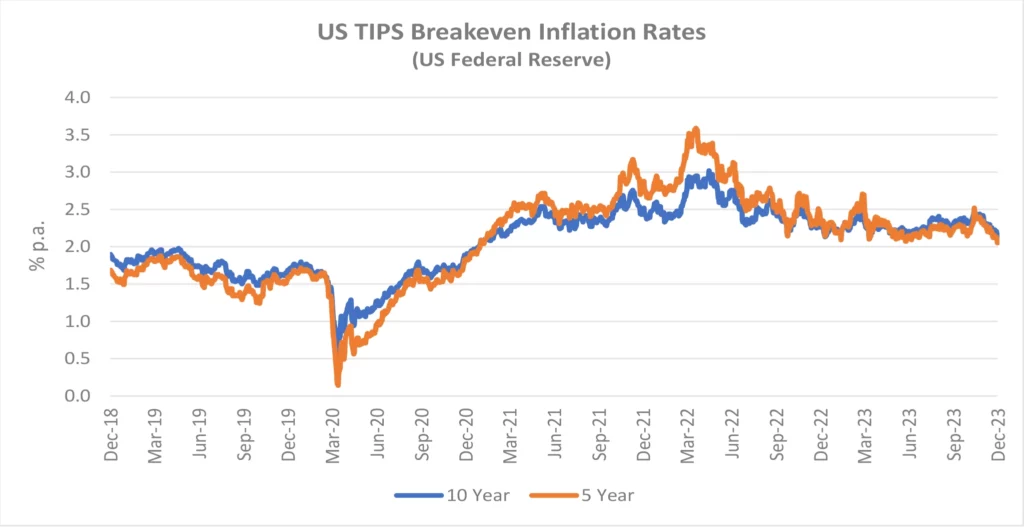
Another indicator that is potentially important to aircraft investors is the breakeven inflation rate on US Treasury Inflation-Protected Securities (TIPS). This indicator measures inflation expectations and it matters because used aircraft values are strongly influenced by the cost of new aircraft and over time this cost is linked to US Dollar inflation. In the short term this linkage is driven by escalation clauses in aircraft purchase contracts and in the long term by the general input cost environment for the aircraft manufacturers. The chart below compares the breakeven rate for 10-year and 5-year TIPS
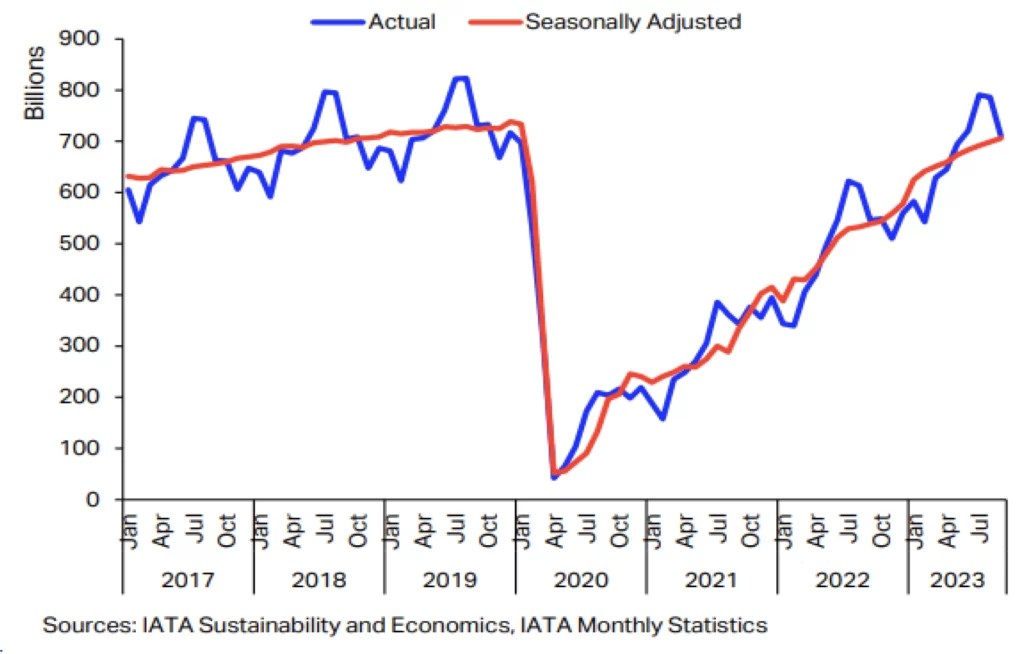
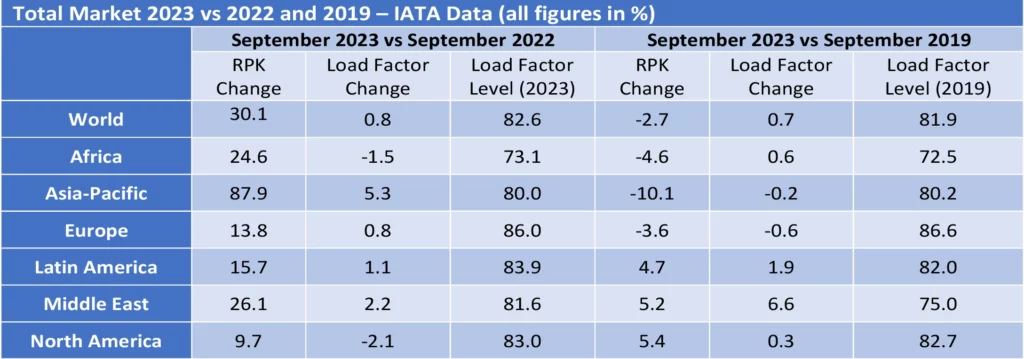
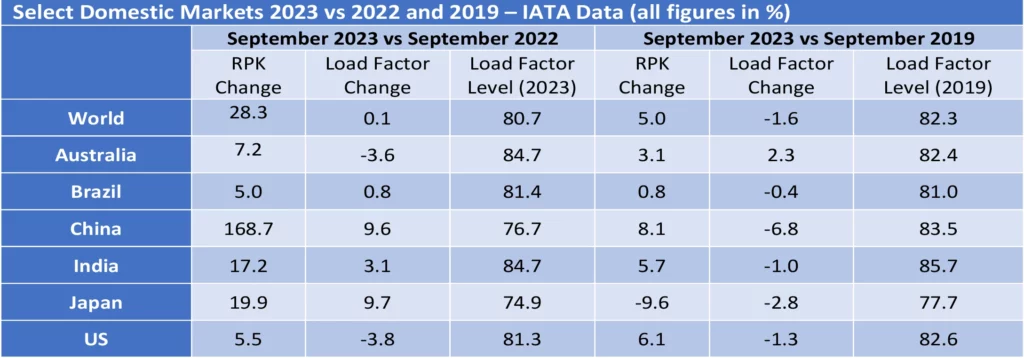
The strong recovery in air travel from the start of 2022 has continued through 2023 and overall RPKs for the month of September were only 2.7% below the comparable figures for 2019. Asia Pacific was the strongest performing regions as government restrictions (especially in China) were finally relaxed. As in 2022, there was a much bigger increase in international traffic vs domestic traffic, mainly because the former is still coming off a much lower base.
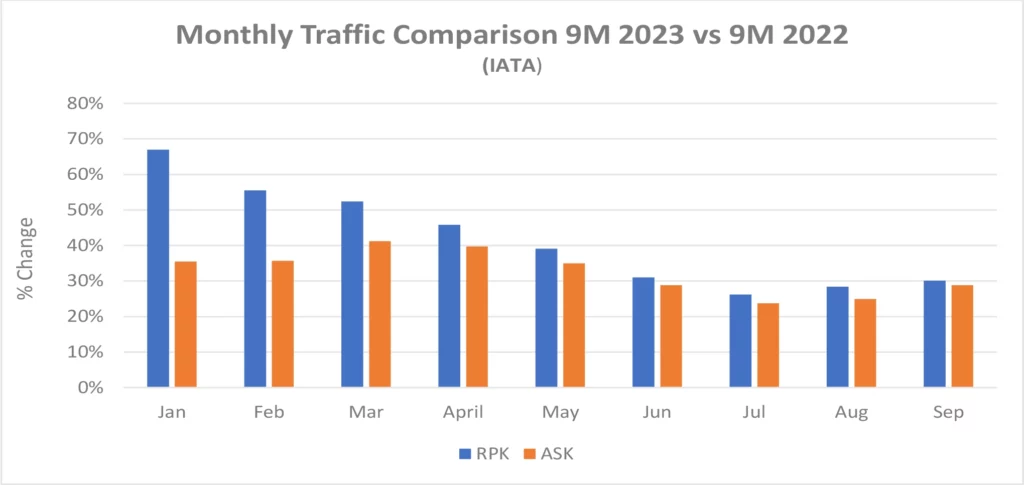
The chart below shows the changes in RPKs[2] and ASKs[3] by month and has a pattern that we expect to continue through the rest of the year. First the level of increases in RPKs gradually reduces because the year-on-year comparison is with a month in 2022 that was subject to a greater level of traffic recovery. Second the rate of increase in RPKs and ASKs becomes more alike as the recovery in load factors is largely complete, so additional capacity needs to be deployed to support further traffic growth.
IATA’s recent reports on passenger traffic note that seven-day forward bookings have been flat-lining since early November mainly due to weakness in domestic China, but it mat be too early to call the end of the recovery given that demand in many regions remains extremely robust.
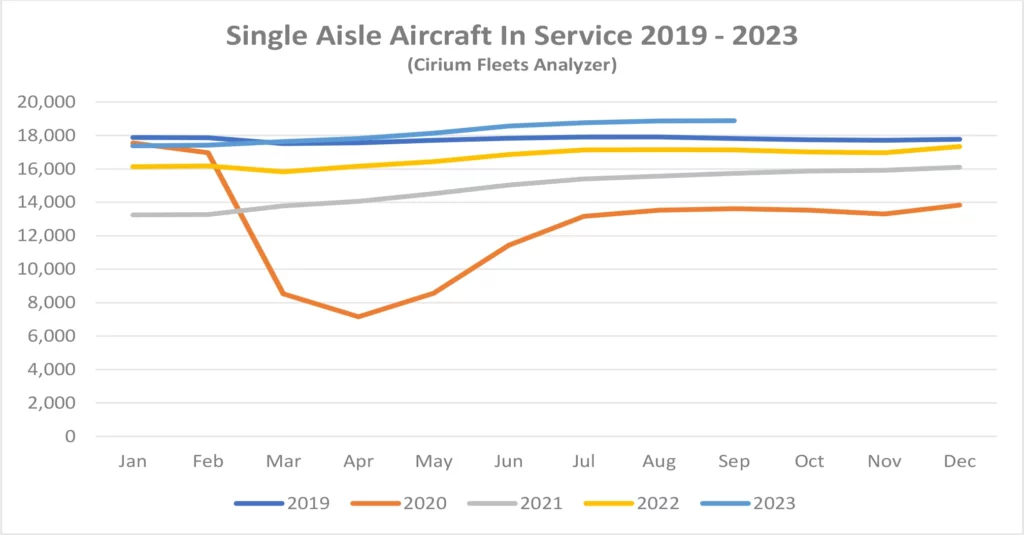
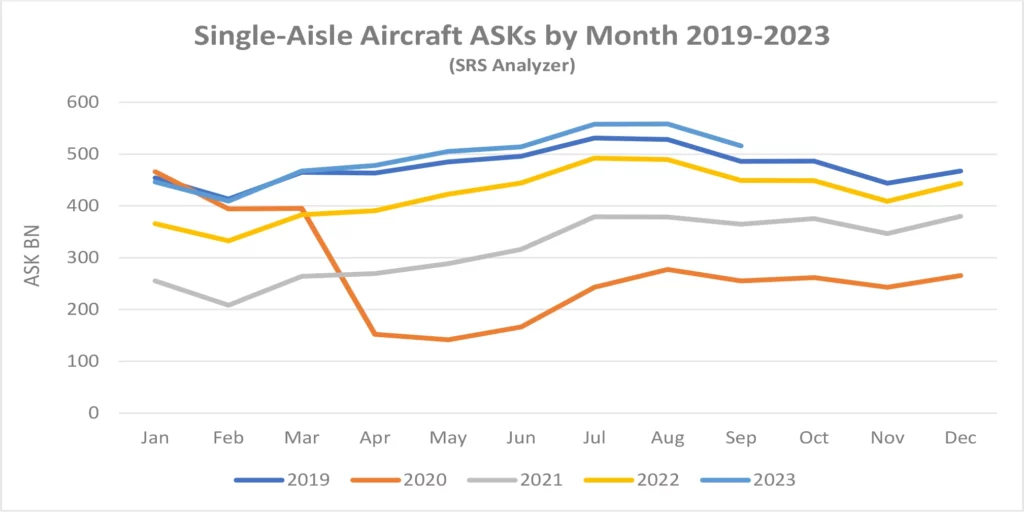
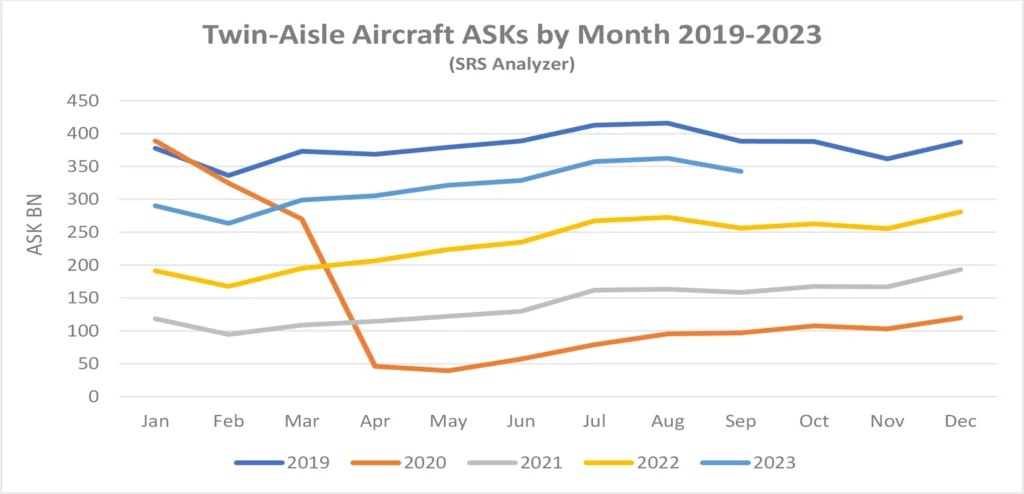
Although some short-haul aircraft serve international routes nearly all long-haul aircraft do so, and this is reflected in the relative demand for single-aisle (narrowbody) and twin-aisle (widebody) aircraft. Aircraft demand can be measured in terms of aircraft in service and ASKs, the standard measure of aircraft capacity deployed by airlines which indicates how intensively aircraft are being flown. Single aisle aircraft in service and ASK levels for Q2 2023 were ahead of the comparable period in 2019. This is consistent with the 5.1% increase in domestic traffic in June 2023 compared to June 2019.
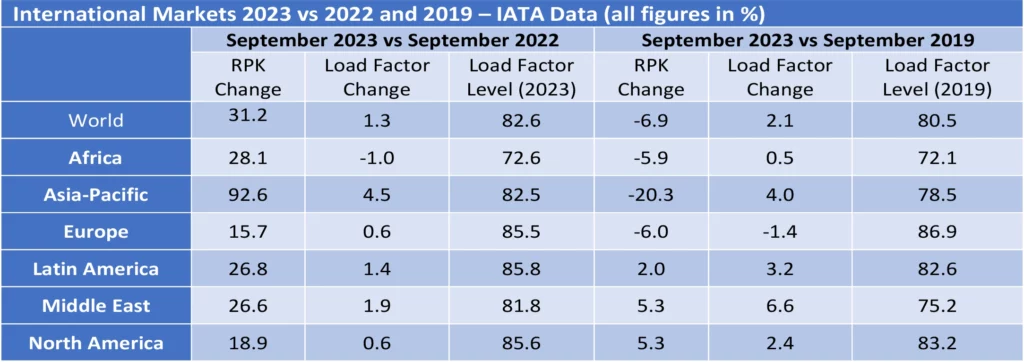
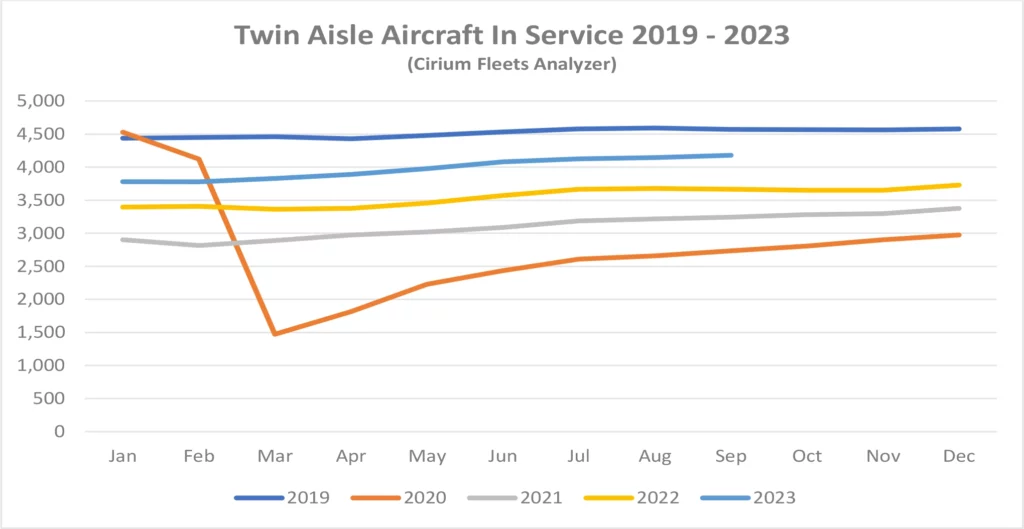
Full recovery has yet to be achieved for twin-aisle aircraft, mainly due to weak traffic to and from, and within the Asia-Pacific region. The figures by region in the tables above are based on airline domicile, so weak Europe to Asia traffic reduces recorded international RPKs in other regions. Twin-aisle aircraft in service has shown a greater improvement relative to 2019 than ASKs which suggests that aircraft are being returned to service with lower utilisation in anticipation of continued recovery.
New Aircraft Supply
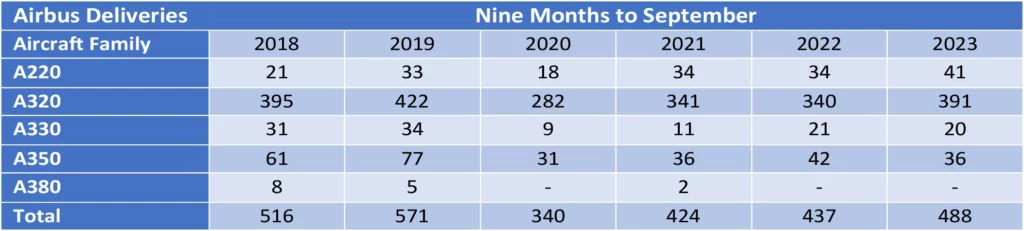
Airbus missed its 2022 delivery target significantly due to supply chain problems. Its final total of 661 aircraft compared with initial guidance of 720 It has once again set a target of 720 deliveries for 2023. This year’s guidance has a good chance of being realised as Airbus has a historic pattern of high deliveries in Q4 compared to the rest of the year and deliveries through September were 51 ahead of 2022.
The latest status of Airbus’s production plans is:
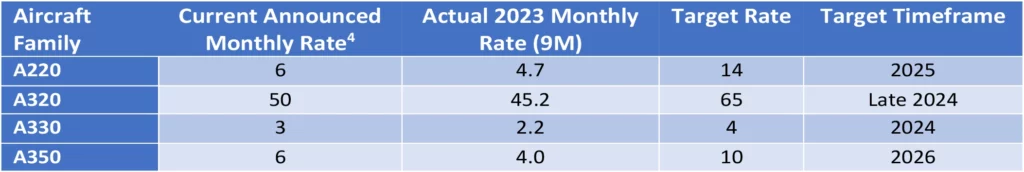
The only significant production target not captured in the table above is the objective to raise A320 family production to 75 per month by 2026.
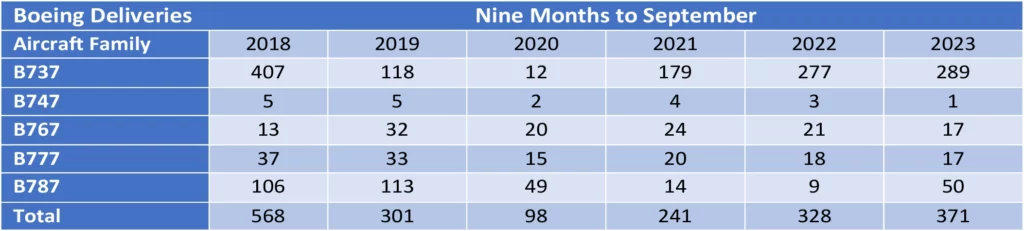
The latest status of Boeing’s production plans is:
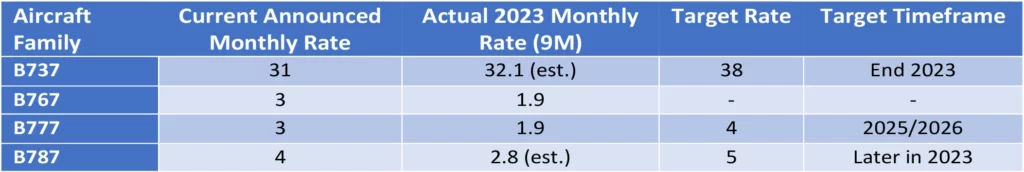
Boeing has reduced its guidance for B737 Max deliveries in 2023 from between 400 and 450 to between 375 and 400. This is mainly due to manufacturing problems such as the requirement for rework of some fuselage sections manufactured by Spirit AeroSystems. B737 inventory increased from 220 to 250 in Q3 so it is back to where it was at the start of the year. Any significant further reduction is probably dependent on their ability to restart deliveries to Chinese airlines (85 of the aircraft in inventory are contracted for delivery to China). Boeing has also announced a medium-term production target of 50 aircraft per month by 2025/2026. The FAA deadline for certification of the Max 7 and Max 10 variants has been pushed back by new legislation and they are now planned to enter service in 2024 (Boeing had previously targeted EIS for the Max 7 in 2023).
Q1 2023 saw the delivery of the last B747 which like the B767 had not seen any passenger variants sold for several years. That has also been the case recently for the B777, but this is likely to change with the entry into service of the B777-8 and B777-9 from 2025. Boeing has also had quality and production problems with the B787, its main passenger twin-aisle offering. It suspended deliveries in May 2021 and restarted in Q3 2022. Production levels for are back at 3 aircraft per month going to 5 by the end of 2023 and 10 by 2025/2026. As with the Max Boeing holds a significant inventory of undelivered aircraft – 75 at the end of Q3 vs 100 at the end of 2022. Boeing has said it expects to deliver most of them within the next two years.
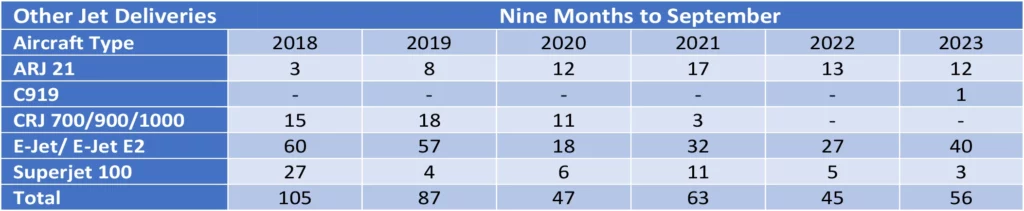
The number of commercial jets delivered by OEMs other than Airbus and Boeing remains subdued.
The reduction in new aircraft production by Airbus and Boeing compared to 2018/2019 has had a major impact in mitigating the impact of the pandemic on the balance of aircraft supply and demand. Major lessors such as AerCap and Aircastle have reported unusually strong demand for lease extensions of both single-aisle and twin-aisle used aircraft as airlines seek to lock in existing capacity given the uncertainty around future deliveries. These comments confirm what Sirius has seen in the market from early 2023. This quarter’s special topic discussion will cover the capacity issue in more detail.
Airline Industry Financial Performance
The most recent IATA financial forecast which was discussed in our Q1 2023 update showed upward revisions for 2023 industry net income forecasts and there have been some very strong Q2 2023 earnings reported by major European airlines.
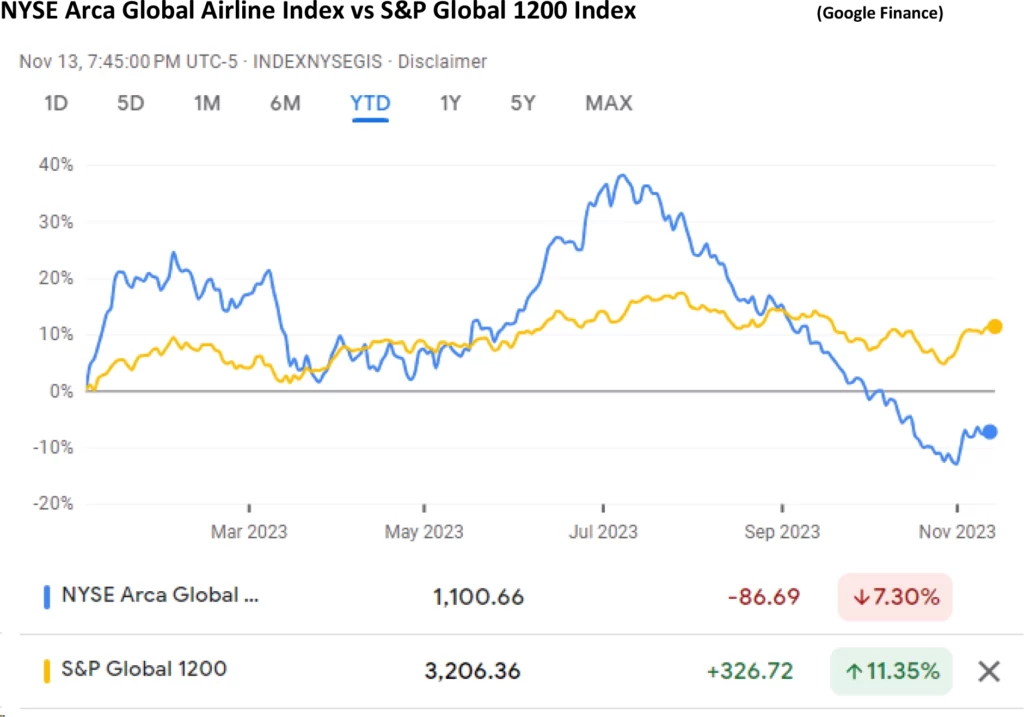
Despite this positive background global airline share prices have been volatile in both absolute and relative terms. Recent market concerns include the potential softening of airlines pricing power, increased costs especially fuel and maintenance, and in some cases operational disruption caused by requirements for increased engine maintenance.
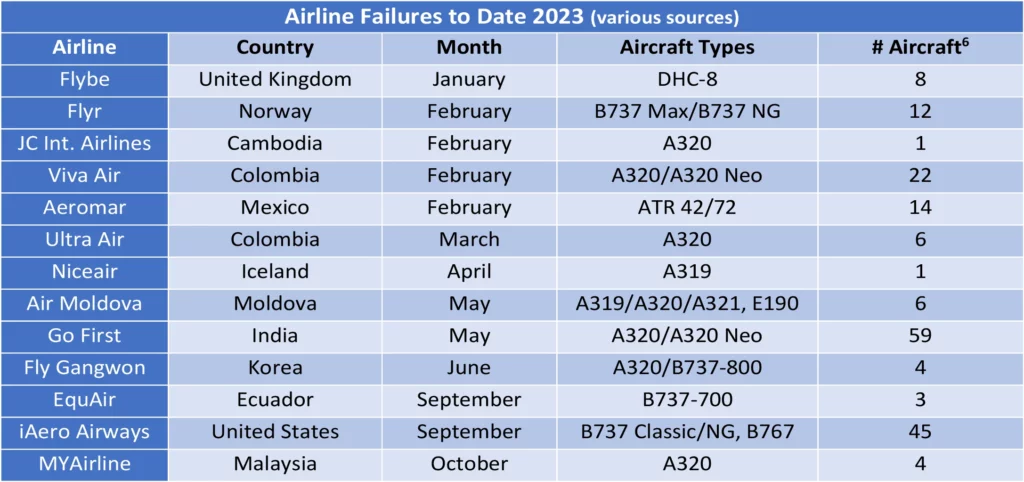
The largest airline to fail so far in 2023 is Go First of India. In its bankruptcy filing the airline declared its main problem was the need to ground about half its A320 Neo fleet due to problems with the PW1127G engine (see above). Viva Air suspended operations citing financial problems caused by the uncertainty around approval by the Colombian government of its acquisition by Avianca. Flyr filed for bankruptcy because of liquidity problems. iAero Airway’s Chapter 11 filing in September is not as financially significant as the number of aircraft involved might suggest – its current fleet of 43 aircraft is on average 28 years old and the airline was a marginal provider of capacity through the ACMI market[5].
A significant new development in airline credit is a series of settlement payments by Russian insurers in respect of claims by aircraft lessors relating to the effective expropriation of their aircraft after Russia’s invasion of the Ukraine in 2022. These transactions typically involve the transfer of aircraft ownership to a Russian entity and reduce outstanding claims under other insurance policies. There is relevant government approval for all of them under sanctions legislation.
The major lessors had to write off substantially all their investment in aircraft in Russia in their 2022/2023 financial years amounting to c. $10BN in total across the industry. This very conservative approach was driven by the uncertainty of the amount and timing of recoveries under various insurance policies, including contingent risk insurance policies. These payments indicate that the additional protections the lessors procured as part of their original risk management strategy are starting to pay off in a material way.
Special Topic – How tight is airline capacity?
There is strong evidence that demand for aircraft has tightened up significantly in the last 12 months. Our regular analysis of trends in aircraft in service and ASKs supports this view, along with increases in aircraft values lease rates. These developments all reflect a cyclical recovery in traffic and in the case of lease rates a sustained rise in US$ interest rates. One unusual recent market development is the high level of lease extensions of older aircraft, both single-aisle and twin-aisle according to AerCap and other lessors.
There is an industry consensus that this focus by the airlines on access to capacity is driven by long-running disruption to the supply of new aircraft. Since 2018 Boeing has had to suspend deliveries of the B737 Max and B787 for extended periods and still retains a significant inventory of undelivered aircraft. Both Boeing and Airbus have also had significant supply chain problems leading to widespread delivery delays and missed production targets.
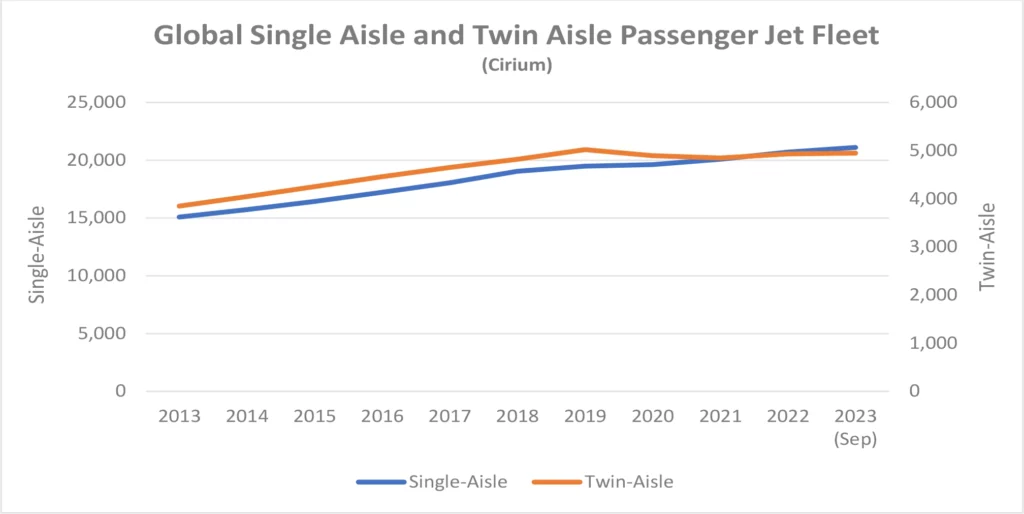
We agree with this view, but it is worth noting that on first look there is not a shortage of aircraft as such. As the chart below shows the total fleet of both single-aisle and twin-aisle aircraft has increased since 2017, the year before the start of disruptions to new aircraft supply. As of September 30th ,2023, the single-aisle fleet was at an all-time high of 21,102 and the twin-aisle was at 99% of its all-time high of 5,109 achieved at the end of 2019. This small decrease reflects a logical market adjustment to very high twin-aisle aircraft deliveries in the late 2010s (see our Q1 2022 Industry update for a more detailed discussion)[7].
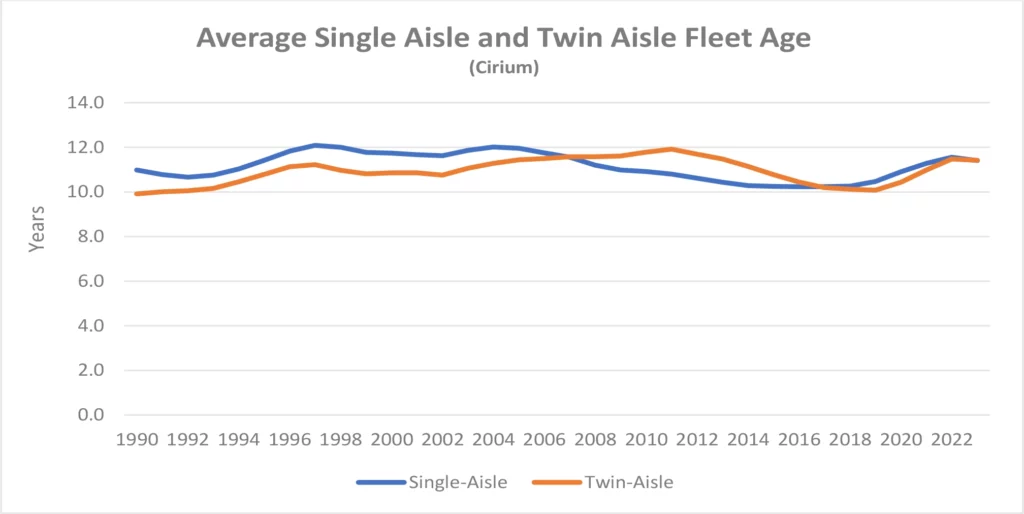
It is also unlikely that the impact of fleet age has been significant (older aircraft are more likely to be stored rather than in service and fly fewer hours when they are in service). Fleet age has increased slightly since 2017 but remains well within its historic range of 10 to 12 years old.
We believe that the key issue for single-aisle aircraft is a drop in productivity caused by a lack of durability and reliability for new technology engines, particularly Pratt & Whitney’s GTF. We can demonstrate this by doing a “snapshot” survival analysis. Survival curves show the percentage of passenger aircraft remaining in passenger service by age. Ultimately aircraft leave passenger service by being retired or converted to another use, predominantly freighter. Before this point there can be routine temporary exits from service for maintenance or change of operator, or non-routine storage in a market downturn.
The next chart compares the survival performance of single-aisle aircraft as of September 2023 with the average for the years 2007-2019, to capture the most recent full cycle from peak to peak as an unbiased benchmark for comparison purposes. One would expect the snapshot curve to be less smooth than a twelve-year average, but the September 2023 storage levels for aircraft less than 6 years old are very high by historical standards. It would be normal for aircraft in this age range not in service not to be in airline operation e.g., “white tails” owned by the manufacturer or repossessed aircraft owned by lessors or other financiers following an airline bankruptcy (for older aircraft a significant proportion of aircraft in storage are in maintenance or being modified for a new operator but this should not be a major factor for aircraft in this age range).In contrast to this normal pattern 337 of the 385 stored single-aisle aircraft (88%) are operated by airlines.
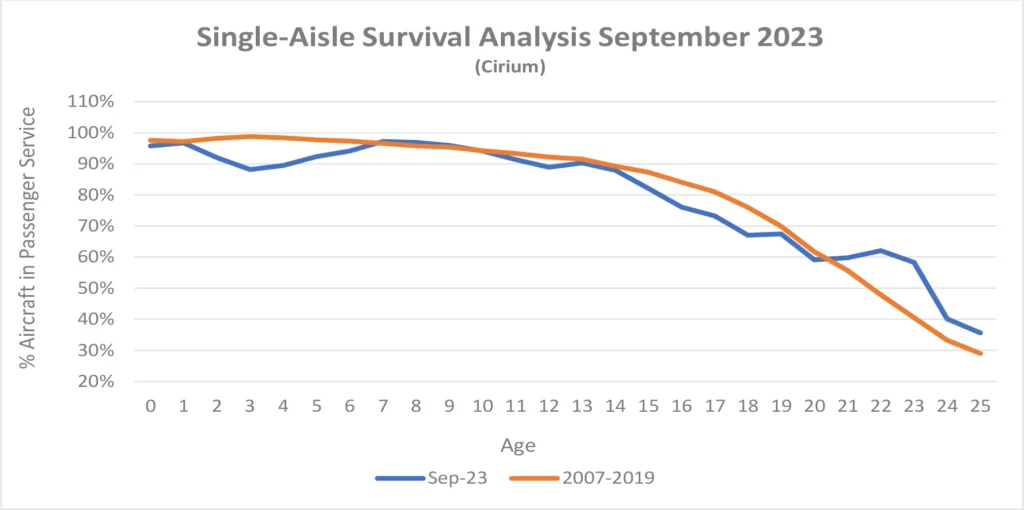
The P&W 1000G family accounts for 280 (73%) of aircraft in storage vs 68 (18%) for the CFM LEAP and has well publicised manufacturing materials problems, but few industry commentators are suggesting that the LEAP will have overhaul intervals anywhere near as long as those achieved by its predecessor the CFM 56. This means that fixing the problem will be a slow process as the only real solution is a big increase in the supply of spare engines to allow the aircraft to be operated while the original engines are being rectified or overhauled. The engine manufacturers are not well placed to meet this requirement due to manufacturing and supply chain constraints which are aggravated by the aircraft manufacturers’ desire to increase the output of new aircraft.
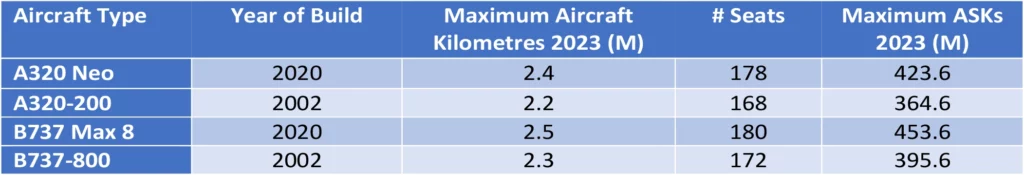
The impact of this shortfall of aircraft in service is more pronounced because the aircraft concerned are younger. As part of our proprietary industry forecast, we estimate the typical maximum volume of ASKs produced by an aircraft of a given type and age by forecast year. We would expect an A320 Neo to produce more ASKs than an A320 Ceo because:
- The A320 Neo will fly longer routes so that it will cover a greater distance for a given level of flight hours; and
- It will have more seats.
The same factors apply for the B737 Max 8 vs the B737-800.
This combination of factors leads to meaningful differences in productivity per aircraft unit as illustrated in the table below. The ASK “productivity premium” is 16.2% for the A320 Neo and 14.7% for the B737 Max 8. Maximum aircraft kilometres is a Sirius estimate based on analysis of historic flight hours and cycles by aircraft type and assumes optimal aircraft utilization, The number of seats for each aircraft type is a global average taken from SRS Analyser.
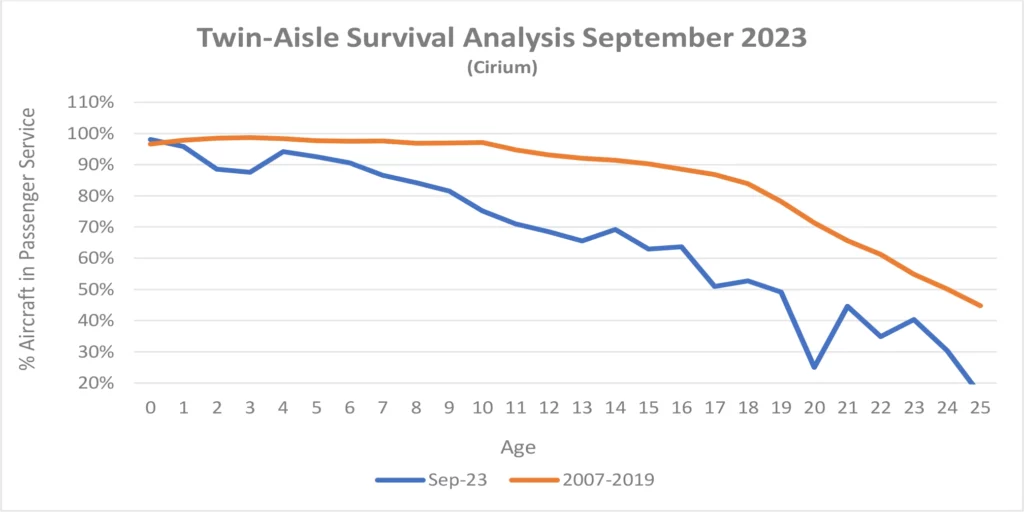
Turning to the twin-aisle market the same snapshot survival analysis gives us a very different picture with weakness right across the age spectrum. We have limited this analysis to long range twin-engine aircraft as this is clearly the prevailing market standard for twin-aisle aircraft after the ending of A380 production; this is an important distinction as these aircraft have performed better than predecessor types in terms of survival and therefore give a more challenging benchmark.
There are no reported engine problems for new technology twin-aisle aircraft on a scale comparable to those afflicting their single-aisle counterparts. The downward blip for 2–3-year-old aircraft is not quite apples to apples with the single-aisle analysis because it includes 12 B787s stored by Boeing out of 44 total aircraft stored less than 6 years old. In contrast there are only 5 B737 Max aircraft in the single-aisle numbers out of a total of 385 aircraft stored less than 6 years old. These numbers are presumably driven by Cirium’s definition of a white tail as the overall undelivered inventory of B737 Max aircraft is much higher than for the B787 (see New Aircraft Supply above).
Given there is no obvious shortage of twin-aisle capacity what might motivate airlines to extend leases? This discussion will be speculative as we do not have the detail of the leases that have been extended, but anyway…
Airlines may be sceptical about the ability of Airbus and Boeing to increase output in line with announced production plans. There has been the specific problem with B787 production in the last two years and there is the more general issue of the low level of current production rates by historic standards. After the onset of Covid 19 the manufacturers reduced production to levels where the market would inevitably rebalance at some point in the future. Increased production rates have been announced to levels that have readily been achieved in the past but require a rough doubling from current rates. This is a bigger proportional increase than for single-aisle aircraft types which some airlines may deem challenging.
Another possible motivation is to lock in rents in an airline-friendly market environment. Rising interest rates and supply/demand rebalancing are both likely to increase rents in the future.
[1] The crack spread is the difference between the price of crude oil and refined products such as jet fuel.
[2] RPKs is the acronym for revenue passenger kilometres, which is the product of the number of paying passengers times distance flown.
[3] ASKs is the acronym for available seat kilometres, which is the product of the number of available seats flown times distance flown.
[4] Airbus normally quotes its production rates based on an 11.5-month year for single-aisle aircraft.
[5] ACMI stands for Aircraft, Crew, Maintenance, and Insurance and is also known as wet leasing and/or damp leasing.
[6] Fleet numbers are as of December 31st, 2002.
[7] Our definition of single-aisle aircraft includes regional jets with more than 50 seats.
Disclaimer
This Presentation has been made to you solely for general information purposes and is not intended to provide, and should not be relied upon for legal, tax, accounting, investment, or financial advice. This Presentation is not a sales material and does not constitute or form any part of any offer, invitation or recommendation to the recipient, its affiliates or any other person to underwrite, sell or purchase securities, assets or any other product, nor shall it or any part of it form the basis of, or be relied upon, in any way in connection with any contract or transaction decision relating to any securities, assets or any other product. None of Sirius, its affiliates or shareholders shall have any responsibility or liability to the recipient, its affiliates, shareholders or any third party in relation to this Presentation or any other document or materials prepared by Sirius or its affiliates, officers, directors, employees, advisers or agents. Sirius and its affiliates, officers, directors, employees, advisers and agents have taken all reasonable care to ensure that the information contained in this Presentation is accurate. Neither Sirius nor any of its affiliates, officers, directors, employees, advisors or agents has any obligation to update this Presentation. Under no circumstances should the delivery of this Presentation, irrespective of when it is made, create an implication that there has been no change in the affairs of the entities that are the subject of this Presentation. This Presentation may be updated and amended by a supplement and, where such supplement is prepared, this Presentation will be read and construed with such supplement. The statements herein which contain such terms as “may”, “will”, “should”, “expect”, “anticipate”, “estimate”, “intend”, “continue” or “believe” or the negatives thereof or other variations thereon or comparable terminology are forward-looking statements and not historical facts. No representation or warranty, express or implied, is made as to the fairness, accuracy or completeness of such statements, estimates and projections. The recipient should not place reliance on any forward-looking statements. Neither Sirius nor its affiliates undertakes any obligation to update or revise the forward-looking statements contained in this Presentation to reflect events or circumstances occurring after the date of this Presentation or to reflect the occurrence of anticipated events. The information set out in this Presentation has been prepared by Sirius based upon various methodologies and calculations which it believes to be reasonable and appropriate. Past performance cannot be a guide to future performance. In preparing this Presentation, Sirius has relied upon and assumed, without independent verification, the accuracy and completeness of all information available from public sources or which was provided to it or otherwise reviewed by it. This Presentation supersedes and replaces any other information provided by Sirius or its affiliates, officers, directors, employees, advisers or agents in respect of the content of the Presentation. No information or advice contained in this Presentation shall constitute advice to an existing or prospective investor in respect of his personal position. None of Sirius, its affiliates, its or its affiliates’ officers, directors, employees or advisers, connected persons or any other person accepts any liability whatsoever for any loss howsoever arising, directly or indirectly, from this Presentation or its contents.