- Macro-Economic Background
- Traffic and Aircraft Demand
- New Aircraft Supply
- Airline Industry Financial Performance
- SPECIAL TOPIC – Airline Industry Default History
Where are all the early retirements? Is it different this time?
Macro-Economic Background
The IMF’s latest update to its World Economic Outlook shows a marginal improvement in its assessment of overall performance across the years affected by the pandemic. Our focus in presenting this data so far has been to see if there has been any “permanent” loss of output in this period. World GDP grew at 2.8% p.a. for the 30 years through 2019 and leading forecasters such as DRI expect a similar growth rate for the next 20 years. This implies that the pandemic has caused a long-term output loss of c. 0.7% p.a. for the years 2020-2023, or roughly 2.5-3.0% in total. In future updates we will focus more on the outlook for growth.
Economic growth is a key driver of long-term growth of air travel. However, since early 2022 its impact has been overshadowed by the fall and recovery in traffic associated with the pandemic. As recovery is largely complete the influence of overall economic conditions on air travel is likely to reassert itself

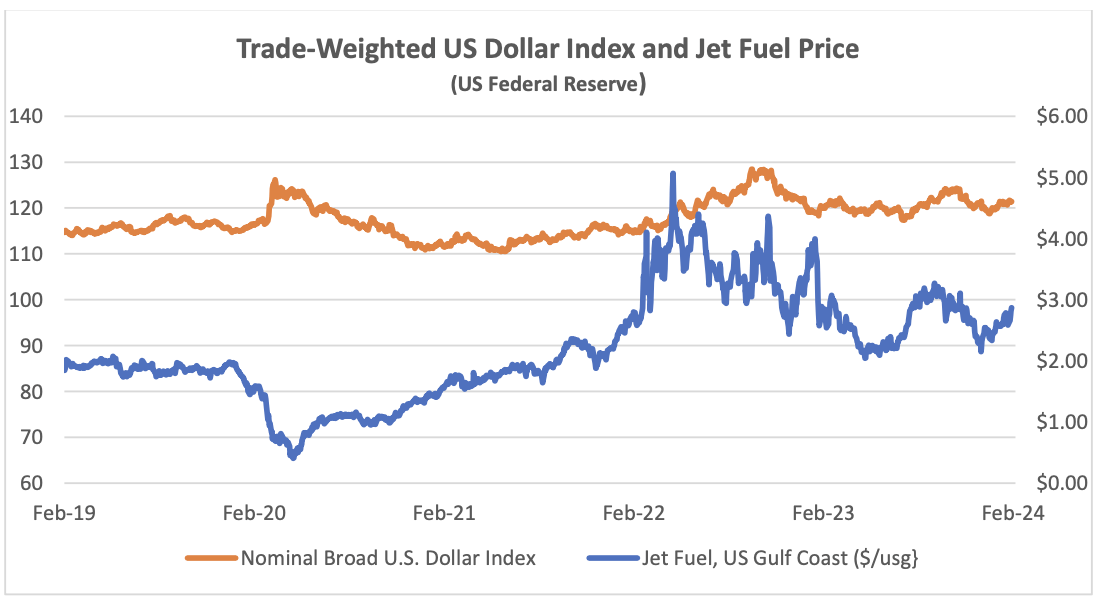
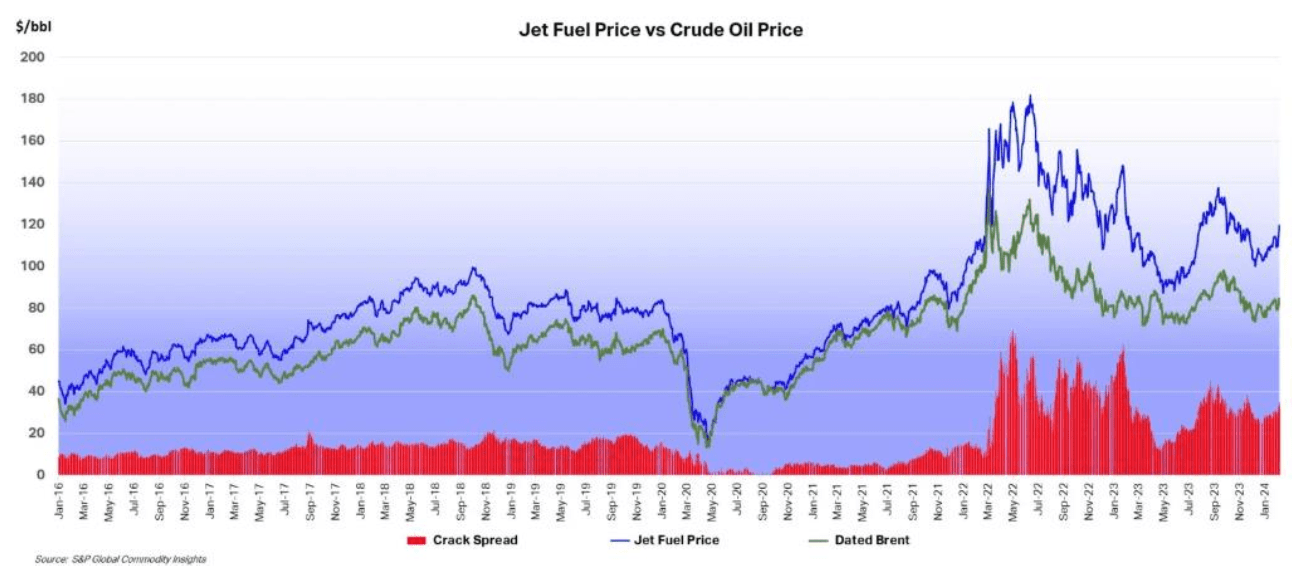
The US Dollar has weakened since its recent peak in September 2022, providing relief for airlines outside the US for dollar-denominated costs such as fuel, aircraft rents and aircraft spares. The price of jet fuel has remained volatile and has increased since the start of 2024. The IATA chart below shows that a key characteristic of current jet fuel market conditions remains the historically high level of the “crack spread”[1] at over $30 per barrel. Some of the issues that have contributed to this increase include the pace of traffic recovery, especially in Asia Pacific, and reported local refinery issues in the US and Europe. It seems reasonable to expect that the crack spread will reduce over time but with a lot of volatility around this trend.
Another indicator that is potentially important to aircraft investors is the breakeven inflation rate on US Treasury Inflation-Protected Securities (TIPS). This indicator measures inflation expectations and it matters because used aircraft values are strongly influenced by the cost of new aircraft and over time this cost is linked to US Dollar inflation. In the short term this linkage is driven by escalation clauses in aircraft purchase contracts and in the long term by the general input cost environment for the aircraft manufacturers. The chart below compares the breakeven rate for 10-year and 5-year TIPS.
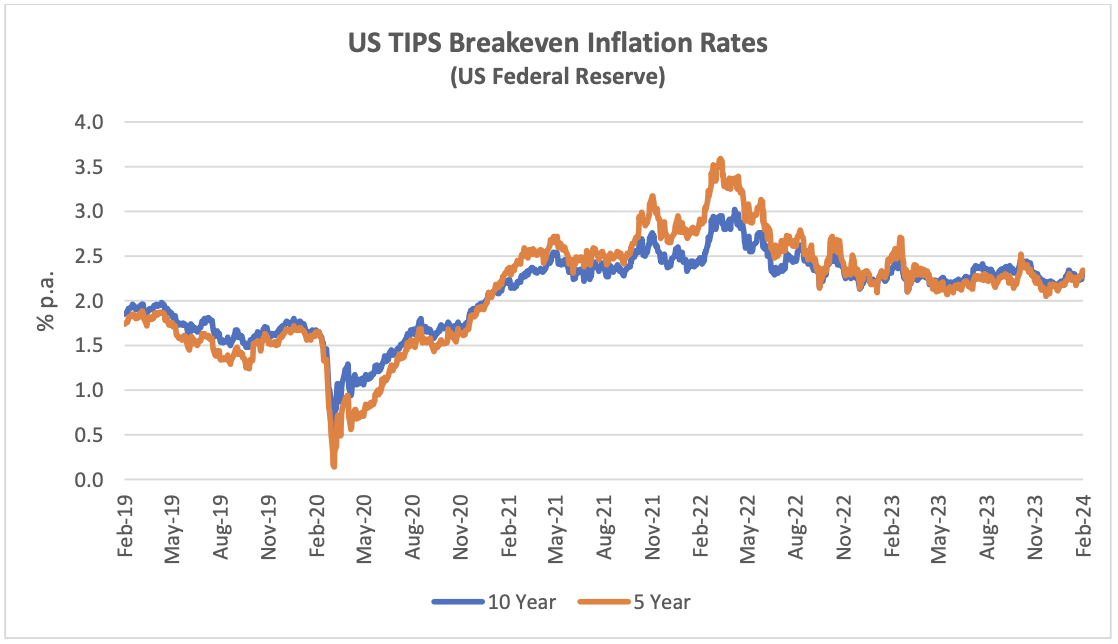
The recent reduction in US inflation has not significantly impacted the TIPS market, implying that this was already captured in investor expectations.
Traffic and Aircraft Demand
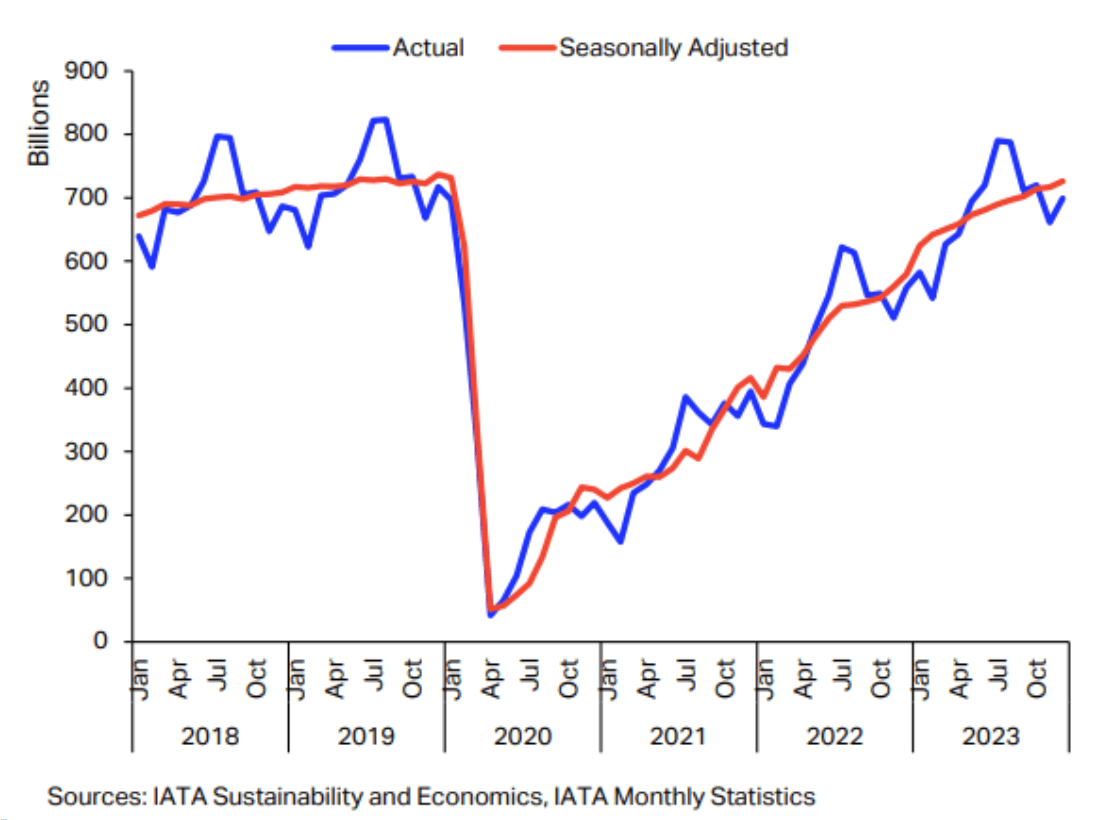
December 2023 air travel volumes were only 2.5% below December 2019, and full year comparison shows 2023 5.9% below 2019. Asia Pacific was the strongest performing regions as government restrictions (especially in China) were finally relaxed. As in 2022, there was a much bigger increase in international traffic vs domestic traffic, mainly because the former is still coming off a lower base.
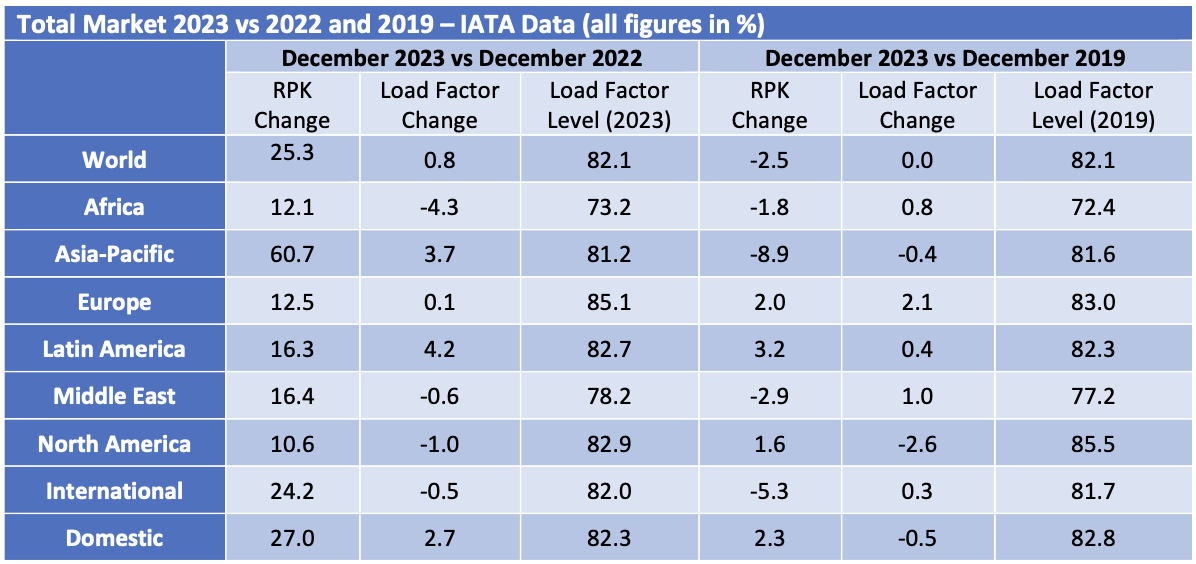
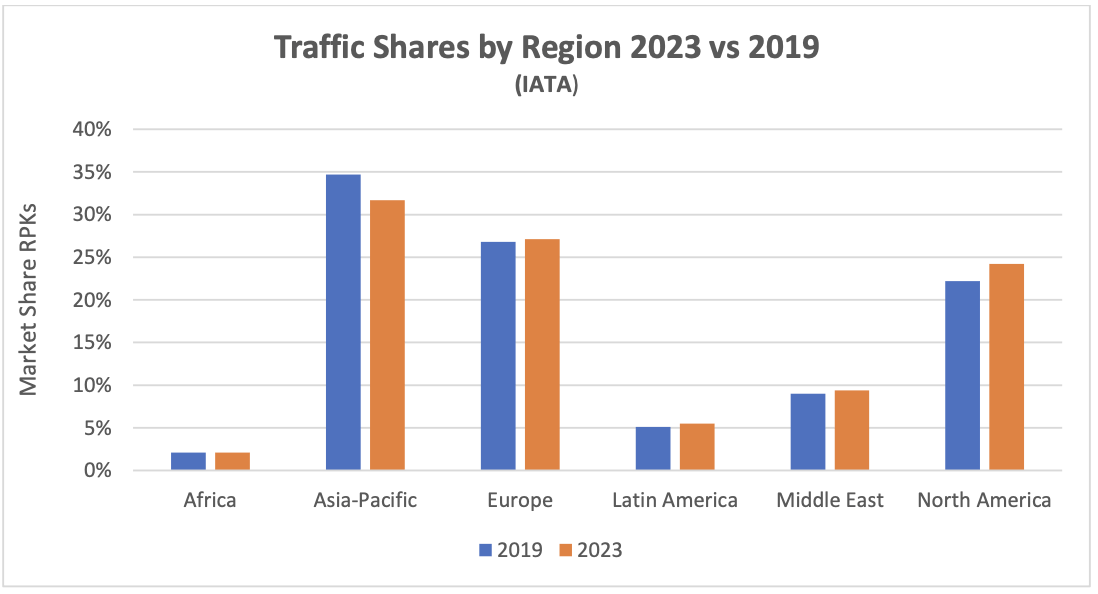
Despite its strong year on year performance Asia Pacific remains the weakest region compared to 2019 with a significantly lower share of global traffic.
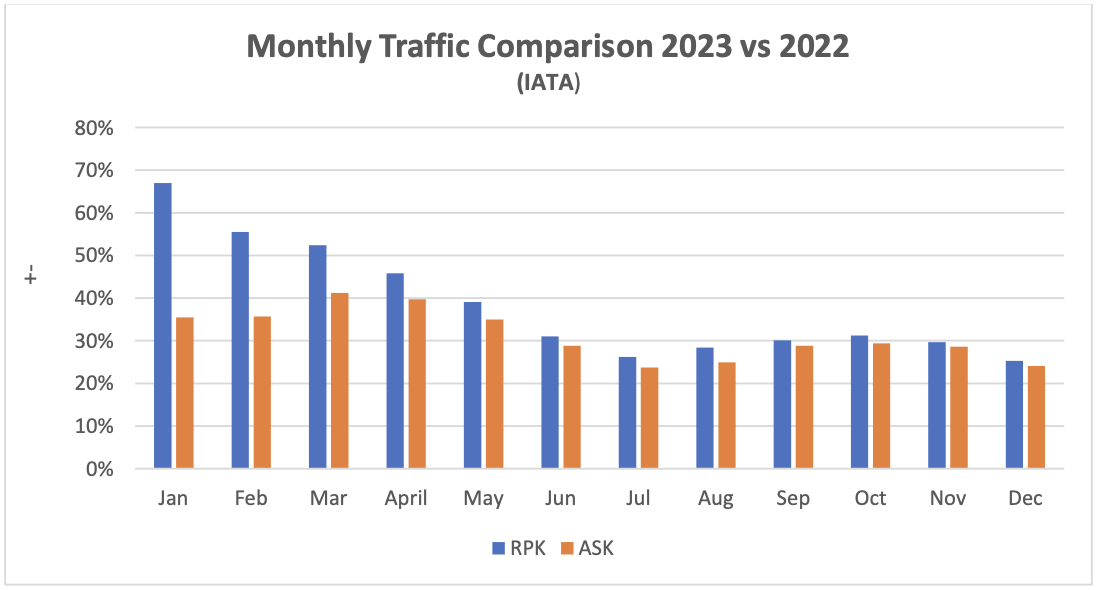
The chart below shows the changes in RPKs[2] and ASKs[3] by month. Since the start of 2023 the level of increase in RPKs has reduced because the year-on-year comparison is with a month in 2022 that was subject to a greater level of traffic recovery. Second the rate of increase in RPKs and ASKs has become more alike as the recovery in load factors is largely complete, so additional capacity needs to be deployed to support further traffic growth.
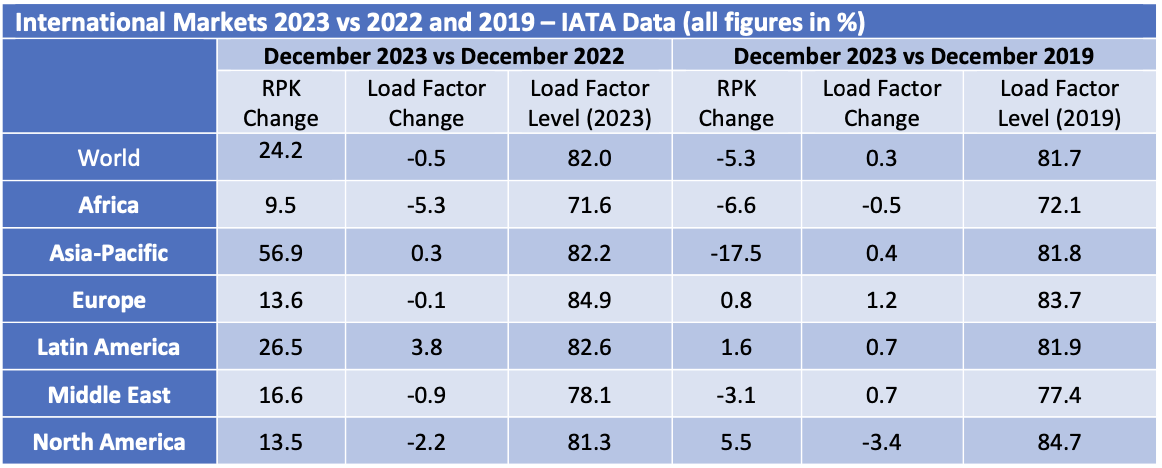
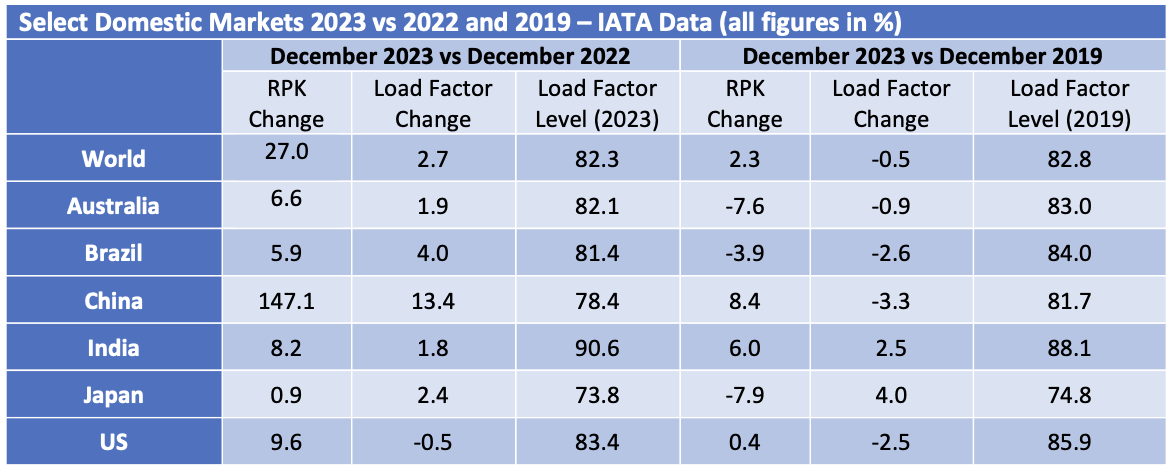
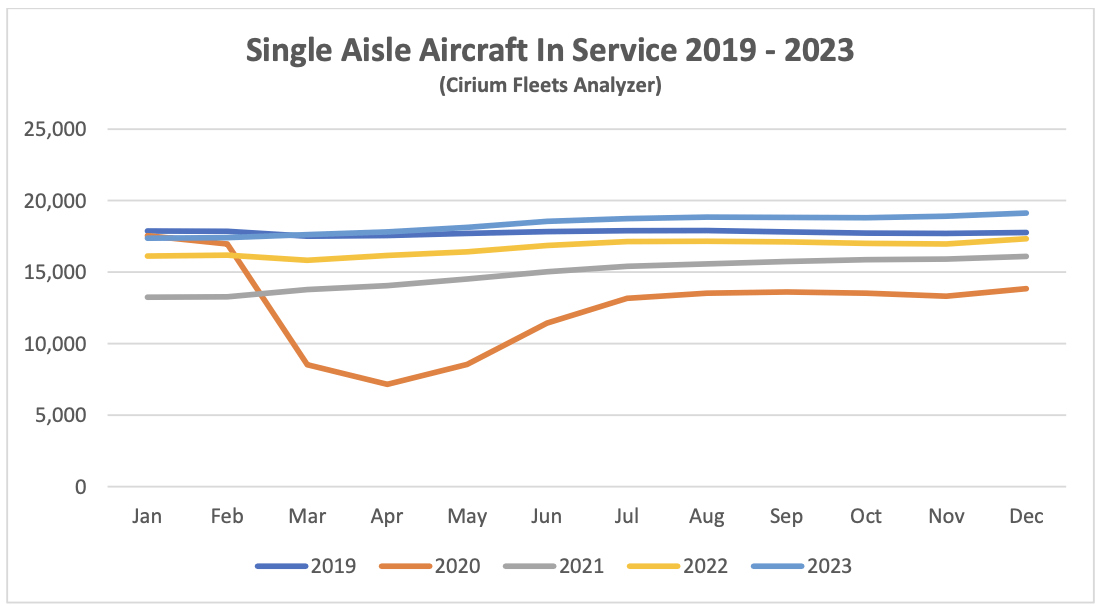
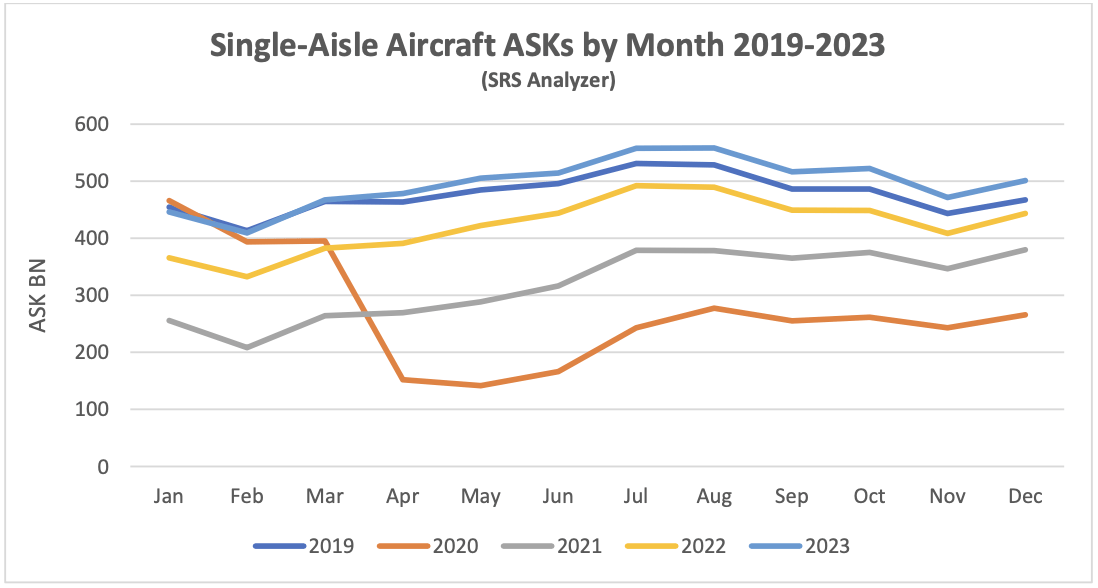
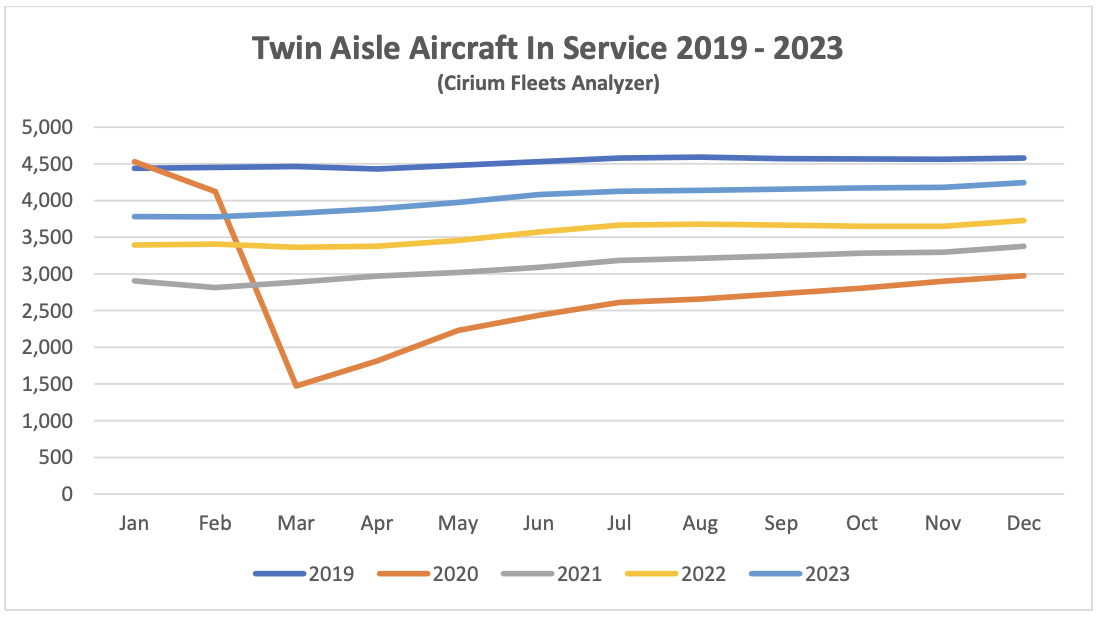
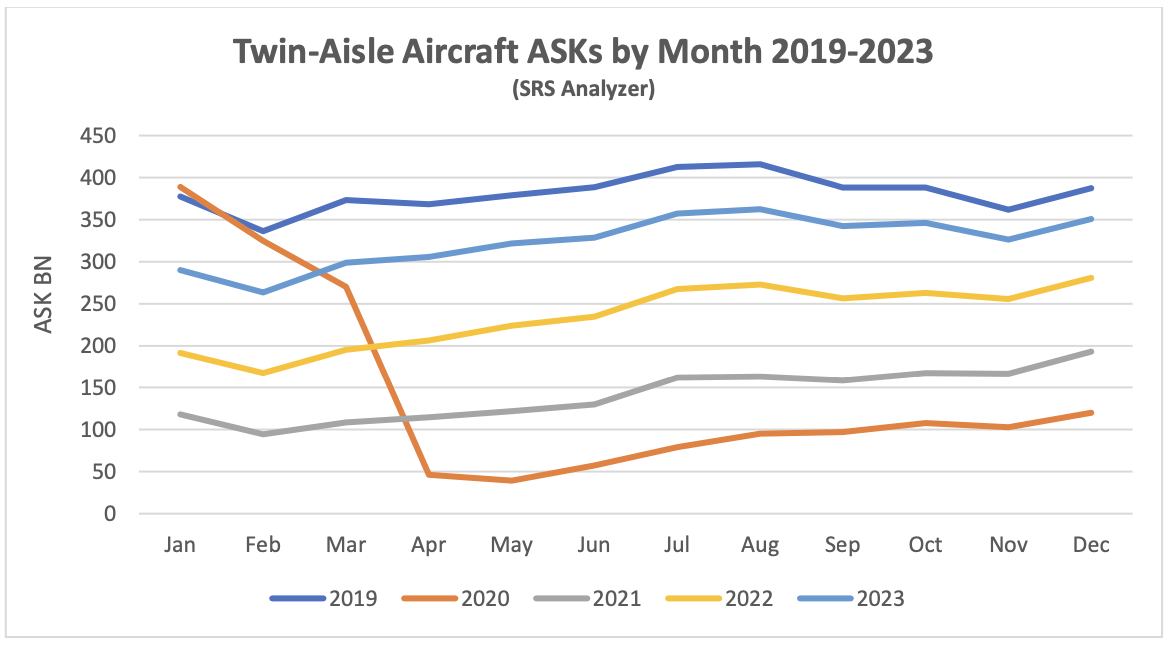
Although some short-haul aircraft serve international routes nearly all long-haul aircraft do so, and this is reflected in the relative demand for single-aisle (narrowbody) and twin-aisle (widebody) aircraft. Aircraft demand can be measured in terms of aircraft in service and ASKs, the standard measure of aircraft capacity deployed by airlines which indicates how intensively aircraft are being flown. Single aisle aircraft in service and ASK levels from Q2 2023 were ahead of the comparable period in 2019 reflecting the stronger recovery in domestic traffic. Full recovery has yet to be achieved for twin-aisle aircraft, mainly due to weak traffic to and from, and within the Asia-Pacific region. The figures by region in the tables above are based on airline domicile, so weak Europe to Asia traffic reduces recorded international RPKs in other regions.
New Aircraft Supply

IN contrast to 2022 Airbus exceeded its delivery guidance of 720 aircraft in 2023. Management is guiding total deliveries of 800 aircraft for 2024 with most of the increase likely to come from the A320 family. The latest status of Airbus’s production plans is:

The only significant production target not captured in the table above is the objective to raise A320 family production to 75 per month by 2026.

The latest status of Boeing’s production plans is:

Total B737 Max deliveries in 2023 were at the upper end of the revised guidance issued after Q3. The incident with the Alaska Airlines B737-9 in January has once again created significant uncertainty around Boeing’s ability to increase production of the Max although it has reached its short-term target of 38 aircraft per month. The FAA is investigating Boeing’s quality control systems and other related matters and has announced that it will not approve any increases in production until it is9 satisfied with Boeing’s level of compliance. Boeing has also announced that it will not seek certification of the B737-7 and -10 variants until it has engineering solutions for issues with their deicing systems and there is no definite timeframe to achieve this.
B737 inventory decreased from 250 at the end of 2022 to 175 at the end of 2023, consisting of:
- 80 B737-8 aircraft due to be delivered to Chinese airlines.
- 60 B737-8 aircraft due to be delivered to other airlines.
- 35 B737-7 and B737-10 aircraft which will be delivered once certification is achieved.
Boeing plans to deliver most of these aircraft in 2024 although it will need the Chinese government to sign off on the first tranche (all aircraft previously delivered to Chinese airlines are back in service) and type certification for the third tranche.
Q1 2023 saw the delivery of the last B747 which like the B767 had not seen any passenger variants sold for several years. That has also been the case recently for the B777, but this is likely to change with the entry into service of the B777-8 and B777-9 from 2025. Boeing has also had quality and production problems with the B787, its main passenger twin-aisle offering. It suspended deliveries in May 2021 and restarted in Q3 2022. Production levels are back at 5 aircraft per month going to 10 by 2025/2026. As with the Max Boeing holds a significant inventory of undelivered aircraft – 50 at the end of Q4 vs 100 at the end of 2022. Boeing has said it expects to deliver most of them in 2024.
The number of commercial jets delivered by OEMs other than Airbus and Boeing remains subdued. Although there is a gradual upward trend in deliveries from Chinese manufacturers (ARJ 21 and C919 models) these are likely to be confined to Chinese airlines for the foreseeable future.

Airline Industry Financial Performance
IATA released a new airline industry financial forecast in December 2023 as part of its semi-annual Global Outlook for Air Transport. Its estimated outcome for 2023 is improved relative to its forecast in June and it has forecast further improvement in 2024.

The improved outcome for 2023 is despite the average price of jet fuel remaining c. 20% higher than expected in the middle of the year, mainly because the “crack spread” did not reduce as anticipated. The forecast for 2024 shows a minimal reduction in the cost of fuel and is in line with the current market.
The outlook by region shows more convergence in traffic growth in 2024 largely because the 2023 baseline is less effected by the pandemic than 2022. Profitability continues to vary sharply by region, with reasonable performance in Europe, the Middle East, and North America but not elsewhere.

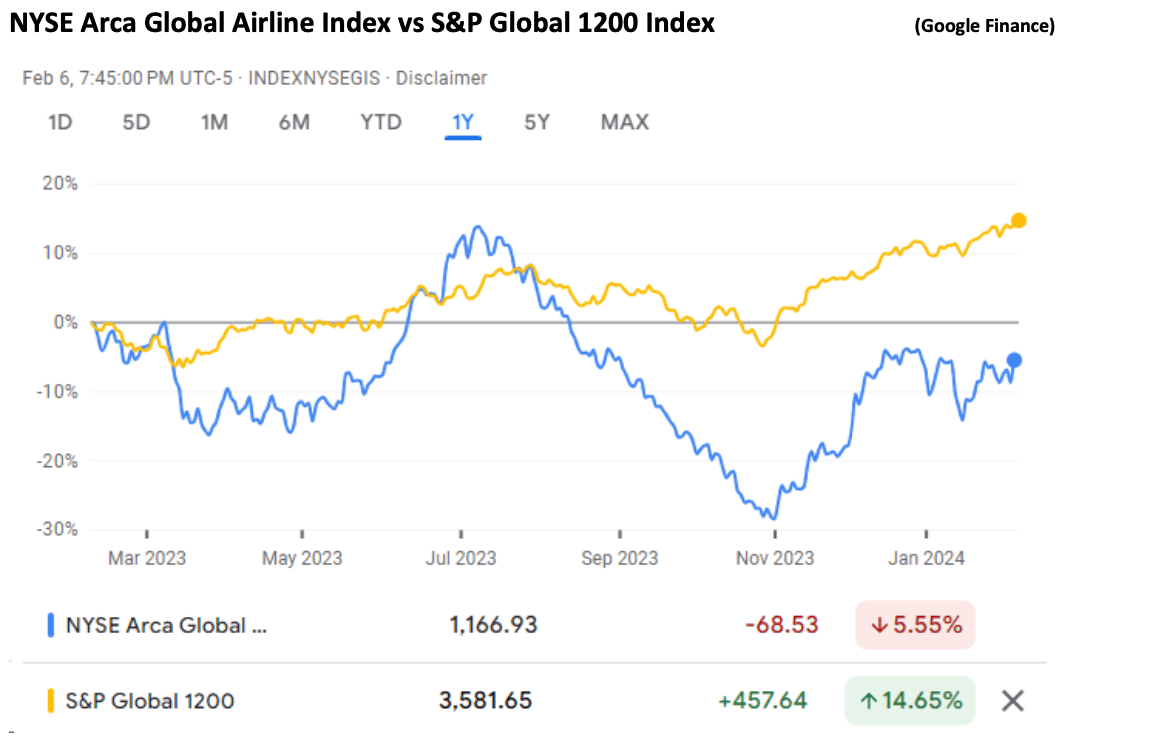
Airline share prices have recovered somewhat since Q4 2023. The sell-off from the middle of the year was caused by various investor concerns include the potential softening of airlines pricing power, increased costs especially fuel and maintenance, and in some cases operational disruption caused by requirements for increased engine maintenance. These concerns have been offset by slightly lower fuel prices and a positive earnings season for US airlines
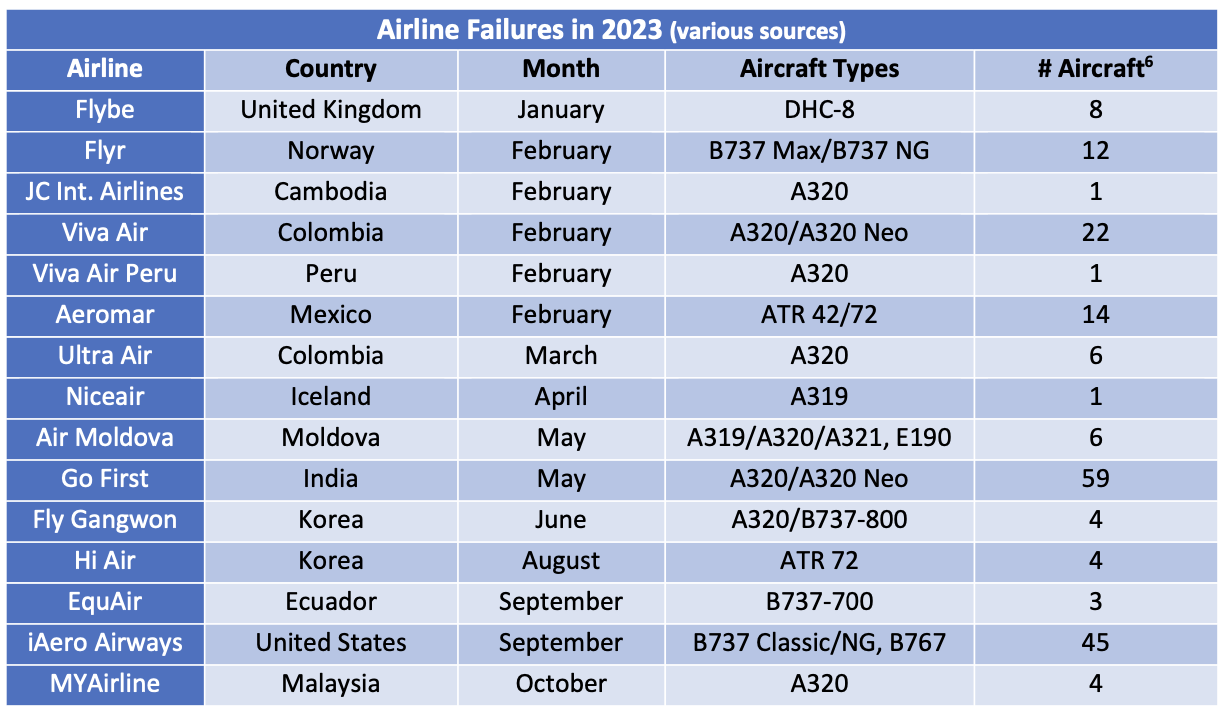
The largest airline to fail in 2023 was Go First of India. In its bankruptcy filing the airline declared its main problem was the need to ground about half its A320 Neo fleet due to problems with the PW1127G engine (see above). Viva Air suspended operations citing financial problems caused by the uncertainty around approval by the Colombian government of its acquisition by Avianca. Flyr filed for bankruptcy because of liquidity problems. iAero Airway’s Chapter 11 filing in September is not as financially significant as the number of aircraft involved might suggest – its fleet of 43 aircraft was on average 28 years old and the airline was a marginal provider of capacity through the ACMI market[5].
In last quarter’s update we highlighted the significant amounts being received by aircraft lessors from Russian financial institutions through the purchase of aircraft that were expropriated in 2022. There have been more such payments in the last three months and the recipients have included a broader range of aircraft owners including Aircraft ABS vehicles. Litigation by aircraft owners against the providers of war risks and contingency insurance policies continues; this is likely to provide additional compensation, but the timing is uncertain.
Special Topic – Airline Industry Default History
Sirius produces proprietary estimates of global airline defaults because we think there are important issues around credit risk that arise at the industry level as well as at the level of the individual airline, and we cannot find any alternative source with the coverage we would like. The rating agencies produce historical statistics by industry, but their universe of rated airlines is quite small (typically 25-30 airlines at any given time) as they only cover airlines that make use of debt capital markets.
Our study has some limitations mainly driven by practicality. We only cover airlines that have operated more than 5 passenger jet aircraft at any time since 1970 according to Cirium Fleets Analyser. This reduces the number of airlines we need to research from 2,793 with no size cut-off to 1,146, but we still cover 98% of the passenger jet fleet by units. We also limit our statistical analysis in time to start in 1990 because we believe that certain key characteristics of the industry changed around this time, notably deregulation and the rise of aircraft leasing as a key source of capital.
We due diligence each airline and record defaults captured by this research. We also add defaults for airlines in emerging market countries that experience sudden fleet reduction (20% for airlines with more than 15 aircraft, 3 aircraft if smaller), as these may well represent informal defaults that occur without court proceedings. Our final output is adjusted defaults which combines both research and rules-based defaults after eliminating mergers and double-counts. The number of adjusted defaults is c.50% higher than for research-based defaults. We measure adjusted defaults based on the number of airlines and the number of affected aircraft. There is a fuller description of our methodology in the appendix to this quarterly update.
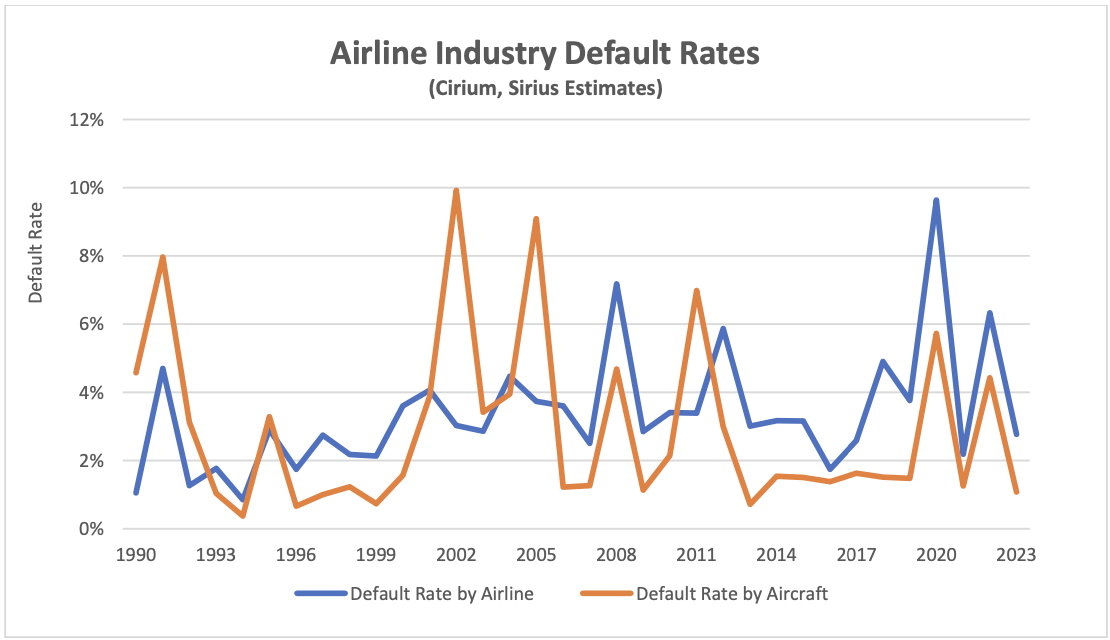
The main cause of the variation between the two default rates is the impact of large US airlines going into bankruptcy. In years where this does not happen the default rate by airline is higher than the default rate by aircraft because on average smaller airlines are more likely to default. In the interests of brevity this discussion will focus on defaults by airline – for our key conclusions defaults by affected aircraft give different but overall, quite similar results.
2023 saw a return to a more normal level of defaults following the shocks of the pandemic in 2020 and Russia’s expropriation of lessor-owned aircraft in 2022. Although 2020 was a record year for defaults there were also significant rent deferrals granted by lessors to airlines which can reasonably be considered as additional payment delinquency that is not captured by our methodology. As most of these deferred amounts have been repaid this was a strong case of enlightened self interest on the part of the lessors, although this is clearer with hindsight than it was at the time. One should bear in mind that the nature of a lessor’s credit exposure to an airline is different to that of an unsecured lender because the lessor typically has the benefit of asset ownership and a lease security package that may include cash security deposits, letters of credit and other features. This has allowed lessors to grant significant forbearance to airlines at various other times as well as the extreme case of 2020-2021.
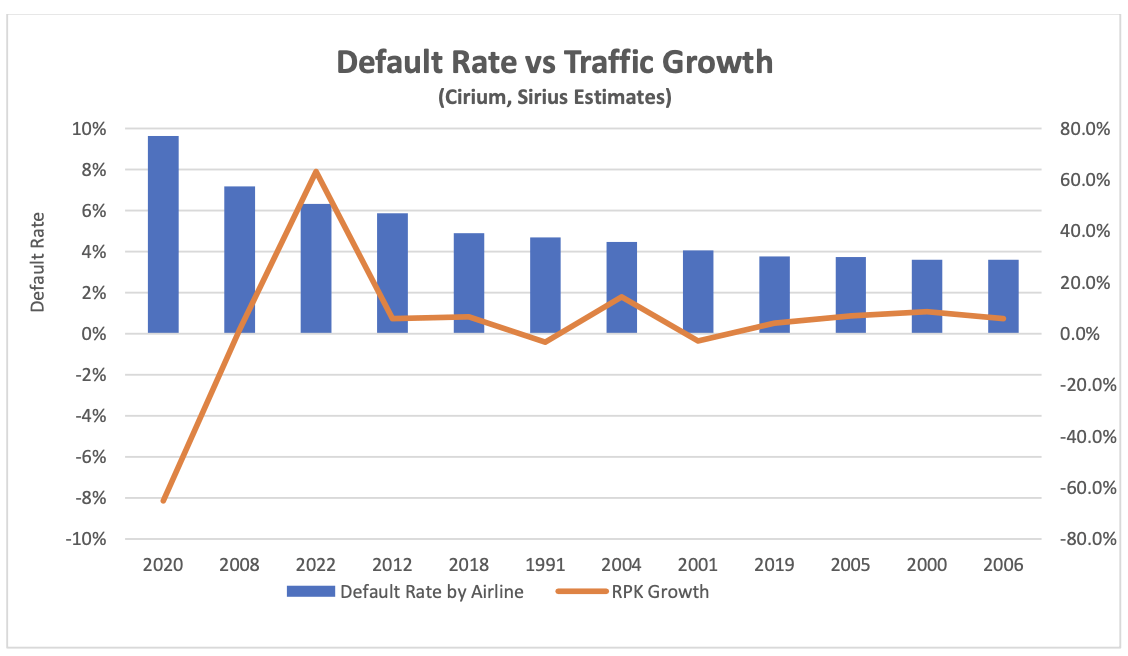
One notable feature of our estimated default history is that it is not highly correlated with traffic growth. The chart above compares the default rate by airline with traffic growth for every year where defaults were above average with the highest default rates on the left. Traffic declined in only 3 of the twelve years concerned, and the year 2012 is particularly interesting with the fourth highest level of defaults despite robust 5.9% growth in RPKs. One explanation for this may be a hangover effect with airlines weakened by the economic downturn occasioned by the financial crisis finally defaulting due to specific problems unrelated to the industry cycle. There are many airlines that have yet to rebuild their balance sheets after the pandemic and a consequent risk of something similar happening in the next few years.
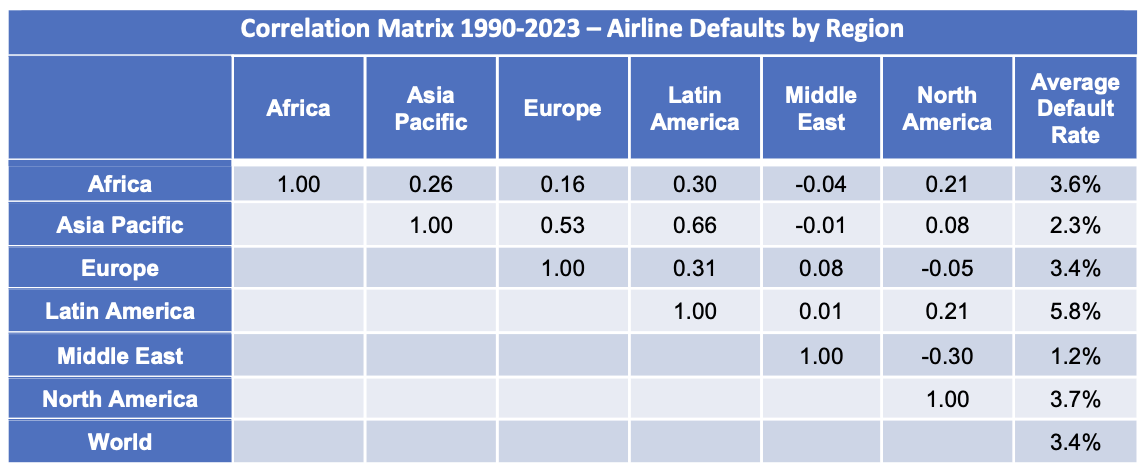
Another significant and related result of our analysis is that default rates by region are not strongly correlated as can be seen in the table below. This should not really be surprising as analysis of traffic growth and airline profits by region shows a similar pattern. We believe this lack of correlation is a key explanation of how the aircraft leasing industry remains financially robust despite serving a single relatively risky industry.
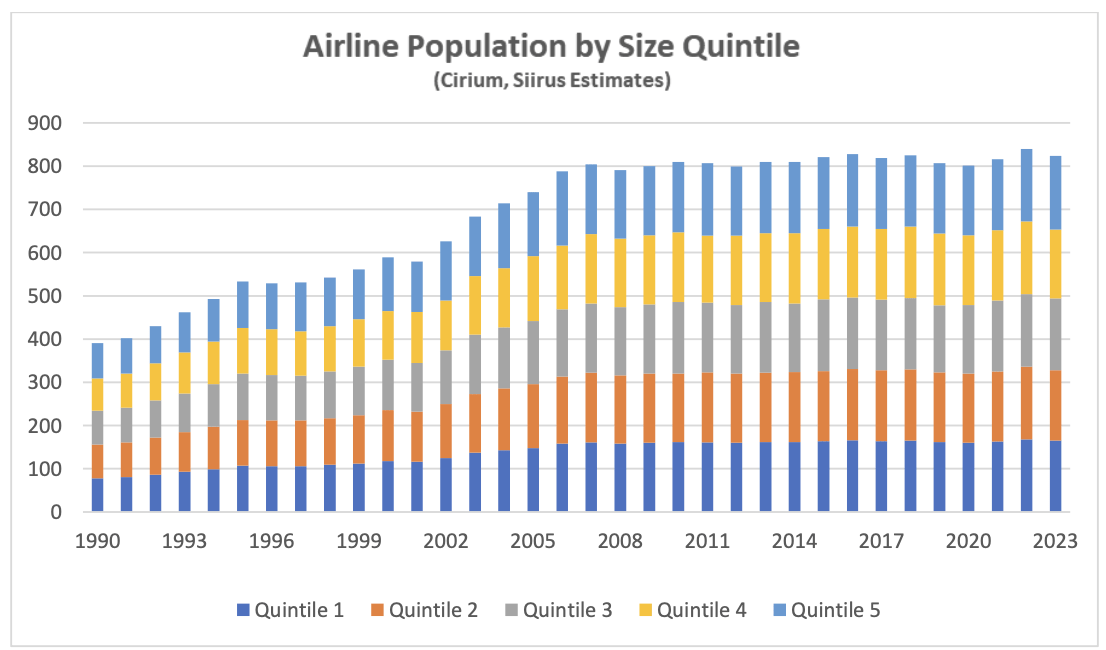
We also sought to see what impact airline size has had on default rates. To do this we divided airlines into quintiles based on size as measured by number of seats, with each quintile representing roughly the same number of airlines. The chart below shows the population of airlines by quintile which has been quite stable since the late 2000s. During this period, bigger airlines have grown faster than smaller airlines resulting in a more concentrated industry.
The default rates by quintile are visually confusing but the numbers in the following table help to put some structure around the results.
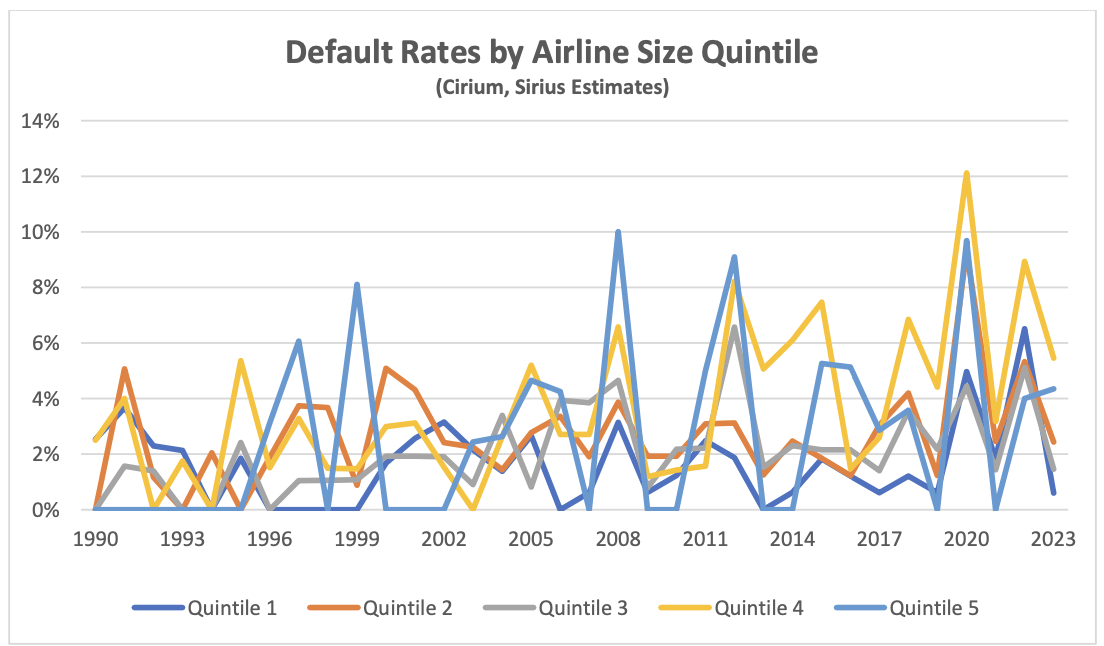

The table shows that the biggest airlines have the lowest and least volatile default level – volatility matters because it is harder to manage a default rate that is “spiky”. Once we go to the other quintiles there is no observable relationship between size and default rate, but there is a definite upward trend in volatility as airlines become smaller. Overall, our analysis suggest size has a limited influence on creditworthiness, and it would be wrong to assume that the lower default rate for larger airlines makes them “investment-grade” by a flawed analogy with credit ratings. The airlines in Quintile 1 have a default rate of 1.7% vs 3.4% for all airlines – for purposes of comparison the average default rate for Moody’s investment-grade bond issuers was 0.1% p.a. vs 4.3% p.a. for speculative-grade for the same period.
It’s also worth considering whether a broader data set might have implications for how the rating agencies look at the credit status of the airline industry. Although the universe of airlines with public ratings is small, the rating agencies conduct a lot of private ratings as part of rating aircraft ABS transactions. Although these private ratings remain confidential, general feedback is typically that average credit ratings for the airlines in these portfolios is “high B/low BB” i.e. middling speculative grade.
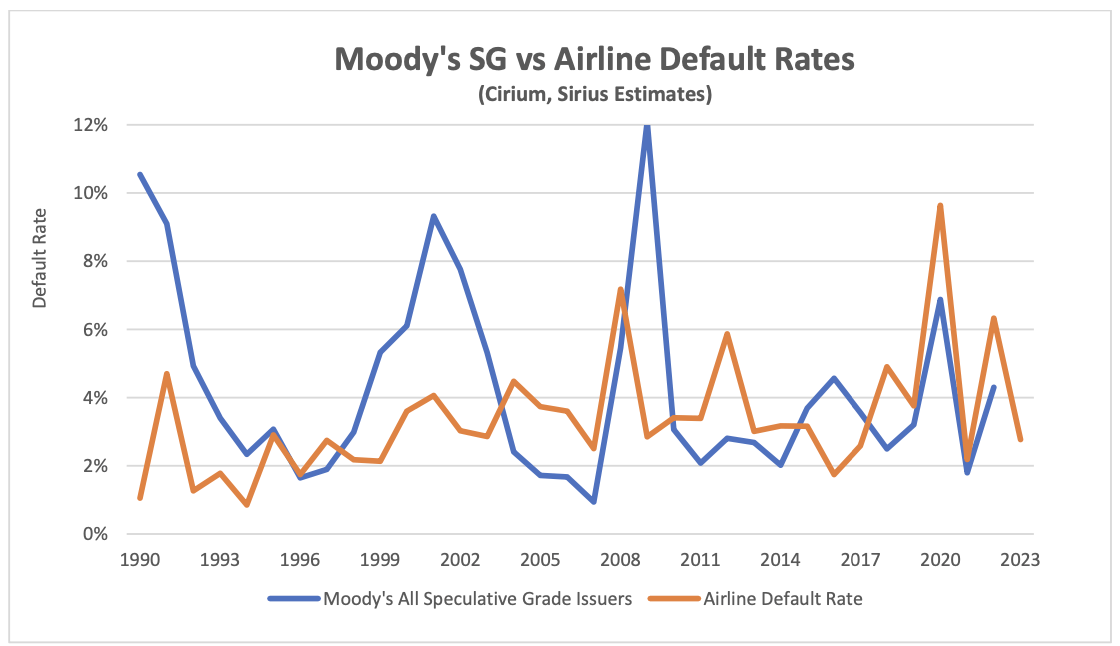
A comparison of our estimated airline default rate with the default rate for all bond issuers rated speculative grade by Moody’s shows airlines with both a lower default rate (3.4% p.a. vs 4.3% p.a.) and lower volatility (1.8% standard deviation vs 2.8%). It looks unlikely that the rating agencies are being overly optimistic about airline credit quality, but the most striking difference arises in volatility where it seems the benefit of geographical diversification more than offsets the benefit of industry diversification (we assume that the Moody’s issuer universe is concentrated in the US). It is worth reiterating our previous comment the limitations on making fair comparisons between our airline default estimates and historic bond defaults, but these results are striking none the less.
Appendix – Airline Industry Default Study Methodology
- Airline fleets data source is Cirium Fleets Analyzer
- Airline population limited to airlines with 6 or more aircraft at year end during study period
– There are 1,146 airlines that had a fleet of 6 or more aircraft out of 2,793 total airlines - Historic default events are Research based or Rules based.
- Research based events are derived from study of relevant academic/government publications and online resources (Airlines for America, Wikipedia)
o Single airlines can default on multiple occasions
o Cessation/suspension of operations assumed to result in default unless there is clear evidence that this was not the case
o Every single airline with its own licence (“AOC”) counts as a default e.g., both the LATAM and Avianca groups filed for bankruptcy in 2020, and as a result each of their subsidiaries, which also had distinct licences, experienced a default and is counted separately. - A Rules based event only occurs for airlines based in an emerging market country (per World Bank classification) where default processes are assumed to be more informal. A Rules based event occurs if:
o An airline with 15 or more aircraft has a year-on-year fleet reduction of 20% or more, or
o An airline with less than 15 aircraft has a year-on-year fleet reduction of 3 or more aircraft
o Some events are eliminated if research shows there clearly was no default i.e. Copa Airlines Colombia - An airline cannot default two years in a row e.g. bankruptcy shortly followed by cessation of operations is treated as a single default
- Adjusted Defaults by Airline are the combination of Research Based and Rules Based events which are filtered to eliminate mergers and duplication of events.
- Adjusted Defaults by Aircraft take the fleet size the year before the defaults occurs, not the max fleet size for the airline.
[1] The crack spread is the difference between the price of crude oil and refined products such as jet fuel.
[2] RPKs is the acronym for revenue passenger kilometres, which is the product of the number of paying passengers times distance flown.
[3] ASKs is the acronym for available seat kilometres, which is the product of the number of available seats flown times distance flown.
[4] Airbus normally quotes its production rates based on an 11.5-month year for single-aisle aircraft.
[5] ACMI stands for Aircraft, Crew, Maintenance, and Insurance and is also known as wet leasing and/or damp leasing.
[6] Fleet numbers are as of December 31st, 2022.
Disclaimer
This Presentation has been made to you solely for general information purposes and is not intended to provide, and should not be relied upon for legal, tax, accounting, investment, or financial advice. This Presentation is not a sales material and does not constitute or form any part of any offer, invitation or recommendation to the recipient, its affiliates or any other person to underwrite, sell or purchase securities, assets or any other product, nor shall it or any part of it form the basis of, or be relied upon, in any way in connection with any contract or transaction decision relating to any securities, assets or any other product. None of Sirius, its affiliates or shareholders shall have any responsibility or liability to the recipient, its affiliates, shareholders or any third party in relation to this Presentation or any other document or materials prepared by Sirius or its affiliates, officers, directors, employees, advisers or agents. Sirius and its affiliates, officers, directors, employees, advisers and agents have taken all reasonable care to ensure that the information contained in this Presentation is accurate. Neither Sirius nor any of its affiliates, officers, directors, employees, advisors or agents has any obligation to update this Presentation. Under no circumstances should the delivery of this Presentation, irrespective of when it is made, create an implication that there has been no change in the affairs of the entities that are the subject of this Presentation. This Presentation may be updated and amended by a supplement and, where such supplement is prepared, this Presentation will be read and construed with such supplement. The statements herein which contain such terms as “may”, “will”, “should”, “expect”, “anticipate”, “estimate”, “intend”, “continue” or “believe” or the negatives thereof or other variations thereon or comparable terminology are forward-looking statements and not historical facts. No representation or warranty, express or implied, is made as to the fairness, accuracy or completeness of such statements, estimates and projections. The recipient should not place reliance on any forward-looking statements. Neither Sirius nor its affiliates undertakes any obligation to update or revise the forward-looking statements contained in this Presentation to reflect events or circumstances occurring after the date of this Presentation or to reflect the occurrence of anticipated events. The information set out in this Presentation has been prepared by Sirius based upon various methodologies and calculations which it believes to be reasonable and appropriate. Past performance cannot be a guide to future performance. In preparing this Presentation, Sirius has relied upon and assumed, without independent verification, the accuracy and completeness of all information available from public sources or which was provided to it or otherwise reviewed by it. This Presentation supersedes and replaces any other information provided by Sirius or its affiliates, officers, directors, employees, advisers or agents in respect of the content of the Presentation. No information or advice contained in this Presentation shall constitute advice to an existing or prospective investor in respect of his personal position. None of Sirius, its affiliates, its or its affiliates’ officers, directors, employees or advisers, connected persons or any other person accepts any liability whatsoever for any loss howsoever arising, directly or indirectly, from this Presentation or its contents.
