Macro-Economic Background
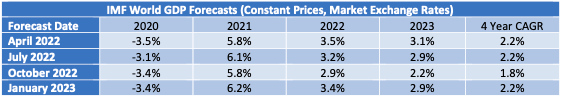
The IMF’s latest update to its World Economic Outlook (January 2023) shows a significant improvement on its forecast in October 2022. In retrospect this forecast probably discounted significant economic disruption from Russia’s invasion of the Ukraine that ultimately did not happen. Overall, for the entire period from the start of 2019 to the end of 2023 overall growth is back where it was estimated to be in the middle of last year.
Global economic growth is vital to the long-term growth of air travel. However, in the next few years the key drivers of growth will likely be very specific to the airline industry, especially the recovery from the industry downturn caused by the Covid 19 pandemic.
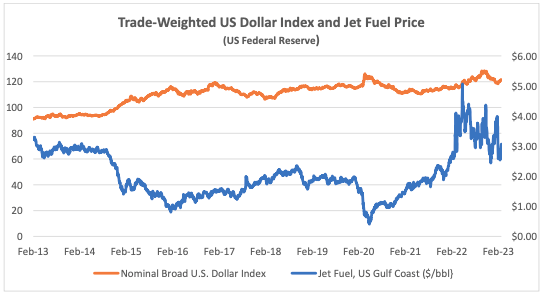
The US Dollar has weakened since its recent peak in September 2022, providing relief for airlines outside the US for dollar-denominated costs such as fuel, aircraft rents and aircraft spares. Jet fuel is also on a downwards trend, albeit with a lot of volatility.
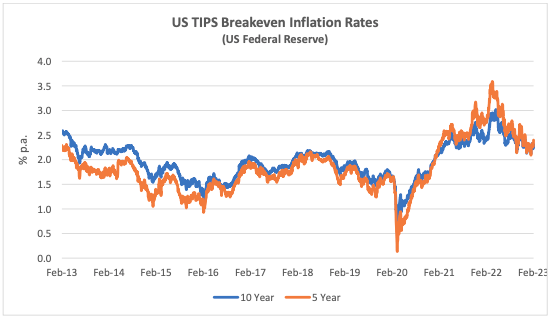
Another indicator that is potentially important to aircraft investors is the breakeven inflation rate on US Treasury Inflation-Protected Securities (TIPS). This indicator measures inflation expectations and it matters because used aircraft values are strongly influenced by the cost of new aircraft and over time this cost is linked to US Dollar inflation. In the short term this linkage is driven by escalation clauses in aircraft purchase contracts and in the long term by the general input cost environment for the aircraft manufacturers.
The chart below compares the breakeven rate for 10-year and 5-year TIPS to highlight the differences in expectations for the different time horizons. The shorter maturity has been more volatile, especially since the onset of the pandemic, but there is a strong overall correlation that suggests changed inflation expectations are not for a transitory “blip”.
Traffic and Aircraft Demand
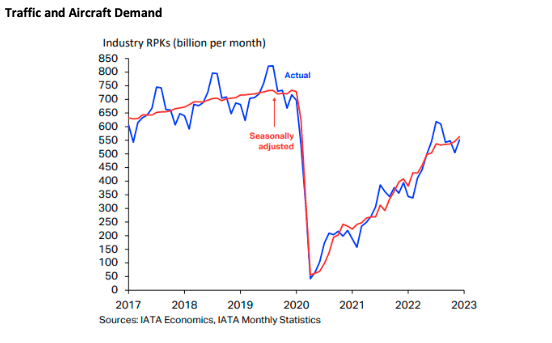
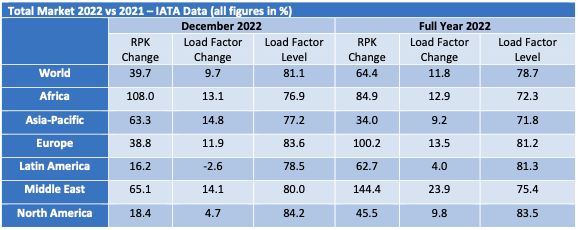
The strong recovery in air travel from the start of 2022 has continued through Q4 although overall RPKs for the month of December remained 23.1% below the comparable figures for 2019. Europe and the Middle East are the strongest performing regions because their recovery has mainly occurred this year, whereas the Americas already achieved a significant recovery in 2021. Asia- Pacific remains the weakest region (see discussion below).
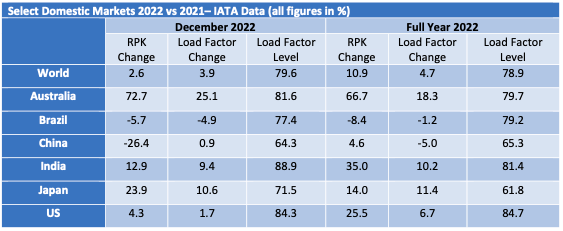
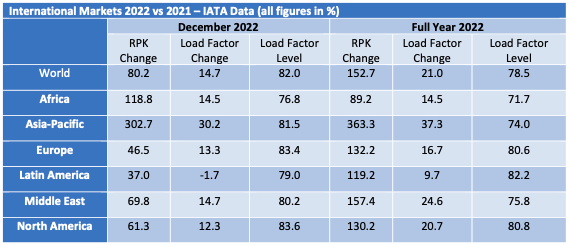
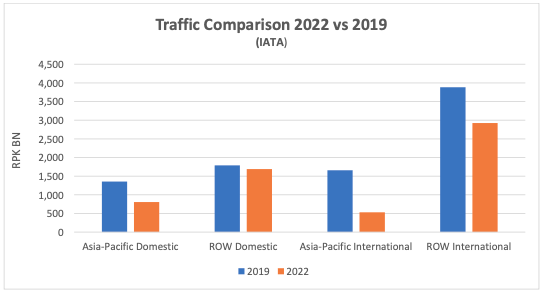
The main outlier in the pace of recovery has been the Asia-Pacific region due to a much slower relaxation of government restrictions on international travel and the impact of China’s zero-Covid policy on its domestic market. To illustrate this the chart below compares traffic in 2019 and 2022 for Asia-Pacific and ROW (Rest of the World). Although ROW international traffic has recovered more slowly than ROW domestic, this is mainly down to drop in flights from other regions to Asia- Pacific (IATA’s regional statistics are based on the airline’s domicile rather than traffic flows).
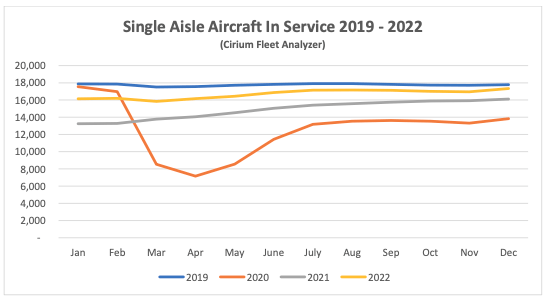
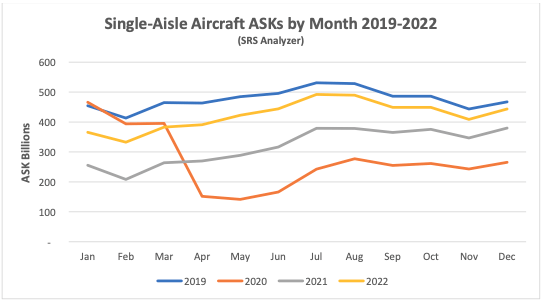
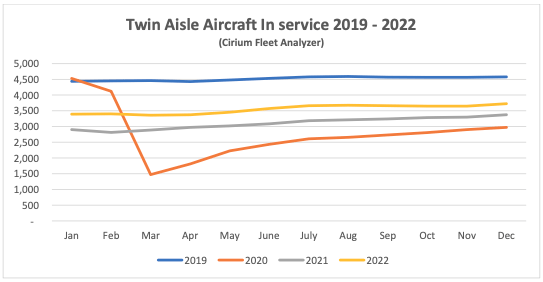
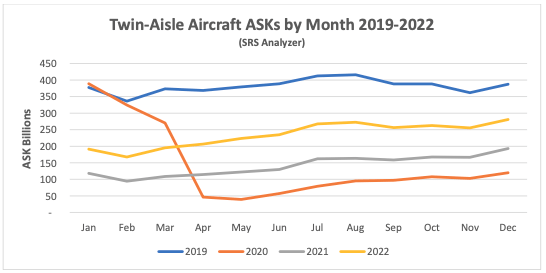
Although some short-haul aircraft serve international routes nearly all long-haul aircraft do so, and this is reflected in the relative demand for single-aisle (narrowbody) and twin-aisle (widebody) aircraft. Aircraft demand can be measured in terms aircraft in service and ASKs[1], the standard measure of aircraft capacity deployed by airlines which indicates how intensively aircraft are being flown. Single aisle aircraft in service levels are now very close to where they were in 2019 with a slightly weaker recovery in ASKs due to lower utilization. The comparable figures for twin aisle aircraft remain much weaker.
New Aircraft Supply

Airbus missed its delivery 2022 target significantly. Its final total of 661 aircraft compared with an initial target of 720, which was reduced to 700 around the beginning of Q4. The shortfall was caused by supply chain problems, particularly with engines.
The latest status of Airbus’s production plans is:
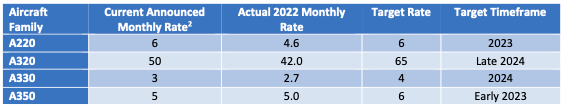
Airbus recently announced delays in planned production increases for the A320 family due to supply chain problems. The increase to 65 aircraft per month has slipped by about a year to late 2024 and the further increase to 75 has gone from mid-decade to late 2026. Some planned increases for twin- aisle aircraft were announced, with the A330 Neo going from 3 to 4 per month in 2024 and the A350 going from 5 to 6 per month later this year, and possibly going to 9 by the end of 2025.
The latest status of Boeing’s production plans is:
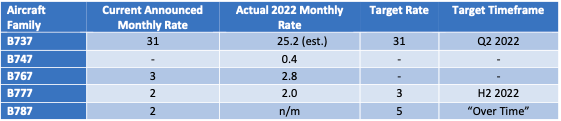
Boeing significantly increased B737 Max deliveries in 2022 and by year end had achieved the target monthly production rate of 31 that it announced when it resumed production in 2021. Boeing’s inventory of manufactured but undelivered B737 Max aircraft is dropping slowly, from 335 aircraft at the end of 2021 to 250 at the end of 2022 (our estimated actual monthly production rate nets off the inventory reduction of 85 from 387 total deliveries). Boeing has stretched out the period over which it expects to deliver these aircraft. Its most recent guidance is that it will reduce this inventory at a rate of 8-10 per month with some deliveries not occurring until 2025. Earlier discussion of an increase in production to 38 per month has been shelved due to supply chain problems.
Despite this overall success the B737 max still faces challenges. It has yet to be recertified by the Chinese authorities although this is expected to be resolved soon. The FAA deadline for certification of the B737 Max 7 and Max 10 variants has been pushed back by new legislation and they are now planned to enter service in 2023 and 2024 respectively.
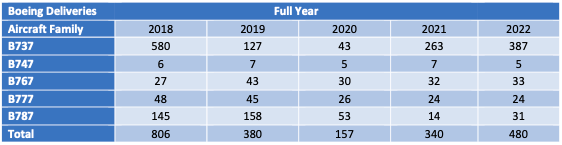
Boeing has also had quality and production problems with the B787, its main passenger twin-aisle product (nearly all B747, B767 and B777 deliveries are freighters or tankers). It suspended deliveries in May 2021 and restarted in Q3 2022. Production levels for now remain “very low”, and 100 undelivered aircraft are in inventory. Boeing has said it expects to deliver most of them within the next two years.
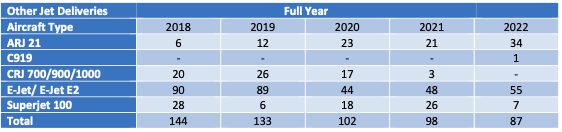
The number of commercial jets delivered by OEMs other than Airbus and Boeing declined slightly in 2022 but outcomes varied significantly by manufacturer. There was a big reduction for the SSJ due to the impact of sanctions on Sukhoi, particularly the announcement by the SSJ’s engine supplier Powerjet that it is withdrawing from the Russian market. There were increases for Embraer and COMAC, and the latter delivered its first C919 which is a medium sized single-aisle aircraft that competes directly with the A320 and B737 aircraft families. This is a big step forward for Chinese aircraft manufacturing and the C919 will likely be the focus of much curiosity within the industry as to its performance in terms of operating economics and productivity.
Airline Industry Financial Performance
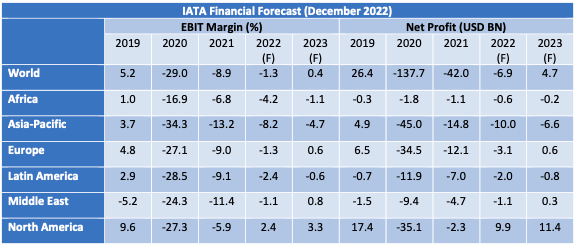
IATA’s December 2022 financial forecast shows the airline industry returning to near breakeven in 2022 and moving into profit in 2023. North America is by far the strongest performer followed by Europe and the Middle East. Asia-Pacific, Latin America and Africa remain loss-making through 2023. The differences in profitability are not very great apart from North America and Asia-Pacific, with 2023 EBIT margins for Africa, Europe, the Middle East and Latin America falling within a range of – 1.1% to +0.8%. The single biggest reason for North America’s outperformance is its lack of exposure to the impact of a historically strong US Dollar, and the biggest reason for Asia-Pacific’s underperformance is relatively high government travel restrictions.
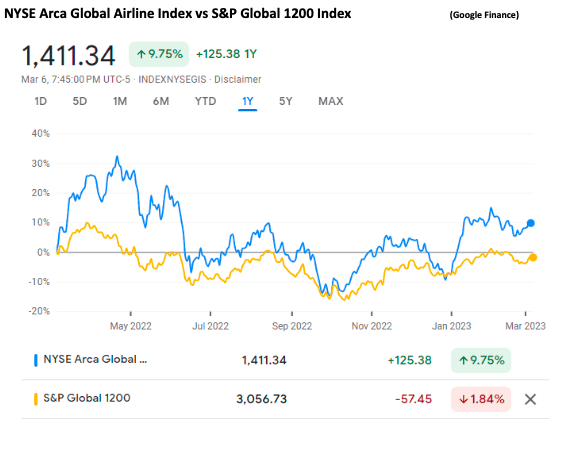
Global airline share prices have improved since the end of 2022, outperforming the overall market. Despite macro headwinds robust travel demand is allowing for higher ticket prices and capacity is constrained by airline failures, a low level of airline start-ups and low new aircraft deliveries.
The major airline credit event in 2022 was the effective confiscation of aircraft leased to Russian airlines by western lessors, which we discussed in detail in our Q1 2022 publication. There has been no fundamental change since then, although recent reports that some western aircraft are being cannibalised for spare parts is in line with our discussion of likely future developments.
In July 2022 SAS applied for Chapter 11 bankruptcy protection in the US courts. This is the only major airline bankruptcy so far this year. We have not been able to identify any other significant airline failures outside Russia since the start of 2022. Also, in June Comair (South Africa) entered liquidation after a successful restructuring in 2020. These events illustrate the fragile financial condition of many airlines post-pandemic and their vulnerability to adverse events such as the pilot strike at SAS. Hong Kong Airlines entered bankruptcy proceedings in the Hong Kong and London courts in December, but these proceedings appear to be designed to implement a pre-agreed restructuring following the bankruptcy of its shareholder Hainan Airlines Group in 2021.
Given the high level of fuel prices and the US Dollar there is a good chance of further failures this winter, particularly if there is a recession (already in January 2023 Flyr of Norway and Flybe of the UK have filed for bankruptcy).
Special Topic – Aircraft Economic Life
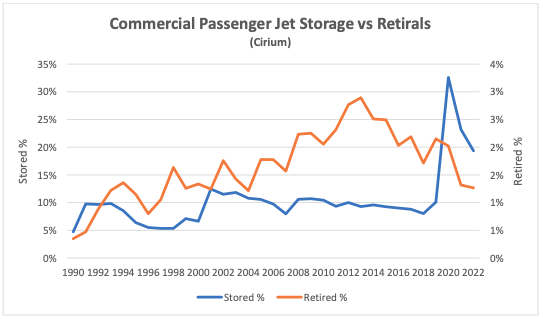
When the negative impact of Covid 19 on air traffic was understood in 2020 there was much speculation that the increase in stored aircraft would be the precursor to a spike in aircraft retirals. Looking back from early 2023 this speculation seems to have been misplaced – retirals in 2020 through 2022 turned out to be lower in absolute and relative terms than in 2019. This chart and the others in this discussion refer to passenger aircraft only – although some passenger aircraft have their lives extended by conversion to freighter and other uses the numbers are relatively small.
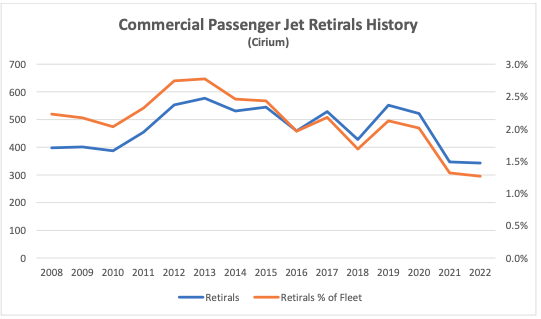
There was a big spike in aircraft storage but, as in previous industry downturns this did not result in an increase in retirals.
The chart below average fleet and retirement ages from 1990. Both are relatively stable, especially fleet age (the small increase from 2018 reflects the big drop in new aircraft deliveries discussed above).
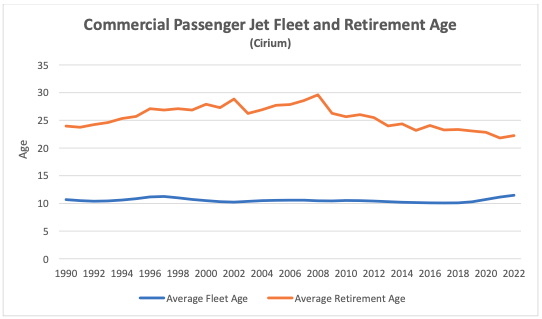
There is more variability in retirement age, but the main changes here seem to be more secular than cyclical, and in particular there has been a marked drop in average retirement age since the financial crisis. There are some possible explanations that do not bear too much scrutiny:
• Aircraft supply and demand is an unlikely explanation given that the two peaks in retirement age coincide with the aftermath of 9/11 and the onset of the financial crisis; and
• Fuel prices probably do have an impact, but retirement age is much less cyclical.
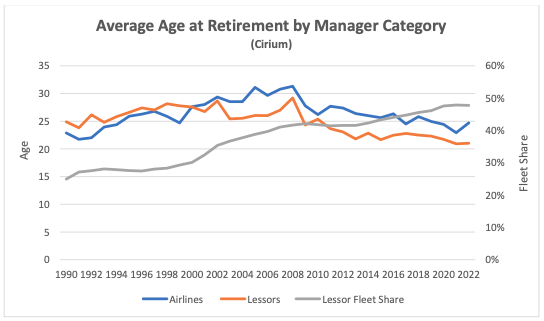
Part of the answer is looking at who controls the aircraft[3] For the last 20 years lessors have consistently retired aircraft at a younger age than airlines and during this period their fleet share has increased from 25% to 48%.
Lessors obviously need a good reason to retire aircraft as this results in an opportunity loss of revenue. However, lessors have to make a commercial judgement which also takes account of the costs associated with obtaining this revenue and the break-up value of the aircraft. Costs may include both overhaul and reconfiguration expense if a new airline operator is being sought.
Break-up value is largely driven by engine values, which are in turn very dependent on the value of engine spare parts. The engine manufacturers have an effective monopoly on new spare parts and have historically enjoyed significant pricing power until c.10 years from when the relevant aircraft type ceases production. For many years engine spare parts prices have increased by 6-7% p.a. while new aircraft prices have increased by 1.0-1.5% p.a.
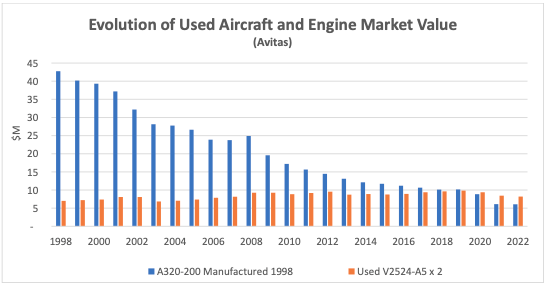
These trends have created a situation where stand-alone engine values can exceed an aircraft’s value including engines well before the point where the aircraft has reached its potential service life. Where an existing airline operator is happy to extend a lease, a lessor will have very little cost associated with extending its revenue stream and is likely to choose this option so not all aircraft will be broken up at the same age.
It should be borne in mind that not all engine types have the same level of marketability. The CFM56 and V2500 engine types associated with the A320 Ceo and B737 NG aircraft families are maintained by several different market participants who compete to buy used engines. Where engines are subject to a total care agreement with the engine OEM this is generally not the case as the engine OEM is the sole supplier of engine maintenance services.
One way to test the importance of break-up values is to look at what has happened with different members of the A320 Ceo and B737 NG families. Break-up values are very similar for all family members but the larger aircraft types command higher rents, so if break-up values matter, we should expect to see smaller types retired earlier and in greater numbers. The chart below shows how the different family members have performed through 2022. Smallest to largest aircraft types are presented left to right.
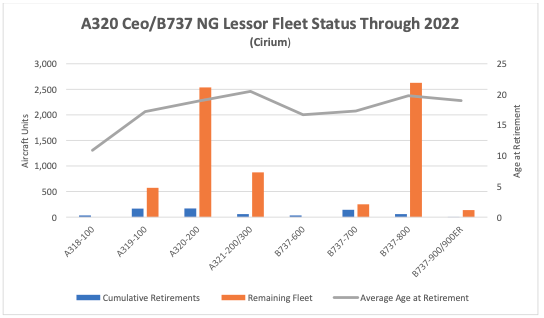
Based on the chart this approach helps to explain what is happening in the single-aisle aircraft market. However there has been a similar pattern of earlier retirement ages for small regional jets and twin-aisle aircraft where there is a much less robust engine market. It may well be that lessor decisions for these aircraft classes are driven by the same kind of economic analysis as for single- aisle aircraft, but the lessors have fewer and less attractive options.
[1] ASKs is the acronym for available seat kilometres, which is the product of the number of seats flown and distance flown.
[2] Airbus normally quotes its production rates based on an 11.5-month year for single-aisle aircraft.
[3] For the purposes of this discussion, we use the Cirium Fleets Analyser concept of aircraft Manager to denote control.