Macro-Economic Background
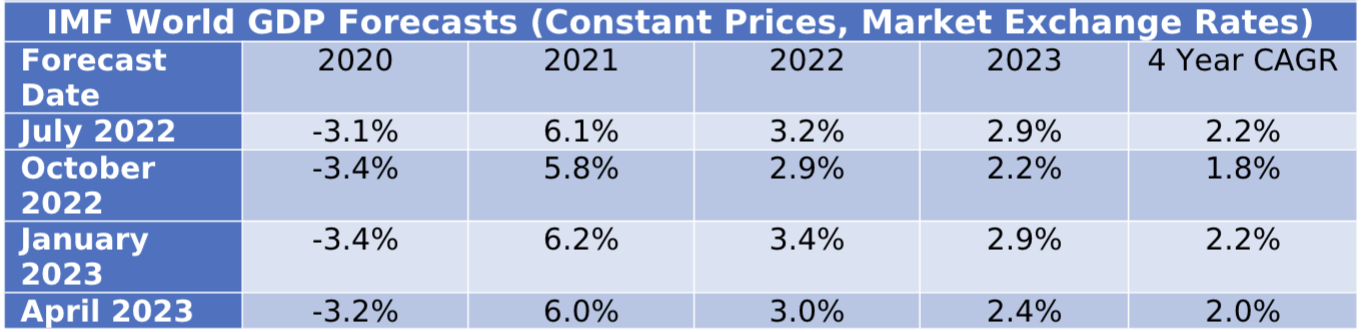
The IMF’s latest update to its World Economic Outlook (April 2023) shows a slight decline from their January update due to a combination of negative factors including the impact of Russia’s invasion of the Ukraine, supply chain disruption etc. with most of the drop occurring in the main developed economies.
Global economic growth is vital to the long-term growth of air travel. However, in the next few years the key drivers of growth will likely be very specific to the airline industry, especially the recovery from the industry downturn caused by the Covid 19 pandemic.
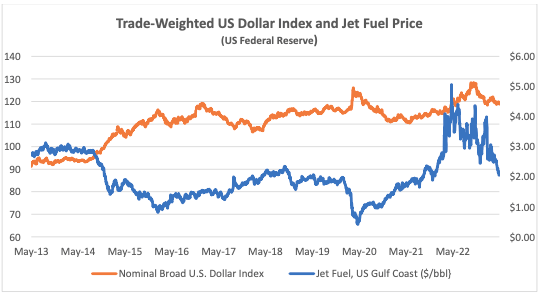
The US Dollar has weakened since its recent peak in September 2022, providing relief for airlines outside the US for dollar-denominated costs such as fuel, aircraft rents and aircraft spares. Jet fuel is also on a downwards trend, albeit with a lot of volatility.
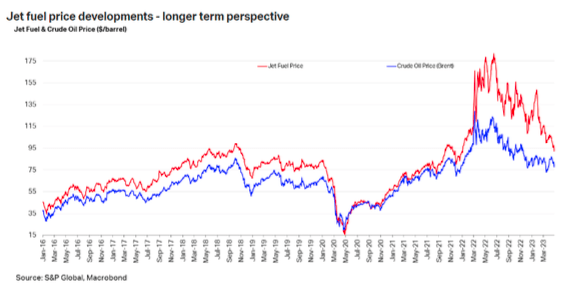
The drop in the price of fuel has mainly been a function of a reduction in the “crack spread” which is the difference between the price of crude oil and refined products. Disruption of global supply caused this spread to reach very high levels by historical standards after Russia invaded Ukraine and to remain elevated for some time. Ultimately this has proved to be a temporary phenomenon as the iATA chart below shows.
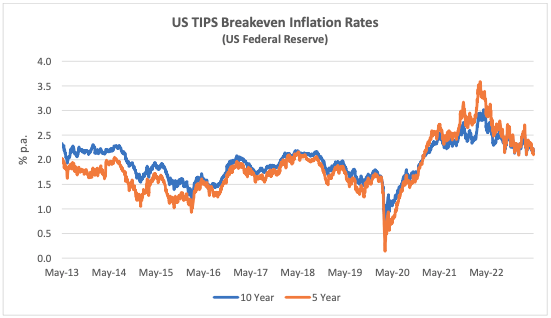
Another indicator that is potentially important to aircraft investors is the breakeven inflation rate on US Treasury Inflation-Protected Securities (TIPS). This indicator measures inflation expectations and it matters because used aircraft values are strongly influenced by the cost of new aircraft and over time this cost is linked to US Dollar inflation. In the short term this linkage is driven by escalation clauses in aircraft purchase contracts and in the long term by the general input cost environment for the aircraft manufacturers. The chart below compares the breakeven rate for 10-year and 5-year TIPS.
Traffic and Aircraft Demand
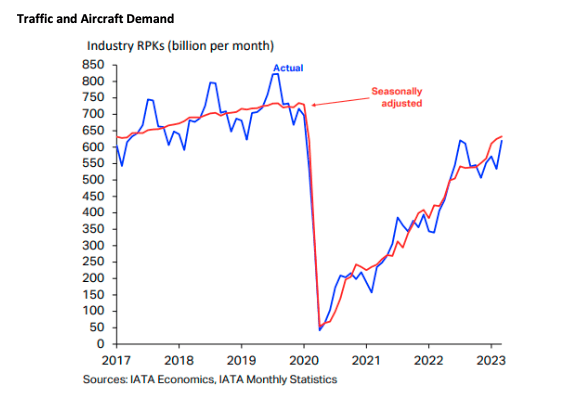
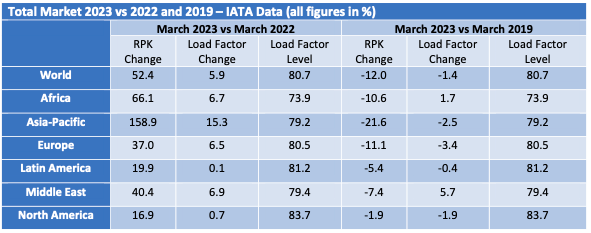
The strong recovery in air travel from the start of 2022 has continued through Q1 2023 although overall RPKs for the month of March remained 12.0% below the comparable figures for 2019. Asia Pacific was the strongest performing regions as government restrictions (especially in China) were finally relaxed. As in 2022, there was a much bigger increase in international traffic vs domestic traffic, mainly because the former is still coming off a much lower base.
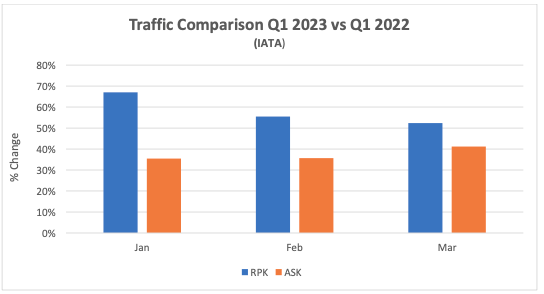
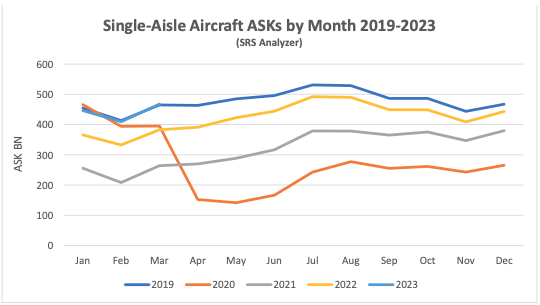
For the quarter as a whole traffic was up 58.3%. The chart below shows the changes in RPKs[1] and ASKs[2] by month and has a pattern that we expect to continue through the rest of the year. First the level of increases in RPKs gradually reduces because the year-on-year comparison is with a month in 2022 that was subject to a greater level of traffic recovery. Second the rate of increase in RPKs and ASKs becomes more alike as the recovery in load factors is largely complete, so additional capacity needs to be deployed to support further traffic growth.
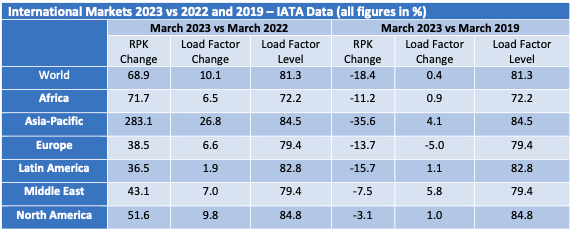
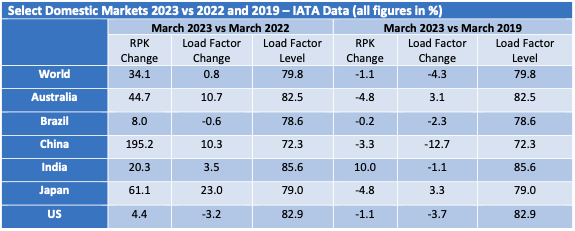
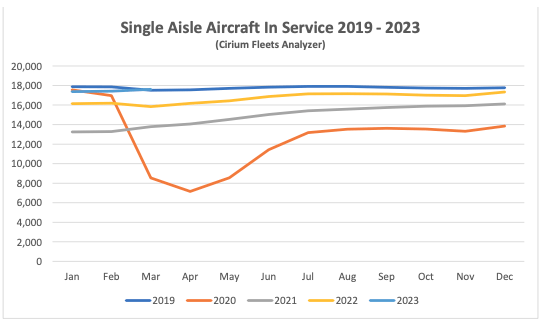
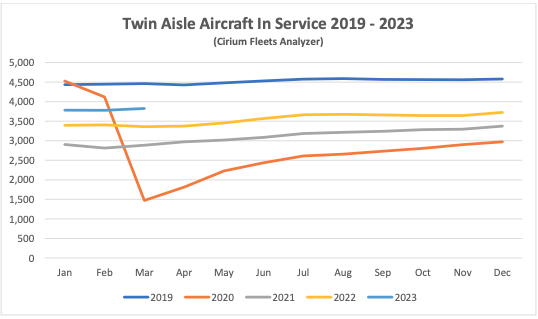
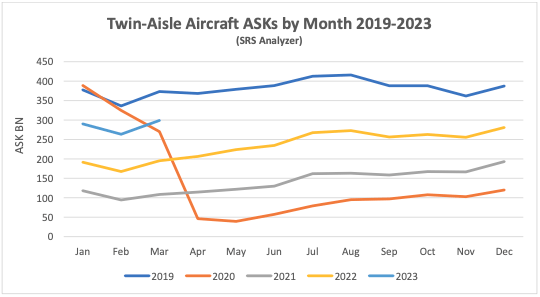
Although some short-haul aircraft serve international routes nearly all long-haul aircraft do so, and this is reflected in the relative demand for single-aisle (narrowbody) and twin-aisle (widebody) aircraft. Aircraft demand can be measured in terms of aircraft in service and ASKs, the standard measure of aircraft capacity deployed by airlines which indicates how intensively aircraft are being flown. Single aisle aircraft in service and ASK levels for Q1 2023 were in line with the comparable period in 2019. Full recovery has yet to be achieved for twin-aisle aircraft, mainly due to weak traffic to and from, and within the Asia-Pacific region. The figures by region in the tables above are based on airline domicile, so weak Europe to Asia traffic reduces recorded European international RPKs.
New Aircraft Supply
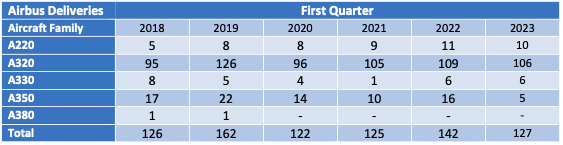
Airbus missed its 2022 delivery target significantly due to supply chain problems. Its final total of 661 aircraft compared with an initial target of 720 It has once again set a target of 720 deliveries for 2023, but this will require a significant step-up from Q1 performance where year on year deliveries were down 11%.
The latest status of Airbus’s production plans is:
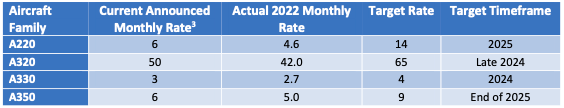
The only significant production target not captured in the table above is the objective to raise A320 family production to 75 per month by 2026.
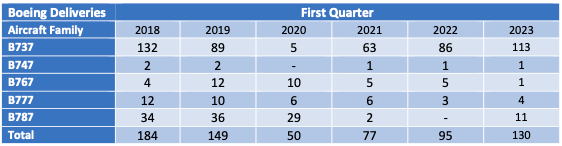
The latest status of Boeing’s production plans is:
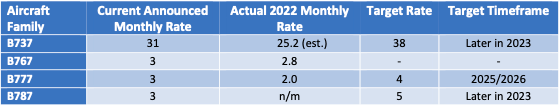
Boeing plans to deliver between 400 and 450 B737 Max aircraft in 2023, up from 387 in 2022. Part of this will be achieved by reducing aircraft in inventory, although this is a slow process due to rework requirements for these aircraft to enter service. B737 inventory fell from 250 to 225 in Q1 and Boeing’s guidance for the full year is a reduction of 8 to 10 units per month. The other contributor to higher deliveries will be an increase in monthly production from 31 to 38. There remains significant uncertainty around Boeing’s ability to meet its targets due to supply chain problems such as the requirement for rework of some fittings manufactured by Spirit AeroSystems. Boeing has also announced a medium-term production target of 50 aircraft per month by 2025/2026.
Despite this overall improvement the Max still faces challenges. It has yet to be recertified by the Chinese authorities although this is expected to be resolved soon. The FAA deadline for certification of the Max 7 and Max 10 variants has been pushed back by new legislation and they are now planned to enter service in 2023 and 2024 respectively.
Q1 2023 saw the delivery of the last B747 which like the B767 had not seen any passenger variants sold for several years. That has also been the case recently for the B777, but this is likely to change with the entry into service of the B777-8 and B777-9 from 2025. Boeing has also had quality and production problems with the B787, its main passenger twin-aisle offering. It suspended deliveries in May 2021 and restarted in Q3 2022. Production levels for are back at 3 aircraft per month going to 5 by the end of 2023 and 10 by 2025/2026. As with the Max Boeing holds a significant inventory of undelivered aircraft – 95 at the end of Q1 vs 100 at the end of 2022. Boeing has said it expects to deliver most of them within the next two years.
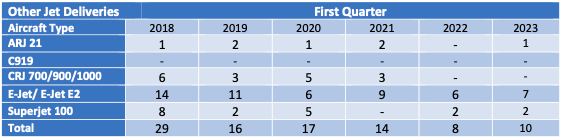
The number of commercial jets delivered by OEMs other than Airbus and Boeing remains subdued.
EasyJet recently announced that they will take delivery of 11 used A320 Ceo aircraft on lease through the Q1 2024. This illustrates the impact of the supply constraints described above and is noteworthy because low-cost carriers such as easyJet do not have large engineering departments like IAG and Lufthansa Group to facilitate the integration of used aircraft into their operations.
Airline Industry Financial Performance
We will address the latest IATA forecast below as part of our discussion of the airline credit outlook.
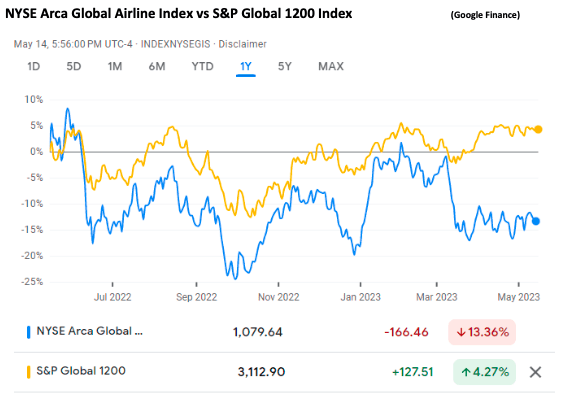
Global airline share prices have sold off significantly since March 2023, mainly due to a less favourable outlook for US airline earnings.
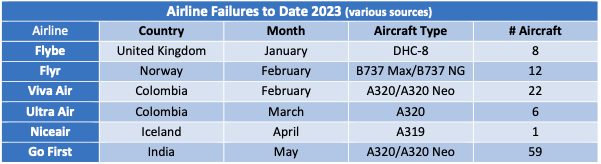
The largest airline to fail so far in 2023 is Go First of India. In its bankruptcy filing the airline declared its main problem was the need to ground about half its A320 Neo fleet due to problems with the PW1127G engine (see above). Viva Air suspended operations citing financial problems caused by the uncertainty around approval by the Colombian government of its acquisition by Avianca. Flyr filed for bankruptcy because of liquidity problems.
Special Topic – Airline Industry Credit Outlook
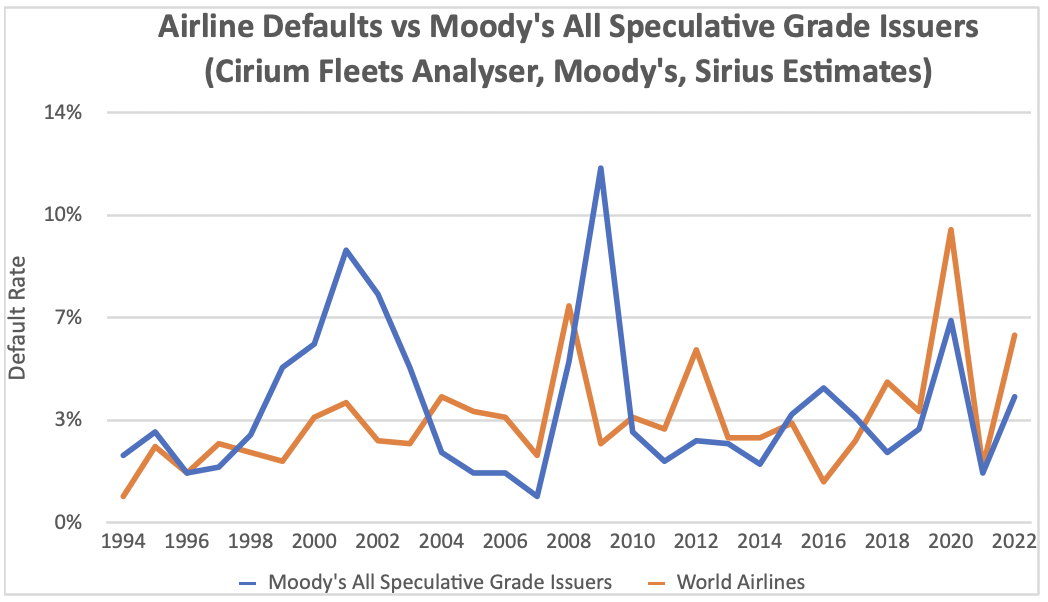
2022 was a tough year for airline defaults, mainly due to the effective expropriation of aircraft leased to Russian airlines after the invasion of Ukraine. Sirius conducts proprietary research into airline defaults and has assembled a dataset going back to 1970 which includes all airlines that have ever operated more than five passenger jet aircraft. Our data includes two types of defaults:
• Research-based defaults which are derived from a detailed study of industry sources; and
• Rules-based defaults which occur when the fleet of an airline based in a high-risk country
drops by 20% or more year on year. This approach is designed to capture informal defaults that may not involve formal bankruptcy proceedings.
Our methodology shows 2022 as the third-highest year for airline defaults by issuer after 2020 and 2008. To put airline industry experience in context the chart below compares it with the track record for Moody’s All Speculative Grade Issuers – this seems a reasonable comparison given the very small number of investment grade airlines. The average of airline defaults from 1994 is 3.5% p.a. vs 3.9% p.a. for the Moody’s universe so the former is not a uniquely risky industry, even if some of the risks it faces are unique given its global characteristics. Absent another geopolitical shock history suggests is it reasonable to expect a moderation in defaults for 2023 once there is reasonable economic outlook, and experience so far this year is in line with this expectation.
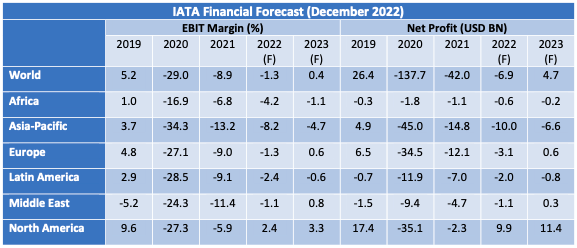
IATA’s semi-annual Global Outlook for Air Transport includes the most widely referenced forecast for airline industry financial performance. The December 2022 edition shows the airline industry returning to near breakeven in 2022 and moving into profit in 2023. North America is forecast to be by far the strongest performer followed by Europe while the Middle East, Asia-Pacific, Latin America and Africa remain loss-making through 2023. The differences in profitability are not very great apart from North America and Asia-Pacific, with 2023 EBIT margins for Africa, Europe, the Middle East and Latin America falling within a range of -1.1% to +0.8%. The single biggest reason for North America’s outperformance is its lack of exposure to the impact of a historically strong US Dollar, and the biggest reason for Asia-Pacific’s underperformance is relatively high government travel restrictions.
As we approach the half-way point of 2023 it might be useful to take a closer look at the assumptions behind IATA’s forecast and see how they look compared to actual outcomes so far this year.
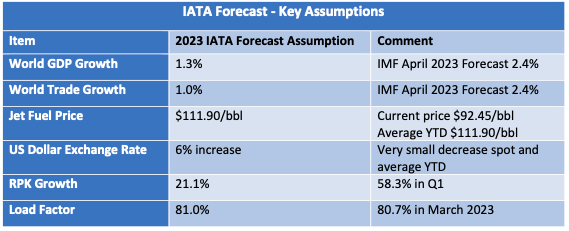
There are no key assumptions that appear too optimistic based on actual experience to date. The latest IMF forecasts for world output and trade in 2023 are in fact well ahead, but as we note above air travel growth at present is not tightly connected to the overall economy right now. A combination of lower fuel costs and a stable US Dollar should be helpful for airline margins, particularly outside of North America. Traffic growth has some potential to outperform. Although cumulative year on year growth will decline from the level achieved in Q1, by March RPKs were only 12% lower than in March 2019 and the overall forecast is for 2023 RPKs to be down 14.5% on 2019. These figures imply that a final traffic recovery is ahead of schedule, and on a further positive note global domestic bookings were 20% ahead of 2019 levels by mid-April. There is little chance of meaningful upside on load factors as these are already back near historic highs.
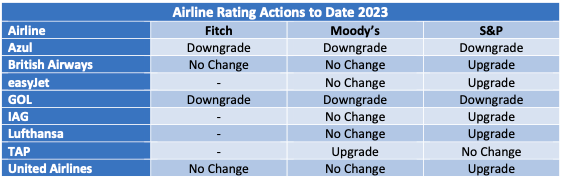
Another way to look at changes in airline industry credit status is to follow changes in public ratings. Ratings actions to date in 2023 have involved six upgrades and two downgrades as set out in the table below. The overall outcome here is modestly positive, as the upgrades apply to bigger airlines.
Our analysis of historic defaults suggests that the industry cycle is not necessarily the most important cause in periods where there is no extreme event such as the pandemic. Often there are factors specific to a particular airline that are more important such as quality of management, labour relations etc. One reasonably common occurrence is that an airline that did not avail of bankruptcy protection in a major downturn is forced to do so a few years later because of increased competition from airlines that did. Despite a reasonably positive industry outlook there is a good chance of this and other kinds of “aftershocks” occurring this year and next.
[1] RPKs is the acronym for revenue passenger kilometres, which is the product of the number of paying passengers times distance flown.
[2] ASKs is the acronym for available seat kilometres, which is the product of the number of available seats flown times distance flown.
[3] Airbus normally quotes its production rates based on an 11.5-month year for single-aisle aircraft.
Disclaimer
This Presentation has been made to you solely for general information purposes and is not intended to provide, and should not be relied upon for legal, tax, accounting, investment, or financial advice. This Presentation is not a sales material and does not constitute or form any part of any offer, invitation or recommendation to the recipient, its affiliates or any other person to underwrite, sell or purchase securities, assets or any other product, nor shall it or any part of it form the basis of, or be relied upon, in any way in connection with any contract or transaction decision relating to any securities, assets or any other product. None of Sirius, its affiliates or shareholders shall have any responsibility or liability to the recipient, its affiliates, shareholders or any third party in relation to this Presentation or any other document or materials prepared by Sirius or its affiliates, officers, directors, employees, advisers or agents. Sirius and its affiliates, officers, directors, employees, advisers and agents have taken all reasonable care to ensure that the information contained in this Presentation is accurate. Neither Sirius nor any of its affiliates, officers, directors, employees, advisors or agents has any obligation to update this Presentation. Under no circumstances should the delivery of this Presentation, irrespective of when it is made, create an implication that there has been no change in the affairs of the entities that are the subject of this Presentation. This Presentation may be updated and amended by a supplement and, where such supplement is prepared, this Presentation will be read and construed with such supplement. The statements herein which contain such terms as “may”, “will”, “should”, “expect”, “anticipate”, “estimate”, “intend”, “continue” or “believe” or the negatives thereof or other variations thereon or comparable terminology are forward-looking statements and not historical facts. No representation or warranty, express or implied, is made as to the fairness, accuracy or completeness of such statements, estimates and projections. The recipient should not place reliance on any forward-looking statements. Neither Sirius nor its affiliates undertakes any obligation to update or revise the forward-looking statements contained in this Presentation to reflect events or circumstances occurring after the date of this Presentation or to reflect the occurrence of anticipated events. The information set out in this Presentation has been prepared by Sirius based upon various methodologies and calculations which it believes to be reasonable and appropriate. Past performance cannot be a guide to future performance. In preparing this Presentation, Sirius has relied upon and assumed, without independent verification, the accuracy and completeness of all information available from public sources or which was provided to it or otherwise reviewed by it. This Presentation supersedes and replaces any other information provided by Sirius or its affiliates, officers, directors, employees, advisers or agents in respect of the content of the Presentation. No information or advice contained in this Presentation shall constitute advice to an existing or prospective investor in respect of his personal position. None of Sirius, its affiliates, its or its affiliates’ officers, directors, employees or advisers, connected persons or any other person accepts any liability whatsoever for any loss howsoever arising, directly or indirectly, from this Presentation or its contents.