
Macro-Economic Background
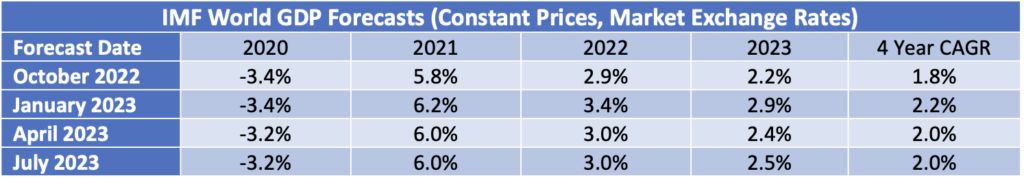
The IMF’s latest update to its World Economic Outlook (July2023) shows a marginal improvement from their April update. The IMF’s discussion of the world economy centres on the impact of central banks’ efforts to control inflation which is causing moderately low growth by historical standards. This situation is expected to persist through 2024.
Global economic growth is vital to the long-term growth of air travel. However, in the next few years the key drivers of traffic growth will likely be very specific to the airline industry, especially the recovery from the industry downturn caused by the Covid 19 pandemic.
The US Dollar has weakened since its recent peak in September 2022, providing relief for airlines outside the US for dollar-denominated costs such as fuel, aircraft rents and aircraft spares.
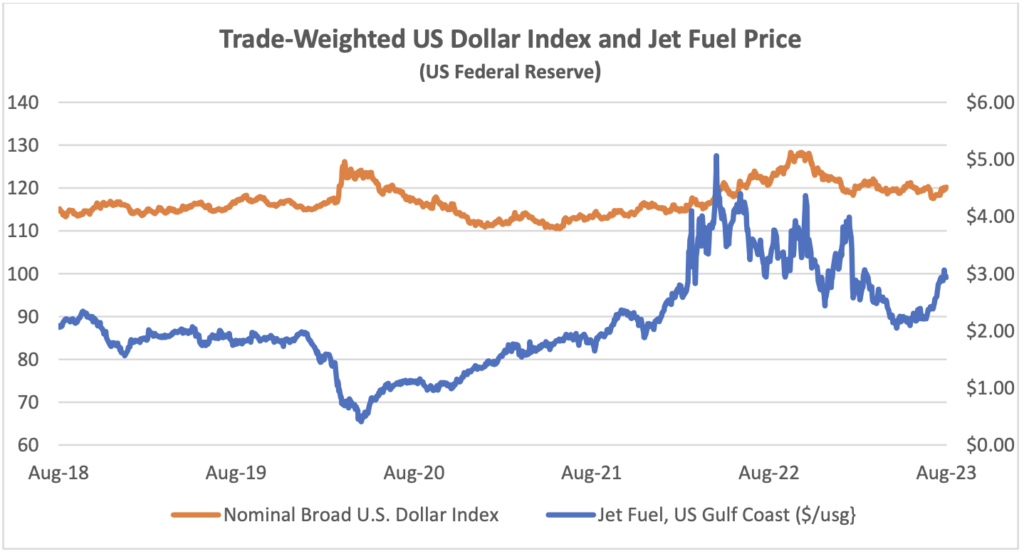
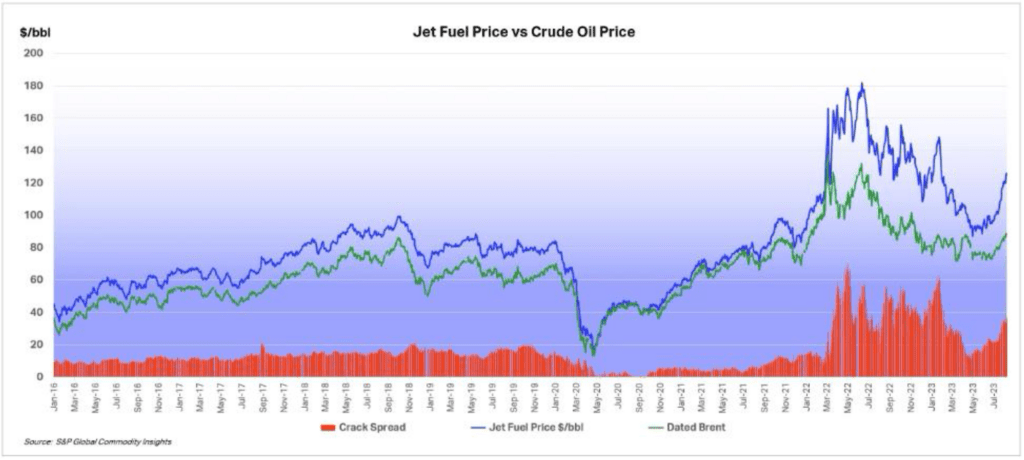
The price of jet fuel has increased sharply in the last three months and as the IATA chart below shows this is mainly due to an increase in the “crack spread”[1]. Some of the issues that have contributed to this increase include the pace of traffic recovery, especially in Asia Pacific, and reported local refinery issues in the US and Europe. The current level of the crack spread is high by historic standards, and it seems reasonable to expect that it will reduce over time.
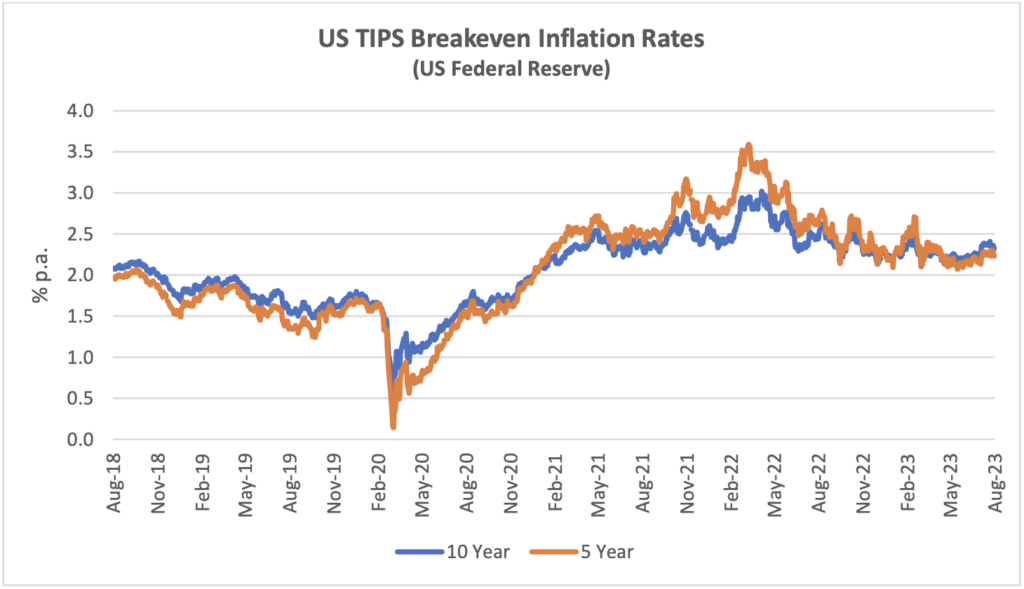
Another indicator that is potentially important to aircraft investors is the breakeven inflation rate on US Treasury Inflation-Protected Securities (TIPS). This indicator measures inflation expectations and it matters because used aircraft values are strongly influenced by the cost of new aircraft and over time this cost is linked to US Dollar inflation. In the short term this linkage is driven by escalation clauses in aircraft purchase contracts and in the long term by the general input cost environment for the aircraft manufacturers. The chart below compares the breakeven rate for 10-year and 5-year TIPS.
Traffic and Aircraft Demand
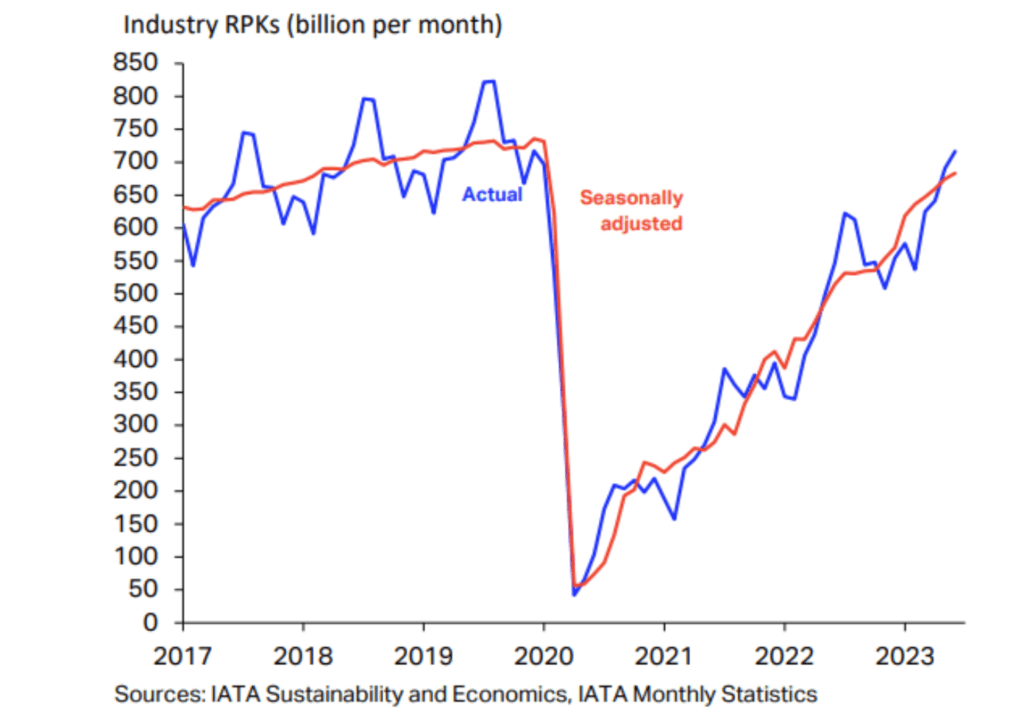
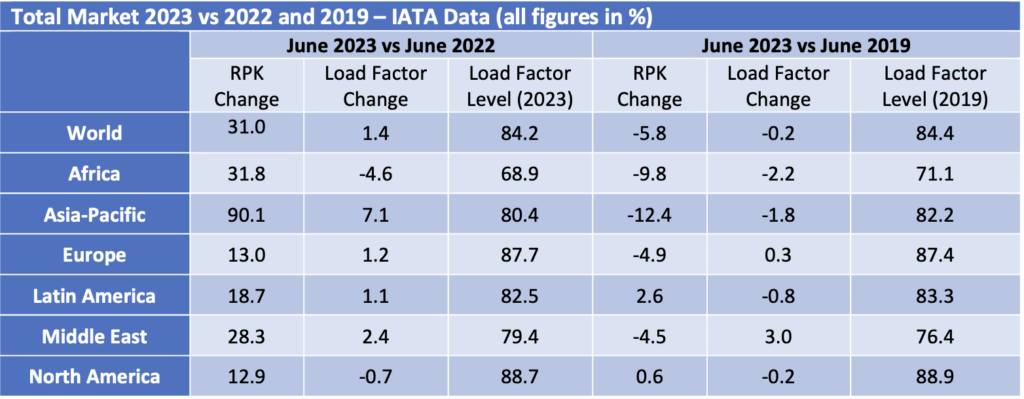
The strong recovery in air travel from the start of 2022 has continued through H1 2023 and overall RPKs for the month of June were only 5.8% below the comparable figures for 2019. Asia Pacific was the strongest performing regions as government restrictions (especially in China) were finally relaxed. As in 2022, there was a much bigger increase in international traffic vs domestic traffic, mainly because the former is still coming off a much lower base.
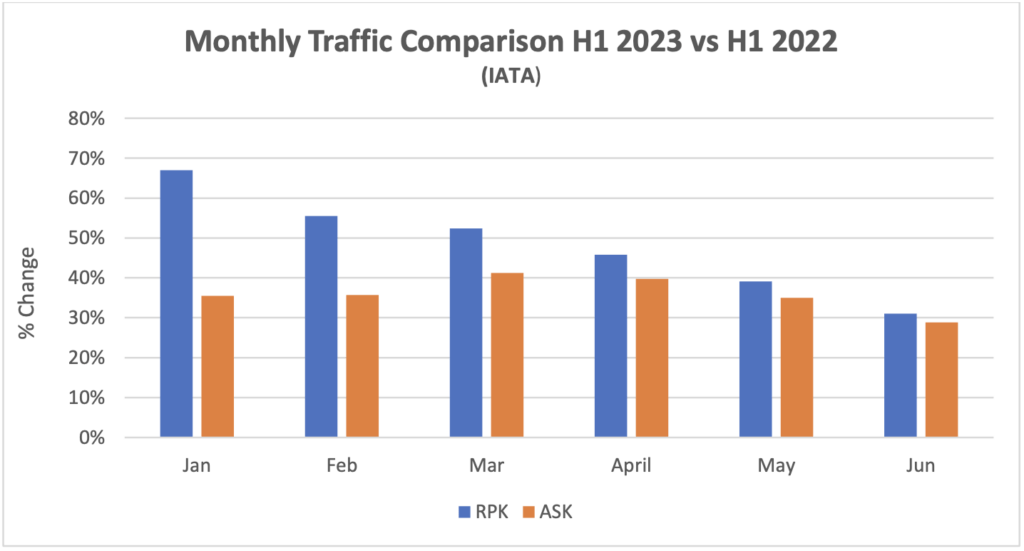
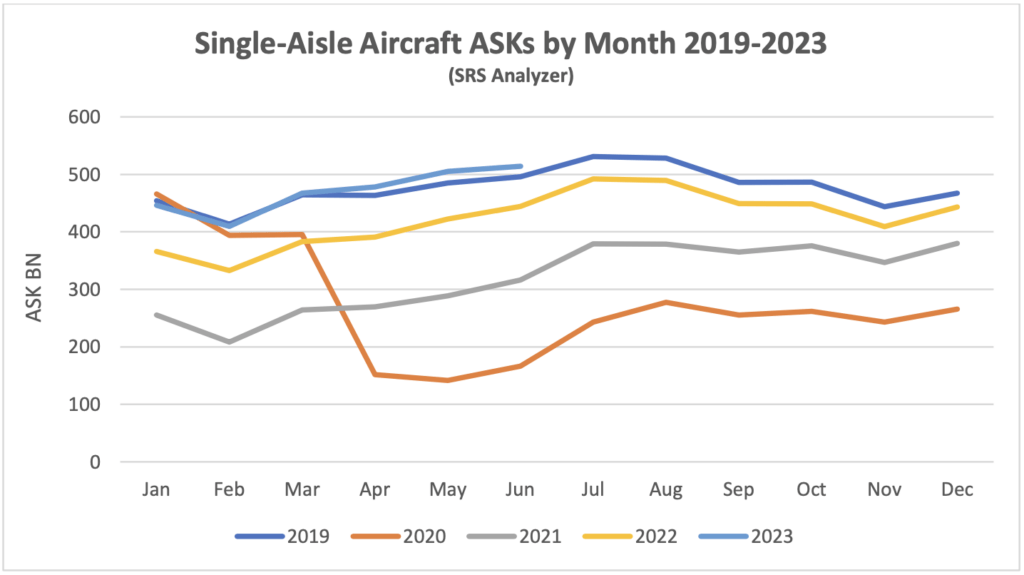
For H1 2023 as a whole traffic was up 47.2%. The chart below shows the changes in RPKs[2] and ASKs[3] by month and has a pattern that we expect to continue through the rest of the year. First the level of increases in RPKs gradually reduces because the year-on-year comparison is with a month in 2022 that was subject to a greater level of traffic recovery. Second the rate of increase in RPKs and ASKs becomes more alike as the recovery in load factors is largely complete, so additional capacity needs to be deployed to support further traffic growth.
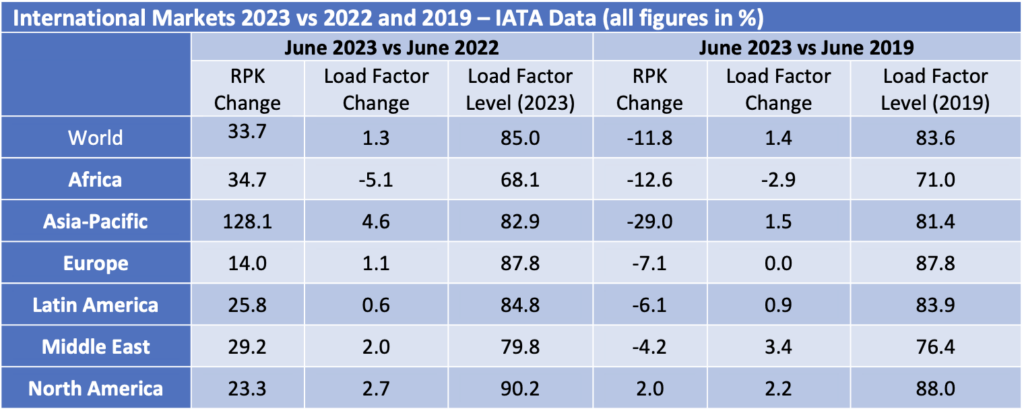
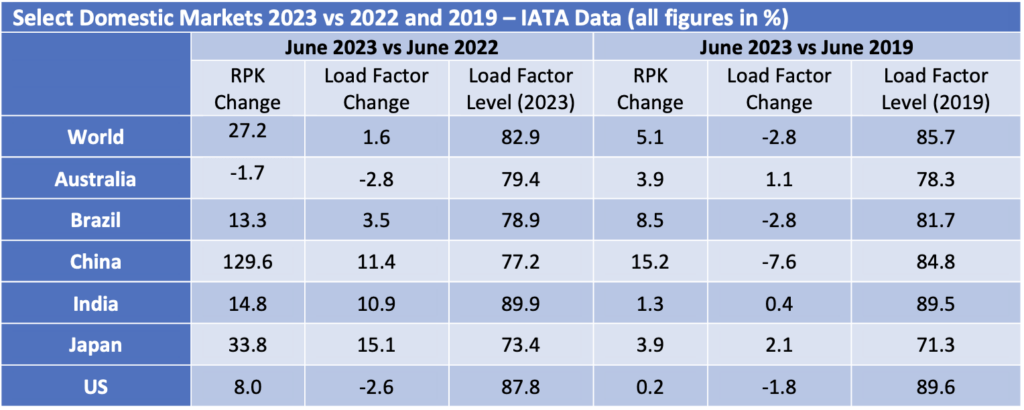
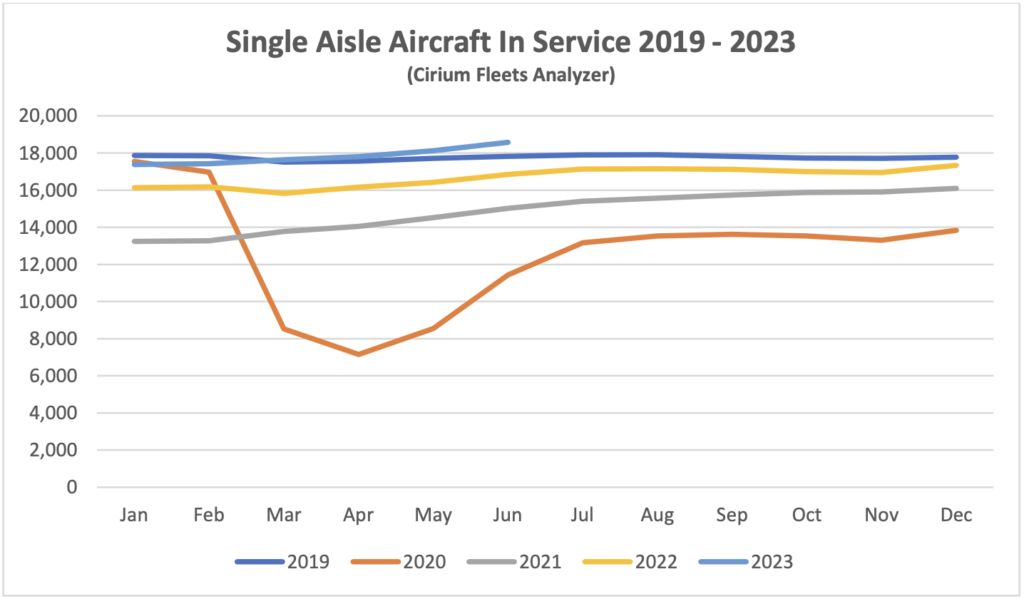
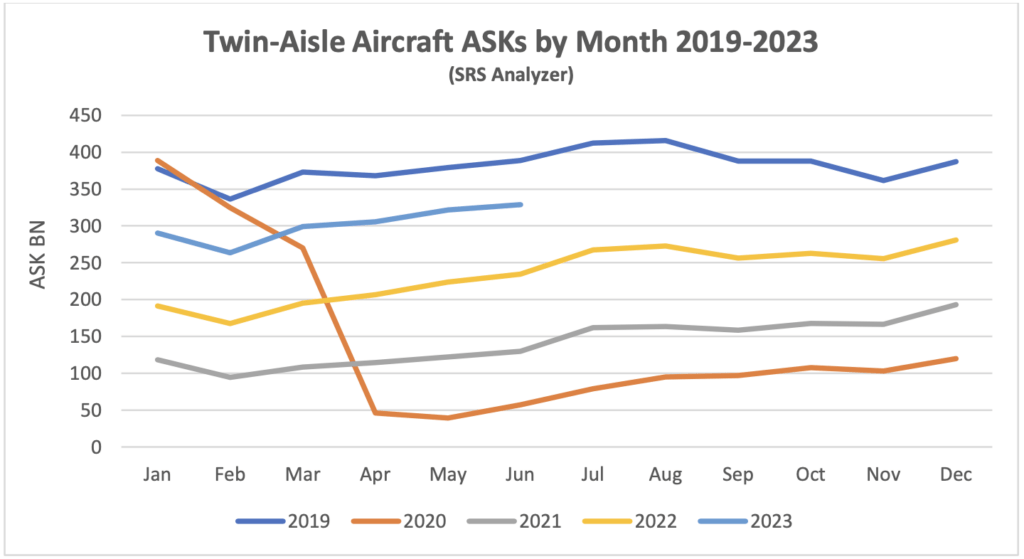
Although some short-haul aircraft serve international routes nearly all long-haul aircraft do so, and this is reflected in the relative demand for single-aisle (narrowbody) and twin-aisle (widebody) aircraft. Aircraft demand can be measured in terms of aircraft in service and ASKs, the standard measure of aircraft capacity deployed by airlines which indicates how intensively aircraft are being flown. Single aisle aircraft in service and ASK levels for Q2 2023 were ahead of the comparable period in 2019. This is consistent with the 5.1% increase in domestic traffic in June 2023 compared to June 2019.
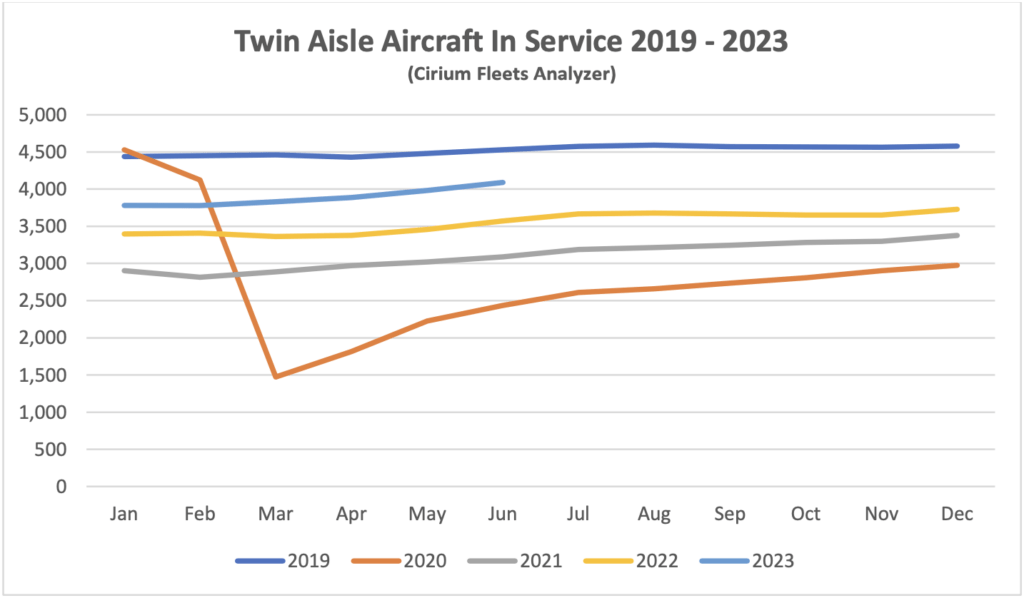
Full recovery has yet to be achieved for twin-aisle aircraft, mainly due to weak traffic to and from, and within the Asia-Pacific region. The figures by region in the tables above are based on airline domicile, so weak Europe to Asia traffic reduces recorded international RPKs in other regions. Twin-aisle aircraft in service has shown a greater improvement relative to 2019 than ASKs which suggests that aircraft are being returned to service with lower utilisation in anticipation of continued recovery.
New Aircraft Supply
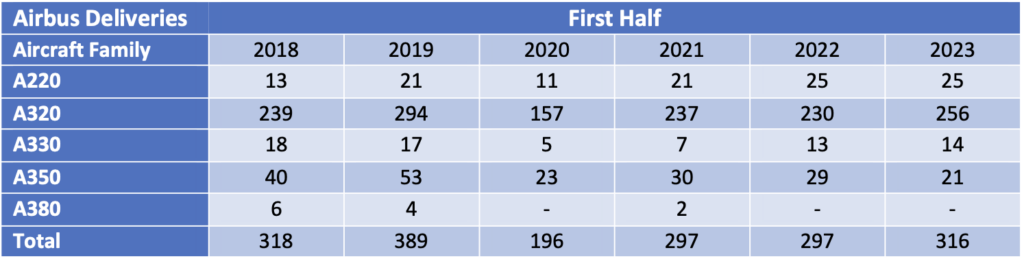
Airbus missed its 2022 delivery target significantly due to supply chain problems. Its final total of 661 aircraft compared with an initial target of 720 It has once again set a target of 720 deliveries for 2023, but this will require a significant step-up from H1 performance. The table below highlights achieved production rates in H1 2023 vs official announced current rates, with the aggregate achieved rate of 55 aircraft per month some way below the aggregate announced rate of 65.
The latest status of Airbus’s production plans is:
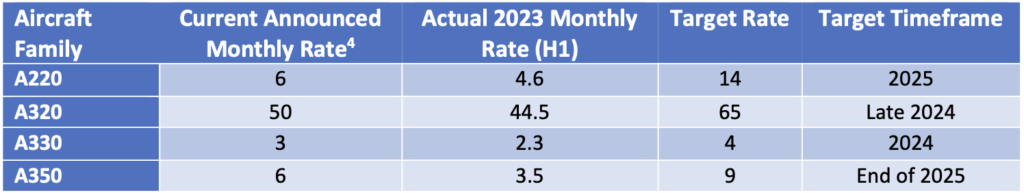
The only significant production target not captured in the table above is the objective to raise A320 family production to 75 per month by 2026.
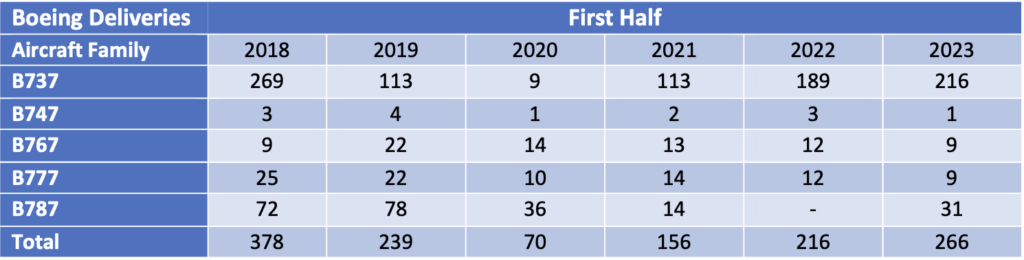
The latest status of Boeing’s production plans is:
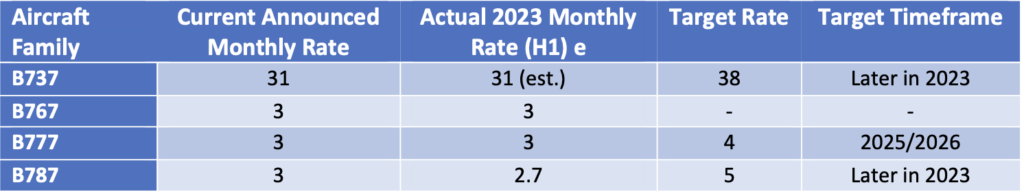
Boeing plans to deliver between 400 and 450 B737 Max aircraft in 2023, up from 387 in 2022. Part of this will be achieved by reducing aircraft in inventory, although this is a slow process due to rework requirements for these aircraft to enter service. B737 inventory fell from 250 to 225 in Q1 and 220 in Q2 a reduction of 5 per month. Boeing’s guidance for the full year is a reduction of 8 to 10 units per month, which is probably partly dependent on their ability to increase deliveries to Chinese airlines (85 of the aircraft in inventory in June 2023 are contracted for delivery to China). The other contributor to higher deliveries will be an increase in monthly production from 31 to 38. There remains significant uncertainty around Boeing’s ability to meet its targets due to supply chain problems such as the requirement for rework of some fuselage sections manufactured by Spirit AeroSystems. Boeing has also announced a medium-term production target of 50 aircraft per month by 2025/2026.
Despite this overall improvement the Max still faces challenges. The FAA deadline for certification of the Max 7 and Max 10 variants has been pushed back by new legislation and they are now planned to enter service in 2024 (Boeing had previously targeted EIS for the Max 7 in 2023).
Q1 2023 saw the delivery of the last B747 which like the B767 had not seen any passenger variants sold for several years. That has also been the case recently for the B777, but this is likely to change with the entry into service of the B777-8 and B777-9 from 2025. Boeing has also had quality and production problems with the B787, its main passenger twin-aisle offering. It suspended deliveries in May 2021 and restarted in Q3 2022. Production levels for are back at 3 aircraft per month going to 5 by the end of 2023 and 10 by 2025/2026. As with the Max Boeing holds a significant inventory of undelivered aircraft – 85 at the end of Q2 vs 100 at the end of 2022. Boeing has said it expects to deliver most of them within the next two years.
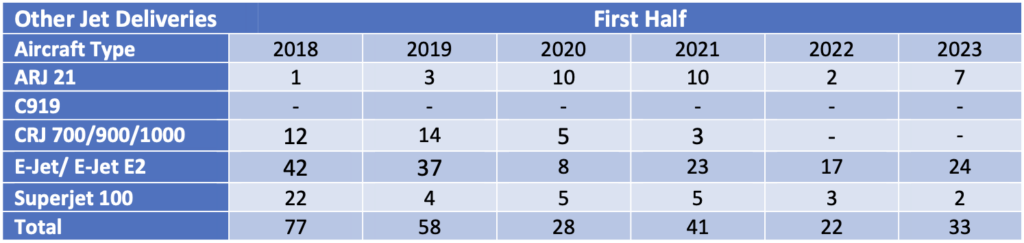
The number of commercial jets delivered by OEMs other than Airbus and Boeing remains subdued.
The reduction in new aircraft production by Airbus and Boeing has had a major impact in mitigating the impact of the pandemic on the balance of aircraft supply and demand, especially for single-aisle aircraft. If the OEMs had been able to continue delivering aircraft at their pre-pandemic peak levels the total world fleet would now reflect over 3,060 additional deliveries. One of the key supply chain bottlenecks relates to engines – this is partly down to labour shortages but there is also an issue with a greater than anticipated requirement for spare parts because the new technology CFM LEAP and P&W GTF engines are experiencing persistent technical problems and require more frequent overhauls than expected when they entered service. The shortage of spare parts and spare engines is now causing some airlines to temporarily ground aircraft, particularly in regions where the operating environment is harsh due to aridity, high temperatures and air pollution.
EasyJet recently announced that they will take delivery of 11 used A320 Ceo aircraft on lease through Q1 2024. This illustrates the impact of the supply constraints described above and is noteworthy because low-cost carriers such as easyJet do not have large engineering departments like IAG and Lufthansa Group to facilitate the integration of used aircraft into their operations.
Airline Industry Financial Performance
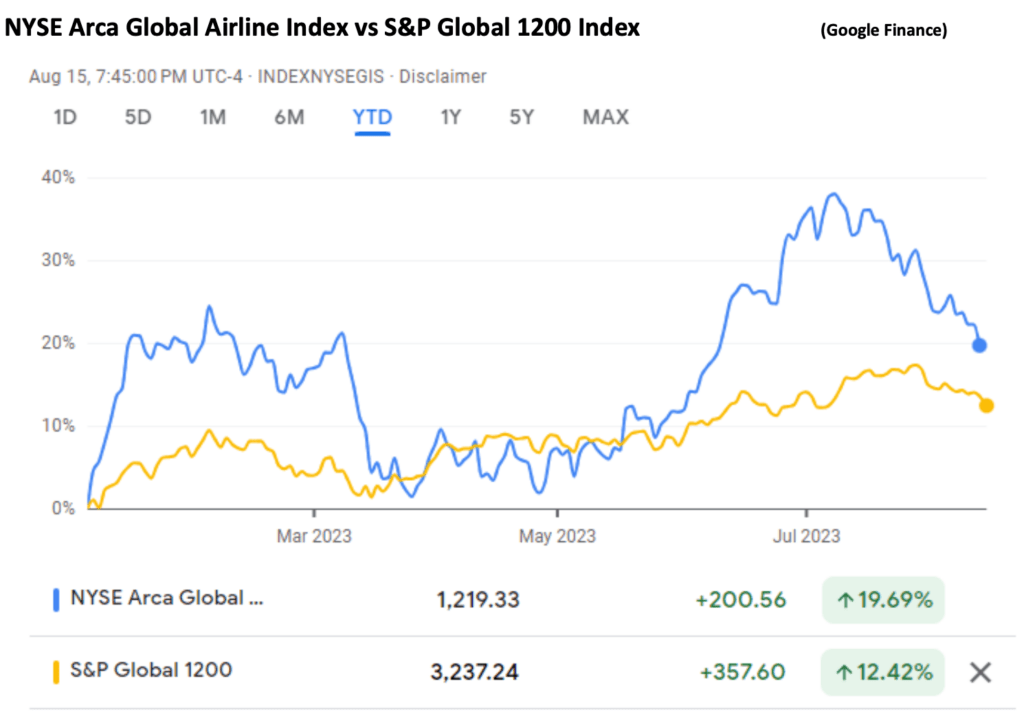
So far this year global airline share prices have been volatile with a strong start and summer offset by a significant sell-off from March to May. The most recent IATA financial forecast which was discussed in our last update showed upward revisions for 2023 industry net income forecasts and there have been some very strong Q2 2023 earnings reported by major European airlines. This good news is not necessarily captured by the index as it has a heavy focus on North America where the industry recovery is longer established.
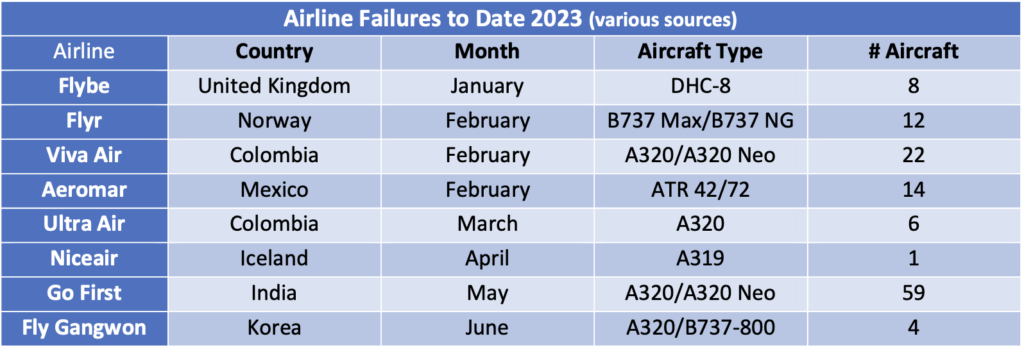
The largest airline to fail so far in 2023 is Go First of India. In its bankruptcy filing the airline declared its main problem was the need to ground about half its A320 Neo fleet due to problems with the PW1127G engine (see above). Viva Air suspended operations citing financial problems caused by the uncertainty around approval by the Colombian government of its acquisition by Avianca. Flyr filed for bankruptcy because of liquidity problems.
Special Topic – Aircraft Leasing Industry Financial Performance through 2022
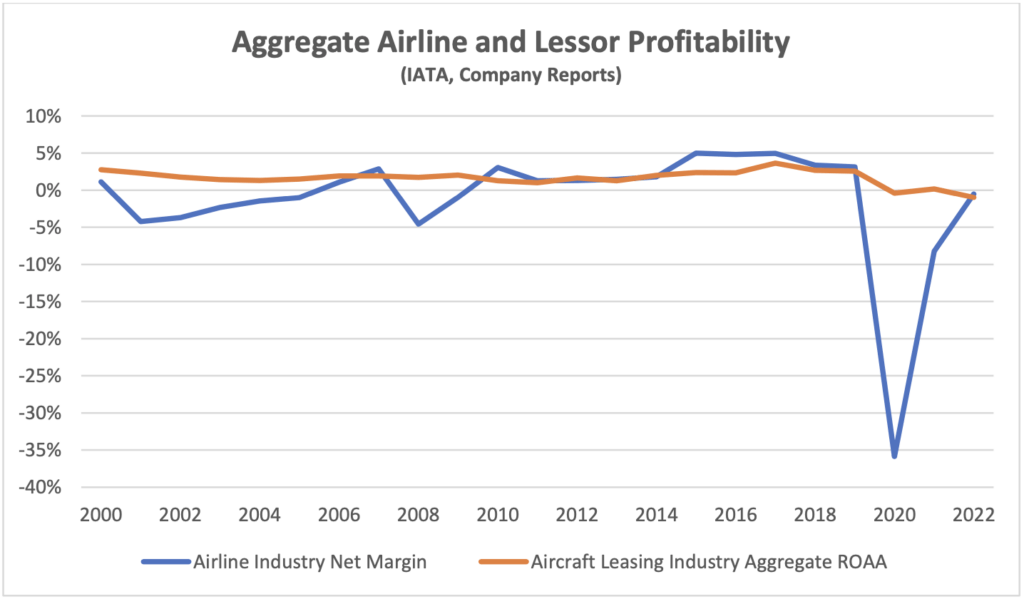
We last reviewed the financial performance of the aircraft leasing industry as of 2020. It has been a very tough business environment in the subsequent two years with the de facto expropriation of most aircraft leased to Russian airlines in 2022 adding to the challenges posed by the pandemic. Despite these problems the aggregate performance of the industry has been relatively stable, particularly relative to the performance of the airline industry[4].
The only two aircraft leasing companies to seek the protection of the courts were Nordic Aviation Capital and Voyager, both in 2020 so before Russia invaded the Ukraine. The two companies both pursued relatively niche asset strategies compared to most aircraft lessors with a focus on regional aircraft and widebody aircraft respectively.
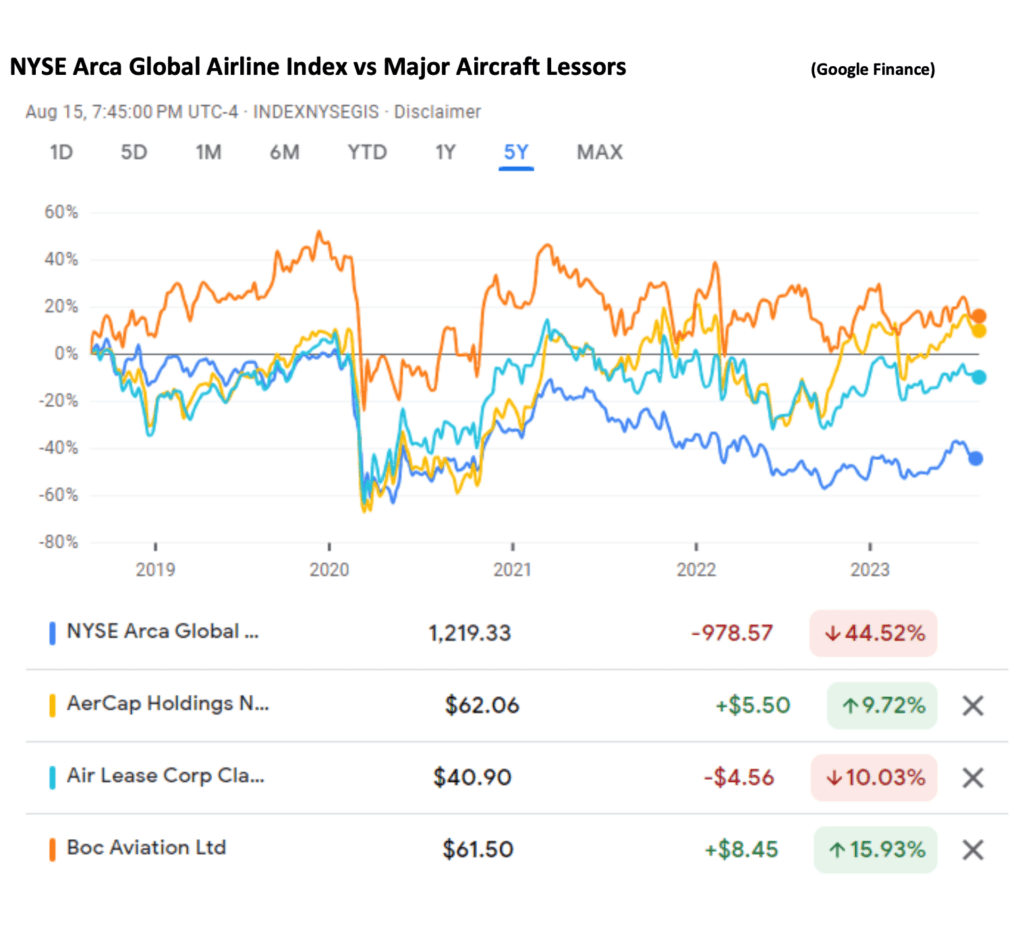
This difference in performance is also reflected in relative share price performance. The chart below compares the performance of the NYSE Arca Global Airline Index with the three largest public aircraft lessors over 5 years. The lessor stocks have significantly outperformed the airline industry during this period which encompasses the pandemic.
2022 was by far the worst year for the lessors because of the write-downs associated with the aircraft expropriated by Russia, with a negative 1.0% return on assets. In practically all cases these write-downs were for the entire net exposure to these assets. The impact of these events on lessor share prices may have been mitigated because of the likelihood of at least partial recovery of losses through various insurance policies. The claims made by the lessors are subject to court proceedings and the timing of any recoveries is uncertain.
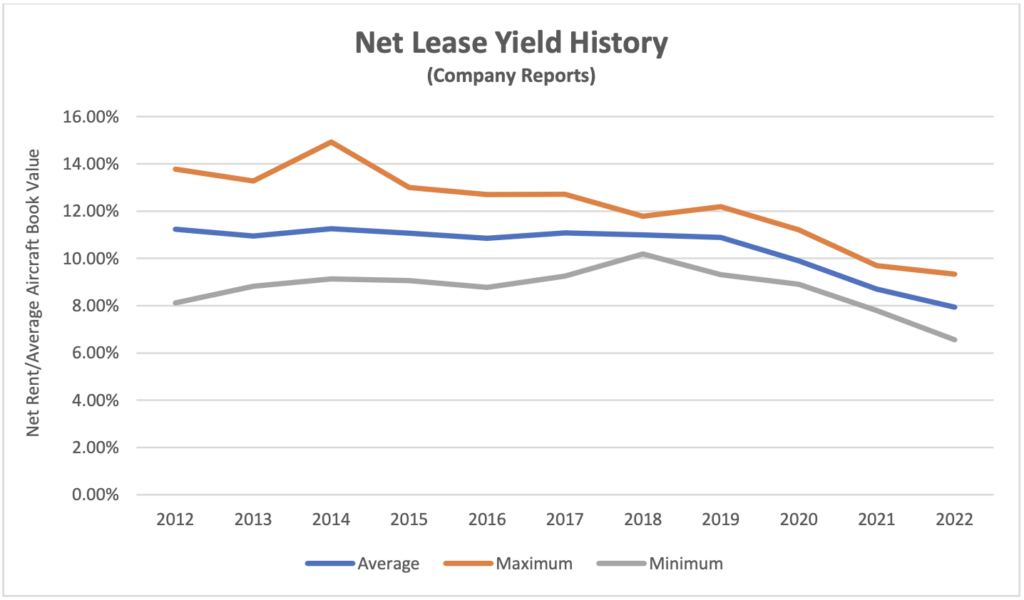
Despite this robust performance there are some concerns around the short to medium term outlook for the industry and one issue that stands out is the drop in net lease rental yield. This performance indicator is the net rent earned by the lessor excluding maintenance rent etc.as a percentage of average aircraft book value. For the purposes of calculating the latter we include assets such as maintenance rights and lease premiums as both these items are allocations of amounts paid for used aircraft and their exclusion would inflate net lease yield compared to aircraft bought new. The chart below shows the range of yields achieved by the group of lessors we follow over the last ten years. There has been a clear reduction of c. 3% p.a. since 2019 which coincides with the onset of the pandemic, and it seems worthwhile to analyse what has caused this and what the prospects are for any recovery.
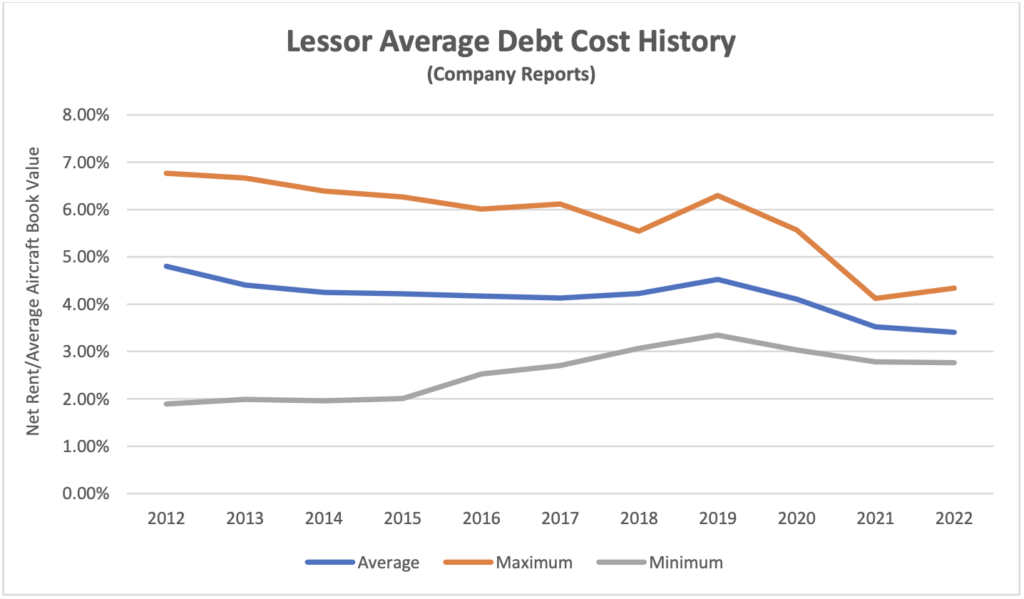
Part of the explanation is lower interest rates. If we look at average debt cost this has declined by a little over 1% p.a. during the same period. As the chart shows these industry averages change slowly over time because lessors substantially hedge their fixed rate leases with fixed rate debt at lease inception. Aircraft leasing is a very competitive industry and one would expect lower funding costs to be passed on in lower lease rates, so lower debt cost explains roughly one third of the overall rental yield decline (in passing, the c. 2.0% p.a. minimum debt cost from 2012 to 2015 was achieved by one large lessor that negotiated a high proportion of floating-rate leases that it could match fund with floating rate debt, and it had a relatively low lease yield relative to its peers as a result). With recent increases in US interest rates, we should expect higher debt costs and rents in the future, but these increases will be gradual.
Despite the credit impact of the pandemic and Russia, bad debts have been relatively small. Credit impairments for the three years 2020-2022 have amounted to just 1.4% of aggregate net rent. There are several reasons why this happens, but probably the most important is that early lease termination is a common element of managing a delinquent lessee so rent no longer accrues. Lessors are rightly very focussed on the integrity of their assets and associated records so physical possession is more important than “running the meter”. There is still some exposure to future bad debts as aggregate receivables and deferred rents were 18% of net rent in 2022 but the reduction achieved from 25% in 2021 suggests that for the most part these exposures are being managed down successfully.
The flip side of early termination is that there has been a sharp increase in the number of aircraft off lease. The chart below shows the ten-year view across the industry as a whole and it is reasonable to suppose that the group of lessors we follow would have had a similar experience (we cannot produce completely accurate numbers by lessor as it is not always clear which aircraft are owned and which are managed).
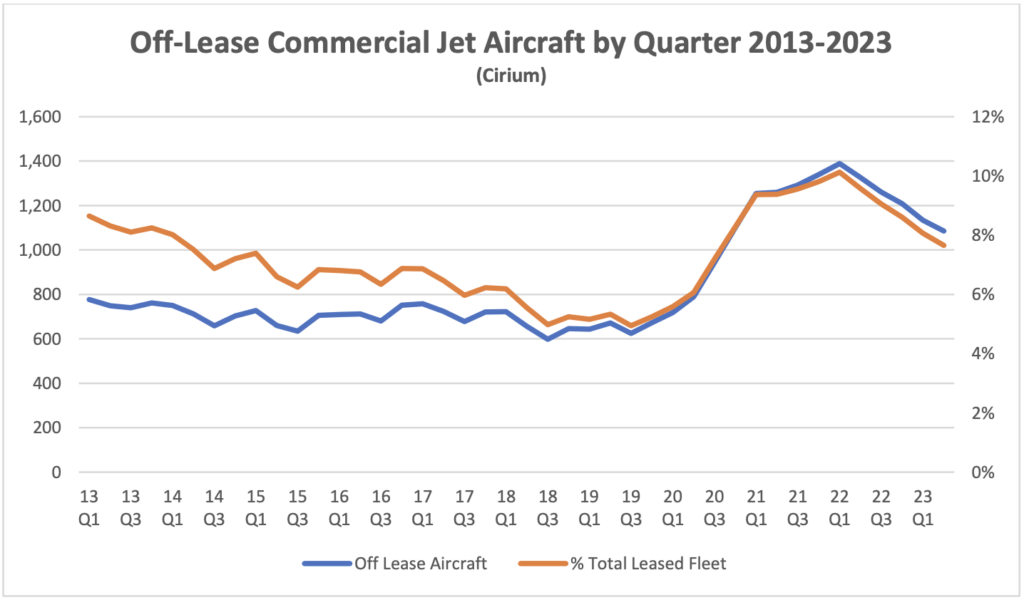
The fleet percentage line shows that relative reductions in off-lease aircraft after a downturn are slow and steady, but it is reasonable to expect there will be continuing improvement in this metric in 2023 and beyond, particularly with the supply chain issues affecting new aircraft deliveries.
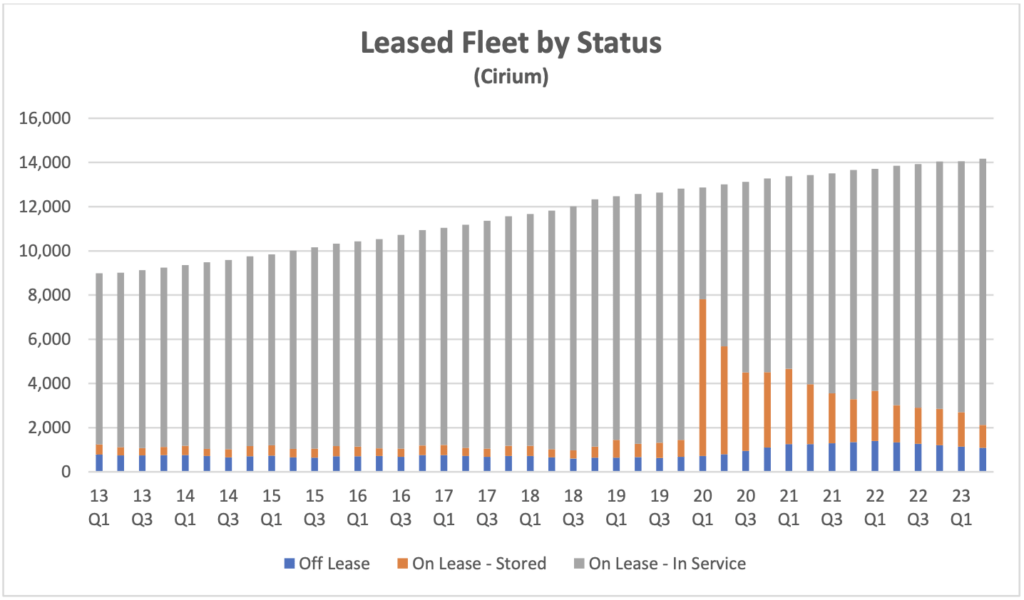
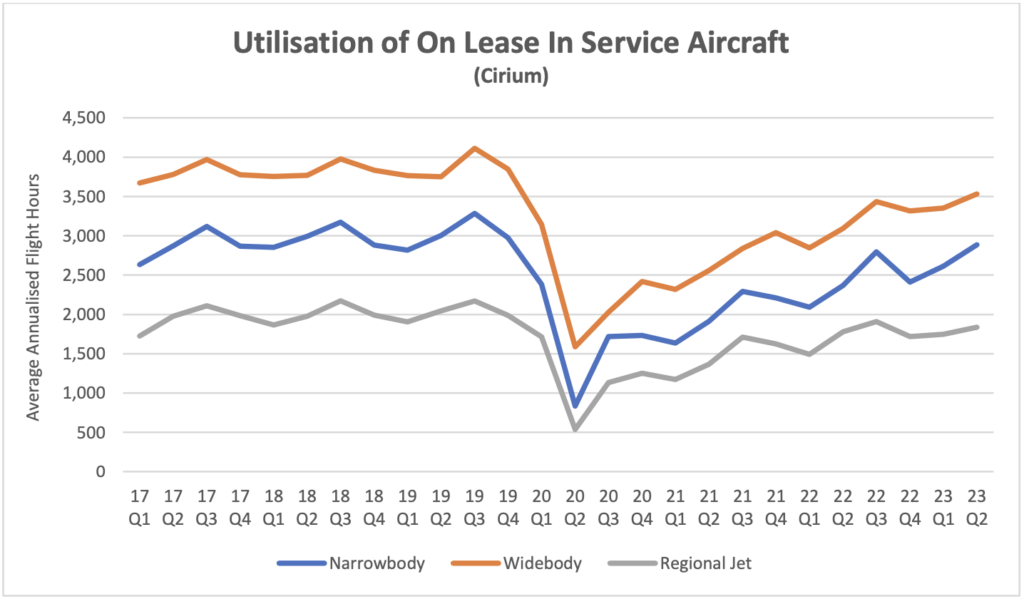
In addition to increases in off-lease aircraft there was unprecedented economic stress associated with those aircraft that remained on lease. Large numbers of leased aircraft entered storage and aircraft in service showed sharp reductions in utilisation, as shown in the charts below. The first shows off-lease and on-lease but stored aircraft relative to the total leased fleet and the second shows utilization by aircraft class for aircraft on lease and in service.
This kind of stress is clearly going to have an impact on rental income. This can arise in several ways in addition to rent deferrals which have already been discussed. When airlines are in bankruptcy protection leases can be restructured with lower rents (sometimes in return for a lease extension) and/or “power by the hour” arrangements where airlines only pay rent if the aircraft flies. From the lessor’s point of view such arrangements may be the best available option despite the concessions involved. Such arrangements may also arise if there is just the threat of bankruptcy rather than actual court proceedings.
In conclusion the aircraft leasing industry has once again demonstrated the defensive value of contracted lease income streams and a geographically diversified customer base in the most adverse of circumstances. Of the 3% reduction in net rental yield since 2019 we can account for 1% by the impact of lower debt costs and some of the rest by the impact of lease terminations and restructurings, although it is impossible to be definitive. One other factor which should be considered is the long-term impact of aggressive price competition from new entrants, particularly Chinese lessors. We expect that outcomes will vary quite significantly by lessor reflecting customer concentrations and equipment mix.
[1] The crack spread is the difference between the price of crude oil and refined products such as jet fuel.
[2] RPKs is the acronym for revenue passenger kilometres, which is the product of the number of paying passengers times distance flown.
[3] ASKs is the acronym for available seat kilometres, which is the product of the number of available seats flown times distance flown.
[4] Sirius has created the time series of aggregate aircraft leasing industry returns by based on public financial information in respect of the following companies: AerCap, Aircastle, Air Lease Corp., ALAFCO, Aviation Capital Group, Avolon, AWAS, BOC Aviation, CDB Aviation, DAE Capital, Fly Leasing, GECAS, Genesis Lease, ILFC, Intrepid/Voyager, Nordic Aviation Capital and SMBC Aviation Capital. We have excluded NAC from our calculations for 2022 because their net income includes a $2.6 BN gain on restructuring of financial liabilities and some other large one-off items.
Disclaimer
This Presentation has been made to you solely for general information purposes and is not intended to provide, and should not be relied upon for legal, tax, accounting, investment, or financial advice. This Presentation is not a sales material and does not constitute or form any part of any offer, invitation or recommendation to the recipient, its affiliates or any other person to underwrite, sell or purchase securities, assets or any other product, nor shall it or any part of it form the basis of, or be relied upon, in any way in connection with any contract or transaction decision relating to any securities, assets or any other product. None of Sirius, its affiliates or shareholders shall have any responsibility or liability to the recipient, its affiliates, shareholders or any third party in relation to this Presentation or any other document or materials prepared by Sirius or its affiliates, officers, directors, employees, advisers or agents. Sirius and its affiliates, officers, directors, employees, advisers and agents have taken all reasonable care to ensure that the information contained in this Presentation is accurate. Neither Sirius nor any of its affiliates, officers, directors, employees, advisors or agents has any obligation to update this Presentation. Under no circumstances should the delivery of this Presentation, irrespective of when it is made, create an implication that there has been no change in the affairs of the entities that are the subject of this Presentation. This Presentation may be updated and amended by a supplement and, where such supplement is prepared, this Presentation will be read and construed with such supplement. The statements herein which contain such terms as “may”, “will”, “should”, “expect”, “anticipate”, “estimate”, “intend”, “continue” or “believe” or the negatives thereof or other variations thereon or comparable terminology are forward-looking statements and not historical facts. No representation or warranty, express or implied, is made as to the fairness, accuracy or completeness of such statements, estimates and projections. The recipient should not place reliance on any forward-looking statements. Neither Sirius nor its affiliates undertakes any obligation to update or revise the forward-looking statements contained in this Presentation to reflect events or circumstances occurring after the date of this Presentation or to reflect the occurrence of anticipated events. The information set out in this Presentation has been prepared by Sirius based upon various methodologies and calculations which it believes to be reasonable and appropriate. Past performance cannot be a guide to future performance. In preparing this Presentation, Sirius has relied upon and assumed, without independent verification, the accuracy and completeness of all information available from public sources or which was provided to it or otherwise reviewed by it. This Presentation supersedes and replaces any other information provided by Sirius or its affiliates, officers, directors, employees, advisers or agents in respect of the content of the Presentation. No information or advice contained in this Presentation shall constitute advice to an existing or prospective investor in respect of his personal position. None of Sirius, its affiliates, its or its affiliates’ officers, directors, employees or advisers, connected persons or any other person accepts any liability whatsoever for any loss howsoever arising, directly or indirectly, from this Presentation or its contents.