- Special Topic – Traffic Growth Outlook
- Macro-Economic Background
- Traffic and Aircraft Demand
- New Aircraft Supply
- Airline Industry Financial Performance
Traffic Growth Outlook
As discussed below the industry has recovered, if we are happy to define recovery as traffic exceeding 2019 levels. However, this does beg the question of whether 2019 traffic is the appropriate benchmark for recovery.
When the pandemic hit both Airbus and Boeing made significant adjustments to their annual 20-year industry forecasts. In the chart below we compare Boeing’s forecast of global RPKs[1] in 2038 published in 2019 with our estimates of the comparable number for forecasts published in subsequent years (we estimate the figures for the following years by interpolating between Boeing’s 10 and 20 RPK forecasts). Boeing’s forecast effectively reduced by 10% after the onset of the pandemic and has stayed there since. Our analysis of the comparable Airbus forecasts suggest they did something very similar, but presenting this would require a lot more estimates on our part and we prefer not to go there.
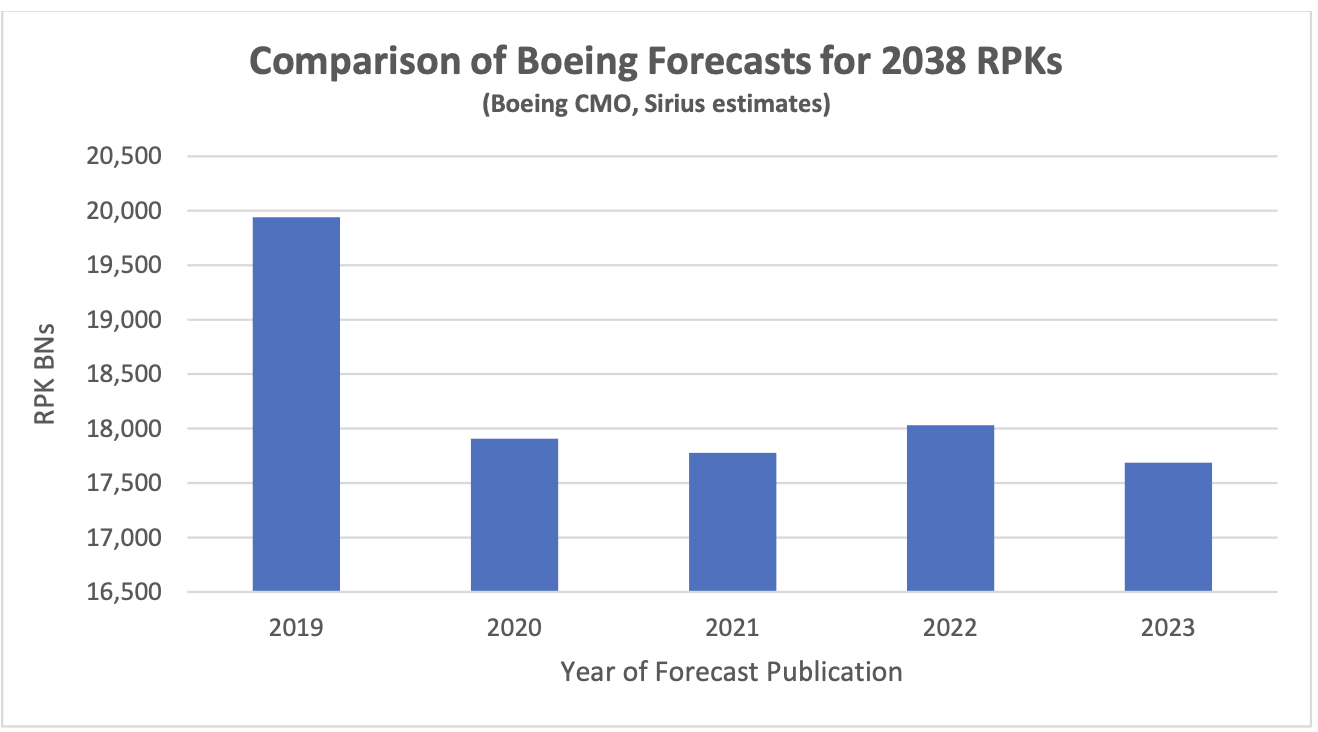
A 10% reduction in long-term RPK growth is a lot more than would be justified by the 2.0-2.5% reduction in world GDP growth caused by the pandemic as the historic RPK/GDP growth multiple is less than 2X. One possible justification for a more conservative approach is that traffic growth was very strong in the latter years of the 2010s so that basing a forecast on cyclical high point would be biased upwards. However, this would not necessarily be correct if this high growth period was partly or wholly offsetting an earlier period of low growth.
A more systematic approach is to create a model of RPK growth which can compare actual with expected RPKs. An analysis of historic traffic data in “normal” times shows that world GDP growth and changes in the real cost of air travel, as measured by constant $ yield[2], provide a very strong explanation of growth in RPKs (a regression analysis on this data for the period 1970-2019 gives an adjusted R-squared of 0.998).
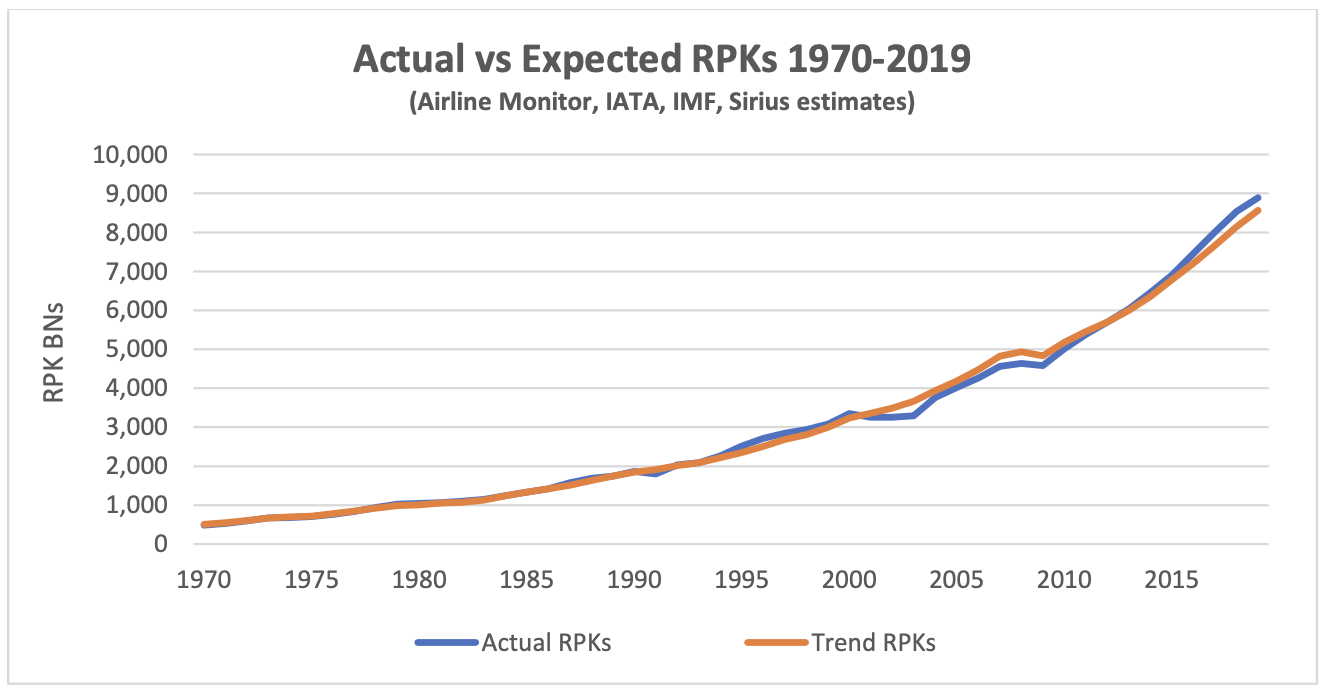
This analysis shows that RPKs were indeed above trend in the 2010s. This was not unprecedented as there was a similar phenomenon in the late 1990s, and it is also striking to note the prolonged period of weak growth in the 2000s.
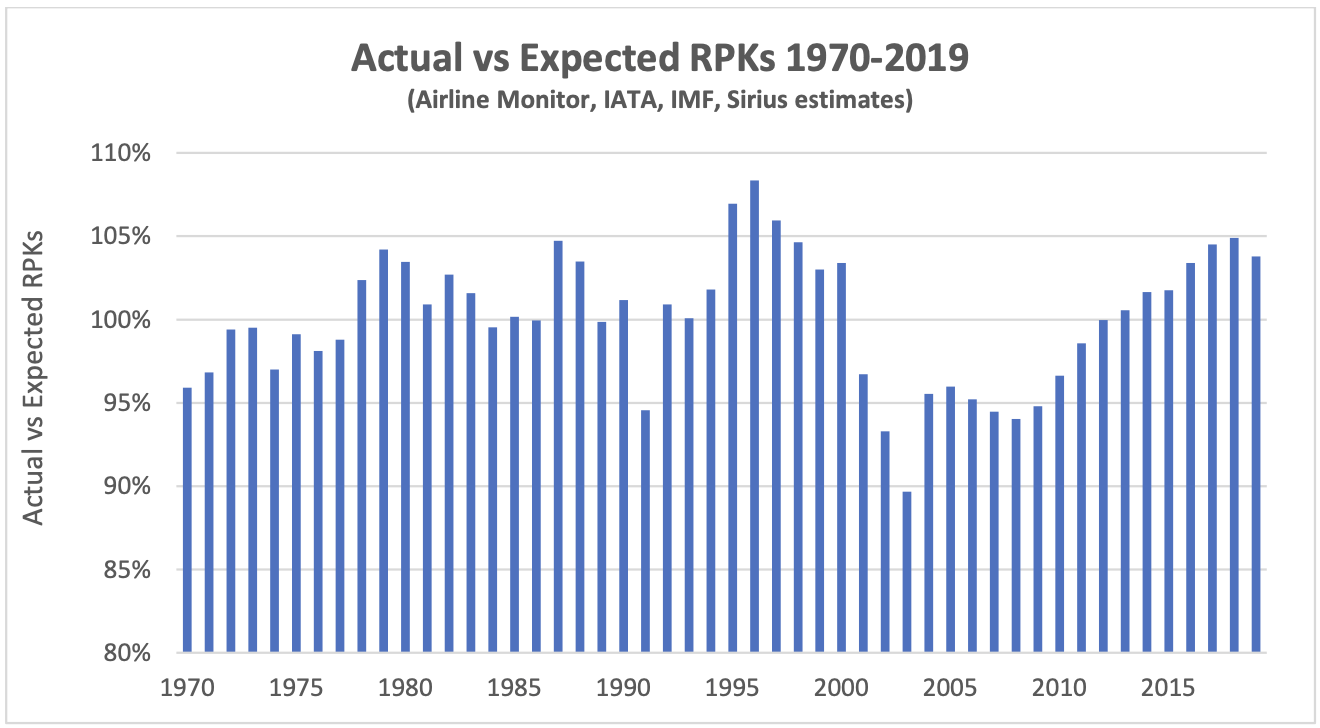
Another way of looking at same data is to chart the ratio of actual to expected RPKs as in the chart below. This demonstrates that the strong traffic levels of the 2010s were in line with previous up-cycles. Based on this analysis the reduction in the OEMs RPK forecasts is reasonable. In 2019 actual RPKs were 4% above trend and there is a case for a 4-5% reduction based on “lost” GDP growth.
It’s also interesting to consider what this analysis suggests about where the market is right now. We have rolled the model forward to 2024 based on IATA’s traffic and yield forecasts and the IMF’s world GDP forecast.
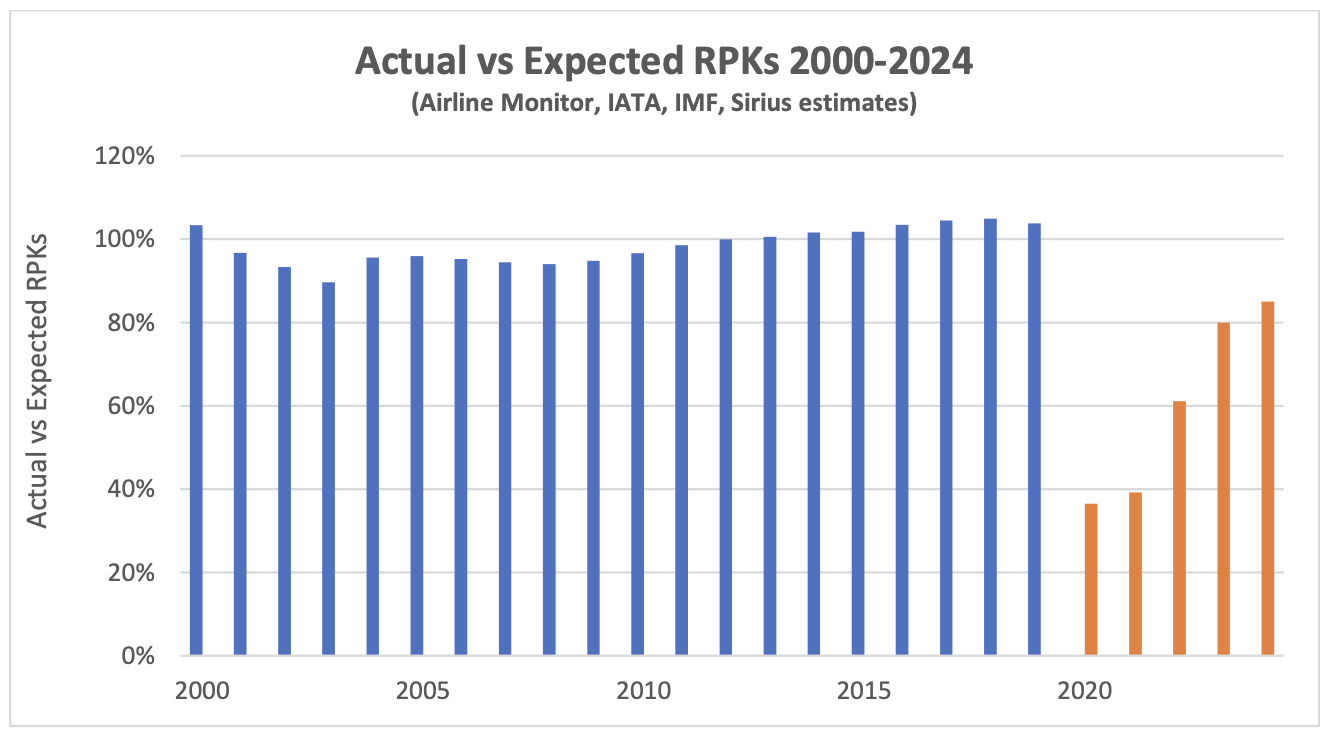
Based on this approach actual 2024 RPKs will only be 85% of expected, compared to 93% in 2002 (in the aftermath of 9/11). Obviously, the world may have permanently changed, but based on history there is scope for significant further traffic recovery in 2025 and beyond.
One factor that may obstruct this is a shortage of new aircraft. This may also have been part of the weak traffic performance in the 2000s, when new passenger aircraft deliveries did not surpass their previous peak of 1,191 in 2001 until 2012. If this happens then pent-up demand may find an outlet in higher ticket prices.
Macro-Economic Background
Having said in our last market update that we would focus more on the outlook for GDP the IMF confounded this goal by publishing a significant revision to their numbers for 2020 and 2021. These changes mean that the “permanent” loss of GDP growth which we estimated at 2.5-3.0% should be revised down to 2.0-2.5%.

Economic growth is a key driver of long-term growth of air travel. However, since early 2022 its impact has been overshadowed by the fall and recovery in traffic associated with the pandemic. As recovery is largely complete the influence of overall economic conditions on air travel is likely to reassert itself.
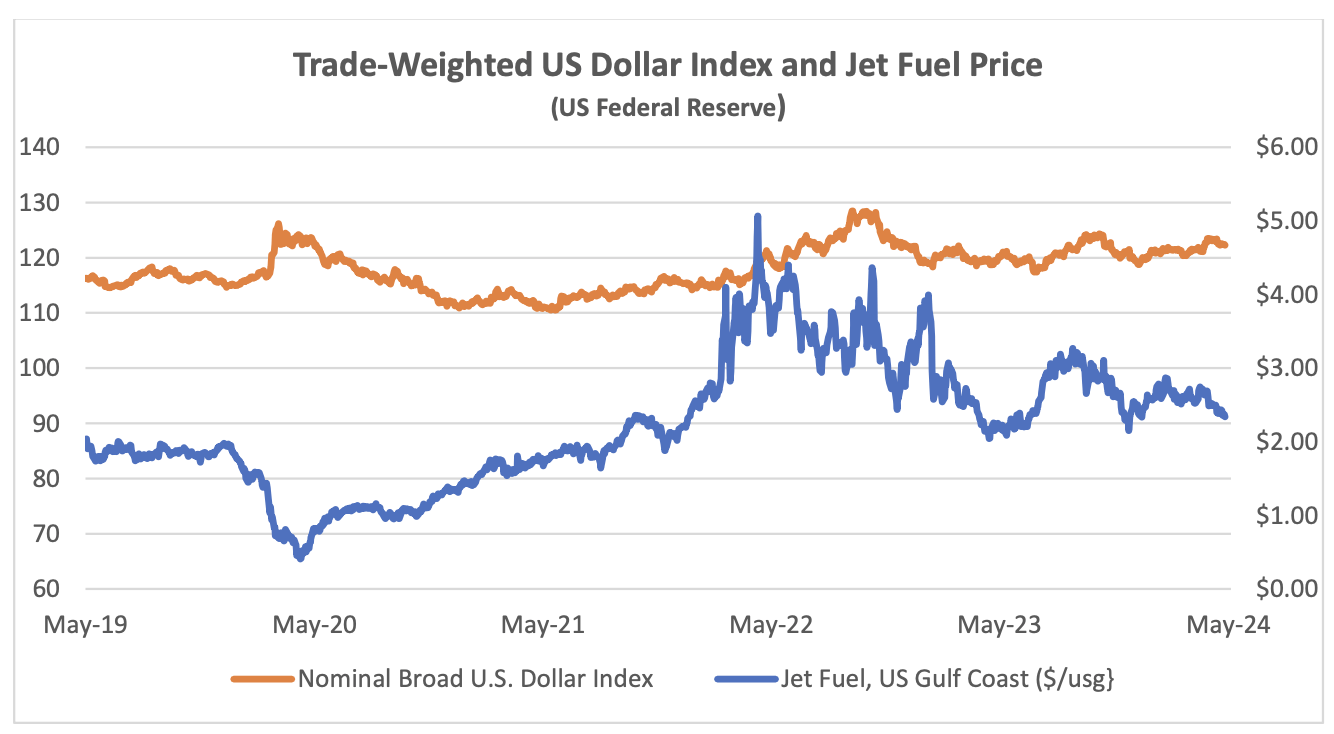
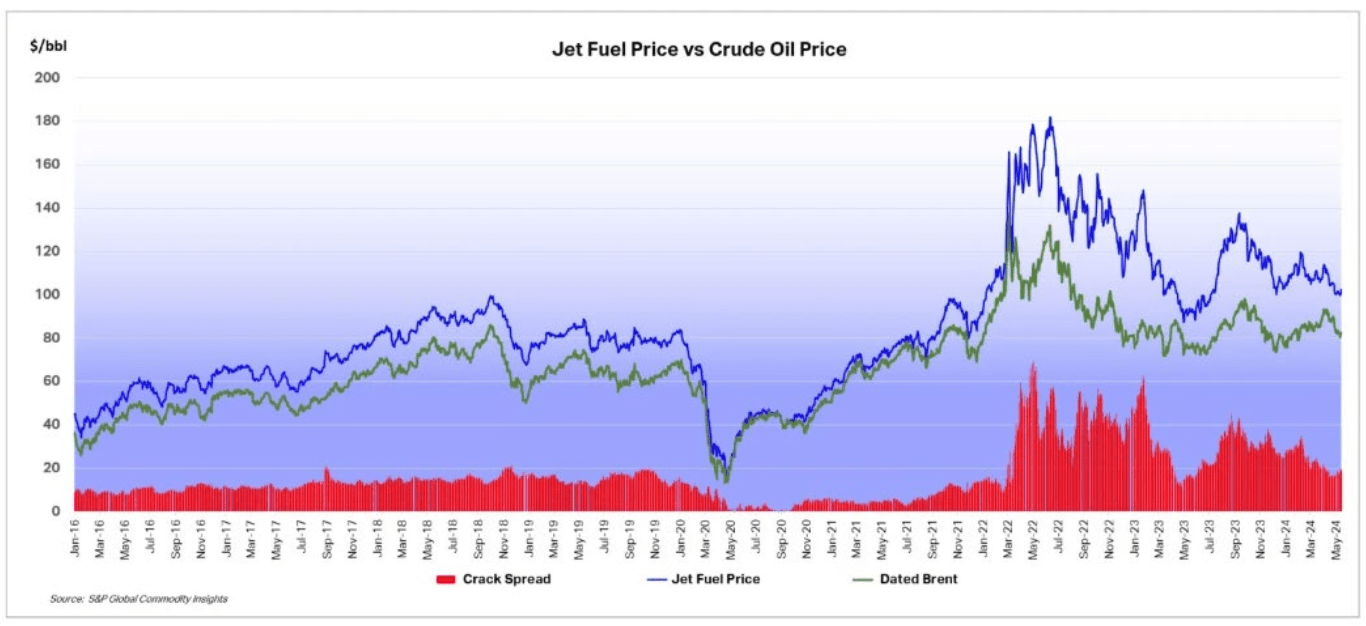
The US Dollar has weakened since its recent peak in September 2022, providing relief for airlines outside the US for dollar-denominated costs such as fuel, aircraft rents and aircraft spares. The price of jet fuel has remained volatile, but it has moderated since February 2024. This reduction has mainly been driven by a $10 reduction in the “crack spread” from c.$30 to c.$20.
Another indicator that is potentially important to aircraft investors is the breakeven inflation rate on US Treasury Inflation-Protected Securities (TIPS). This indicator measures inflation expectations and it matters because used aircraft values are strongly influenced by the cost of new aircraft and over time this cost is linked to US Dollar inflation. In the short term this linkage is driven by escalation clauses in aircraft purchase contracts and in the long term by the general input cost environment for the aircraft manufacturers. The chart below compares the breakeven rate for 10-year and 5-year TIPS.
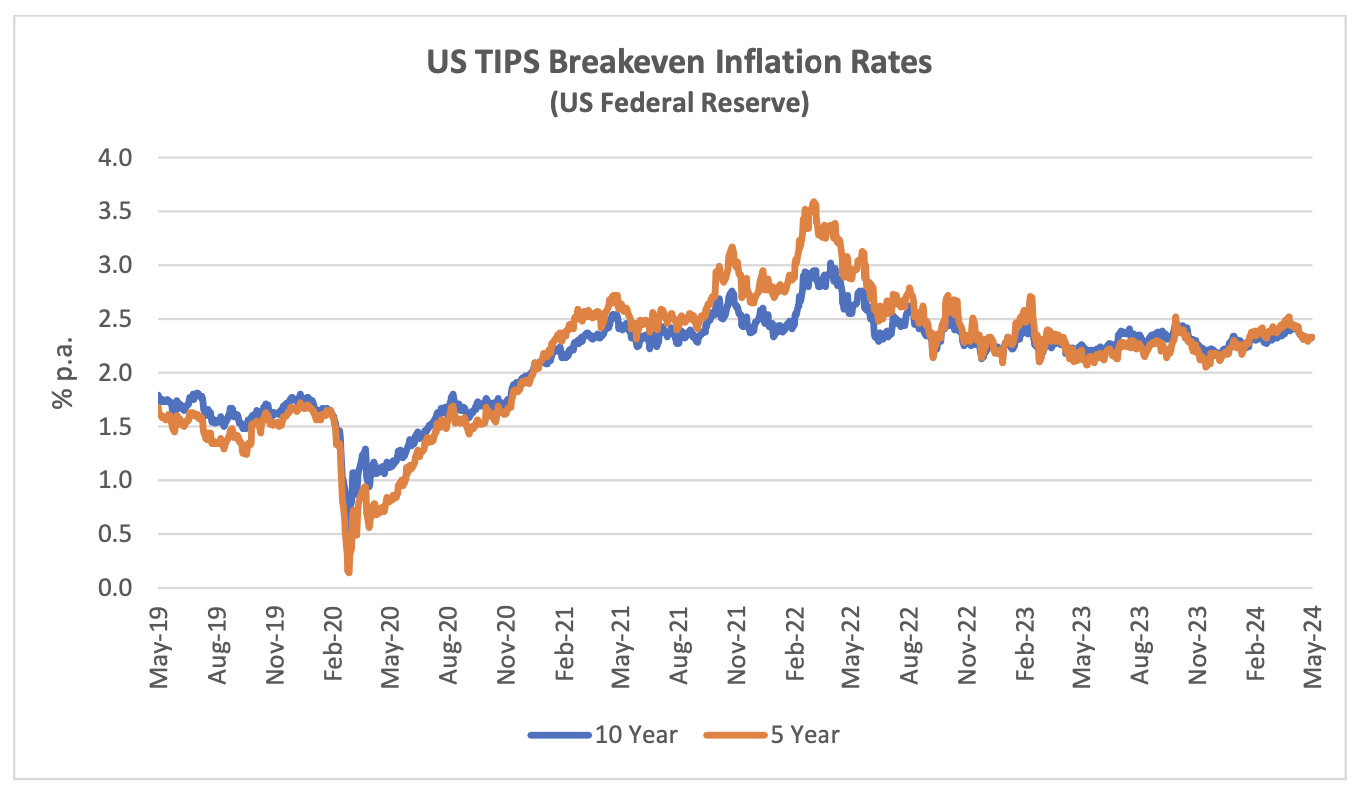
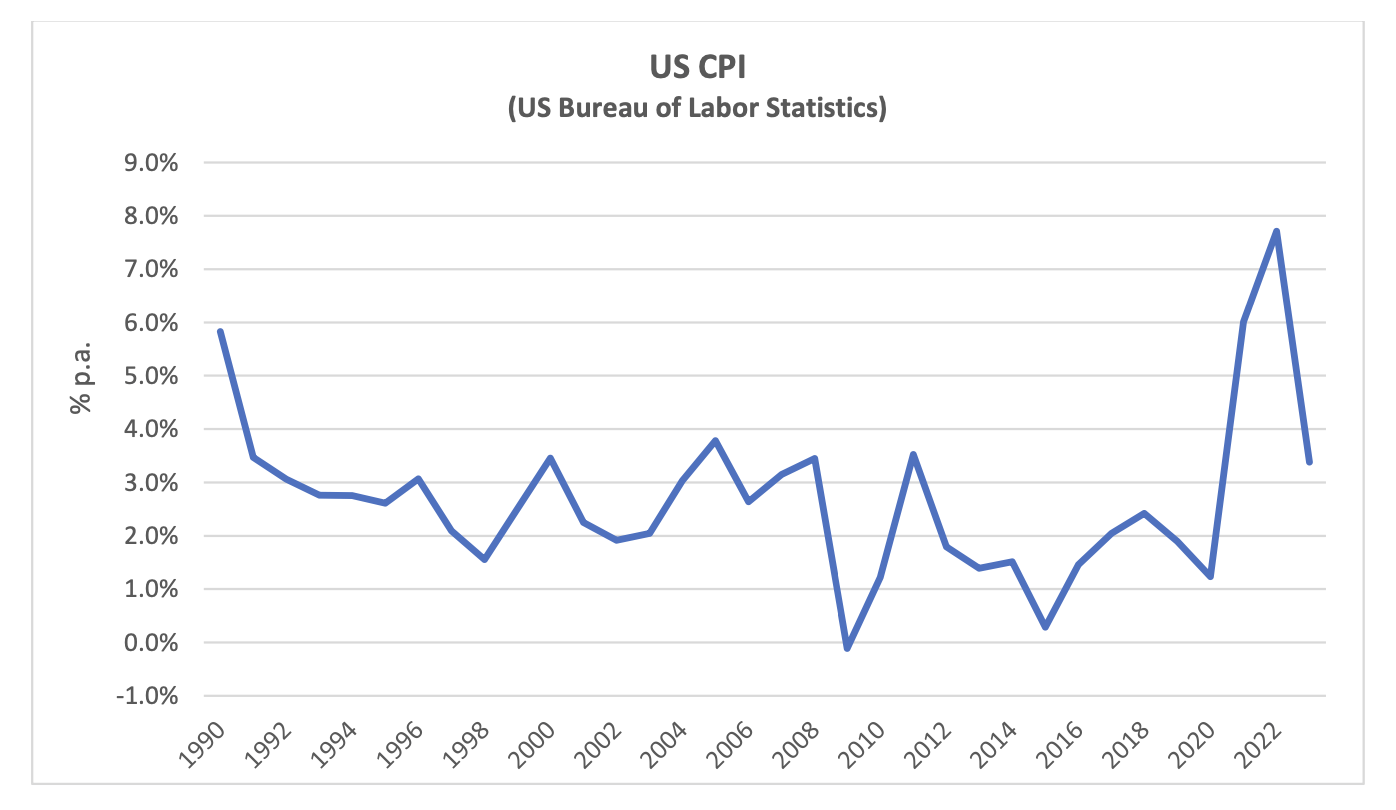
Although medium or long-term inflation expectations have never gone higher than 3.5%, actual inflation experience has been much higher in the last few years. This has led to higher appraised values for new aircraft.
Traffic and Aircraft Demand
Global Air Passengers, RPK Billions per Month
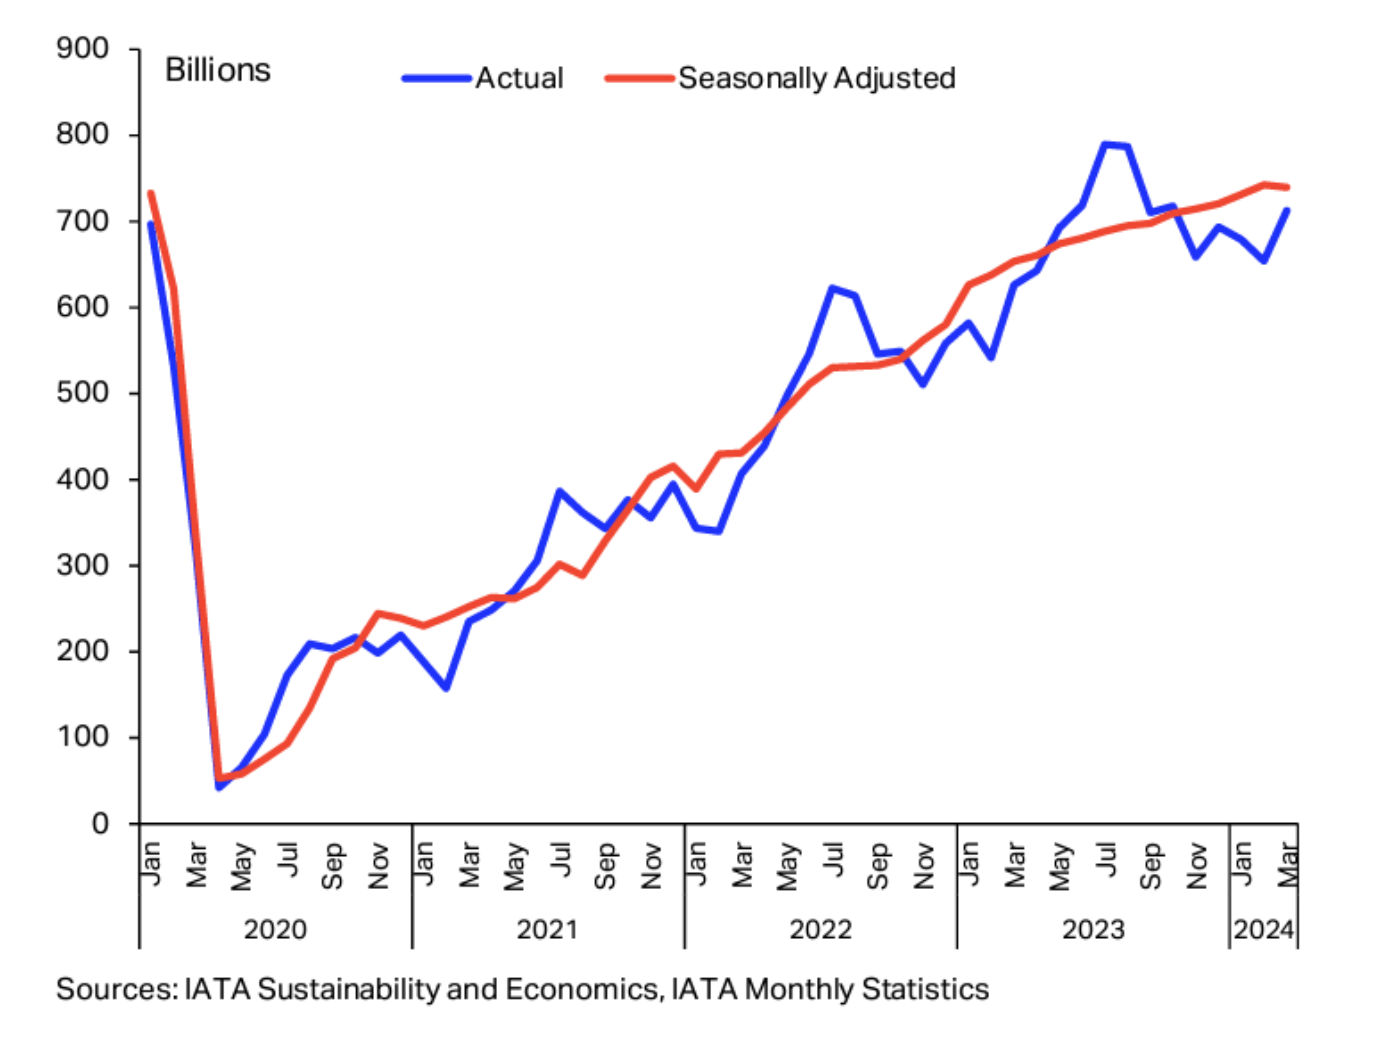
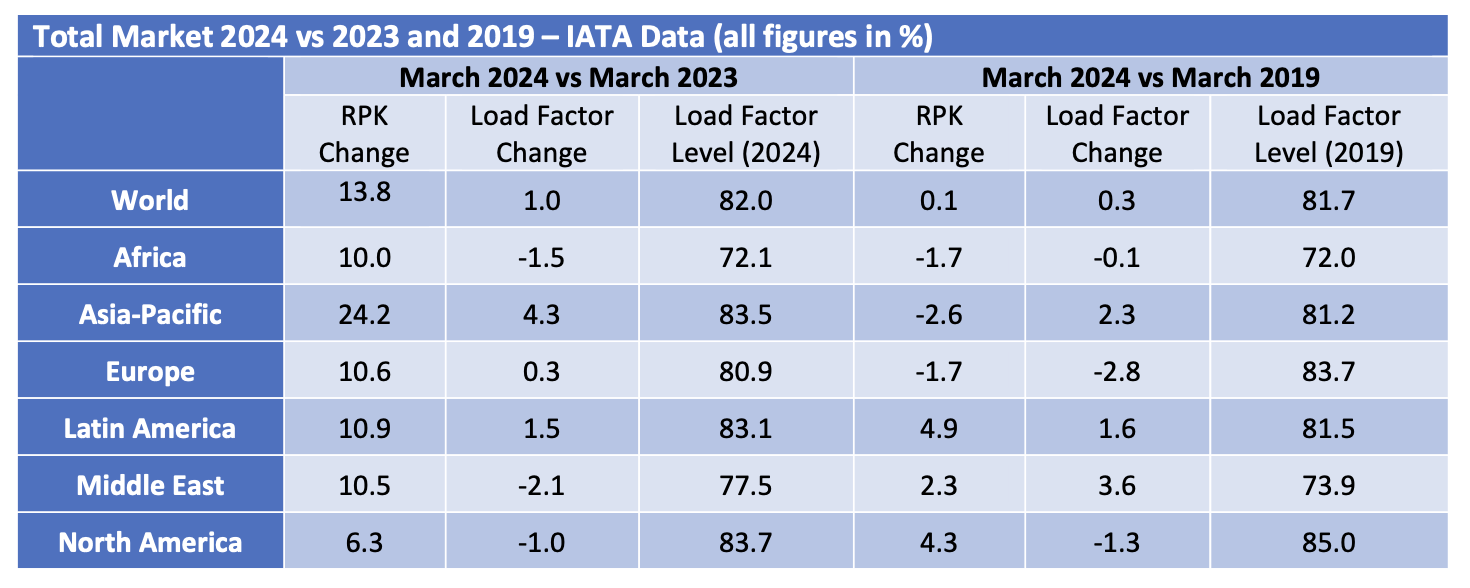
March 2024 RPKs were 0.1% higher than in March 2019, so recovery is official! Also, no region was more than 5% higher or lower than in 2019 so most of the extreme disparities in terms of recovery have worked their way out of the system.
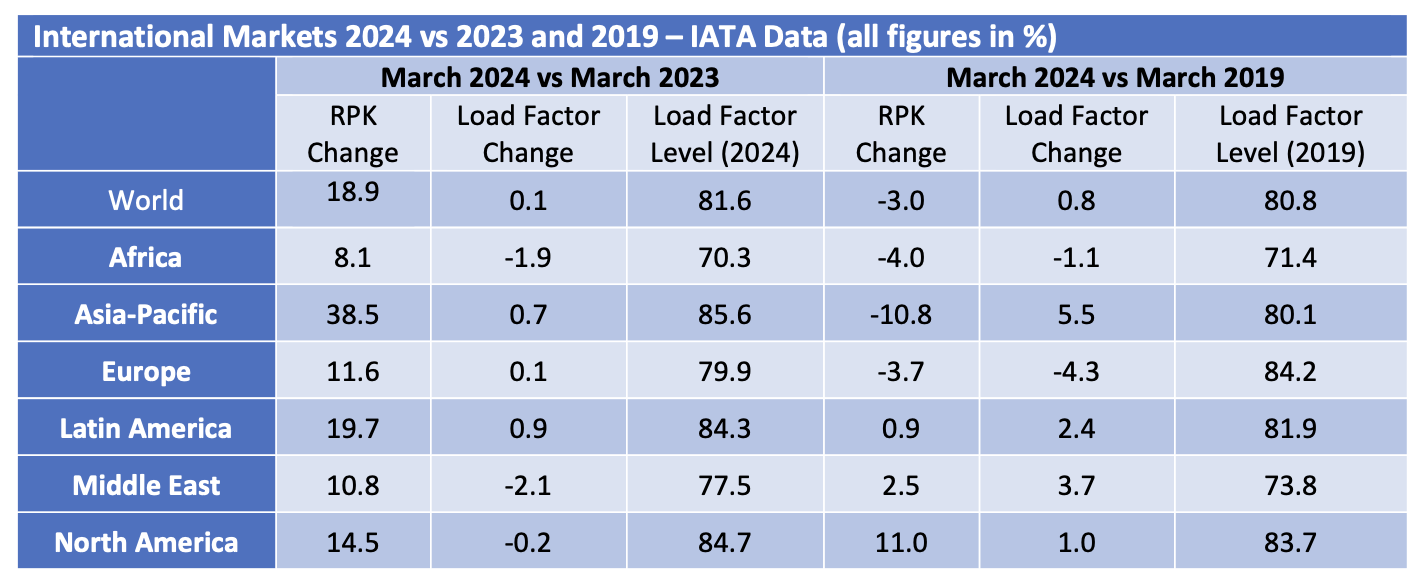
International traffic recovery still lags domestic and shows greater variation by region, with Asia-Pacific conspicuously weaker than in 2019 and North America much stronger. It is striking that North American international RPKs are 11.0% higher than in 2019 vs only a 1.5% increase for domestic US RPKs: domestic traffic across the Americas was the quickest major market to recover after 2020 so it is tempting to assume that all is well, but markets such as the US are relatively mature limiting long-term growth potential.
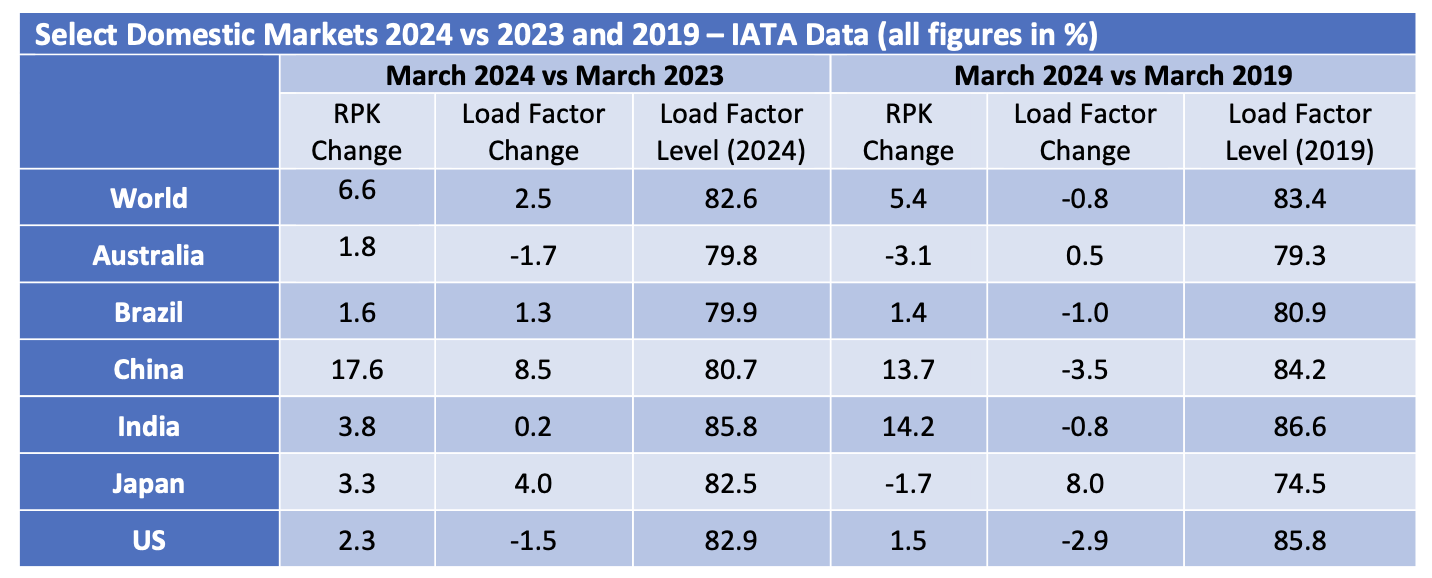
The key markets driving domestic traffic volumes growth are China and India which as emerging markets with very large populations are vital to the aviation industry long-run fortunes.
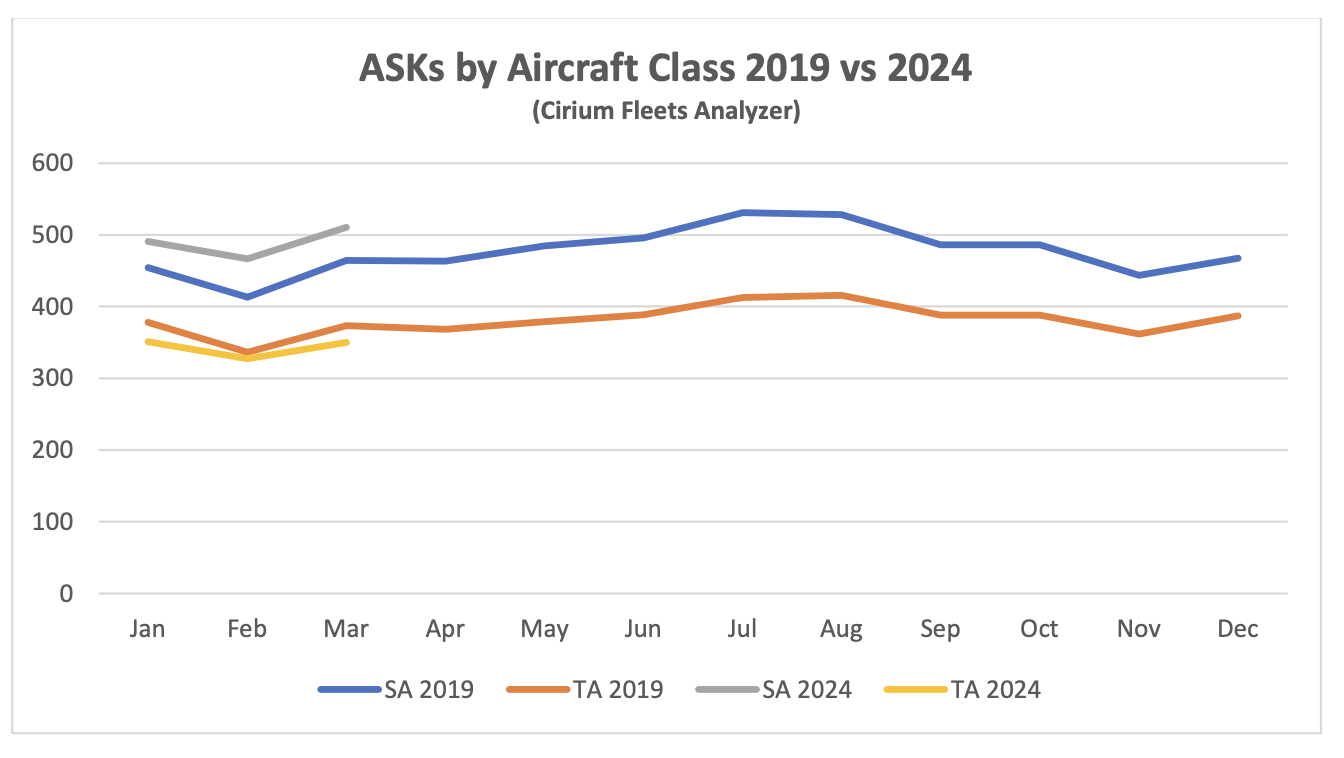
Although some short-haul aircraft serve international routes nearly all long-haul aircraft do so, and this is reflected in the relative demand for single-aisle (narrowbody) and twin-aisle (widebody) aircraft. Aircraft demand can be measured in terms of aircraft in service and ASKs[3], the standard measure of aircraft capacity deployed by airlines which indicates how intensively aircraft are being flown. Single aisle aircraft demand on both metrics is higher so far in 2024 than in 2019 whereas twin-aisle aircraft are marginally weaker by aircraft in service and lagging more in terms of ASKs. The difference between the two metrics may be down to the gradual move away from very large aircraft such as the B747 and A380 towards the smaller B787 and nA350, resulting in fewer ASKs per aircraft unit.
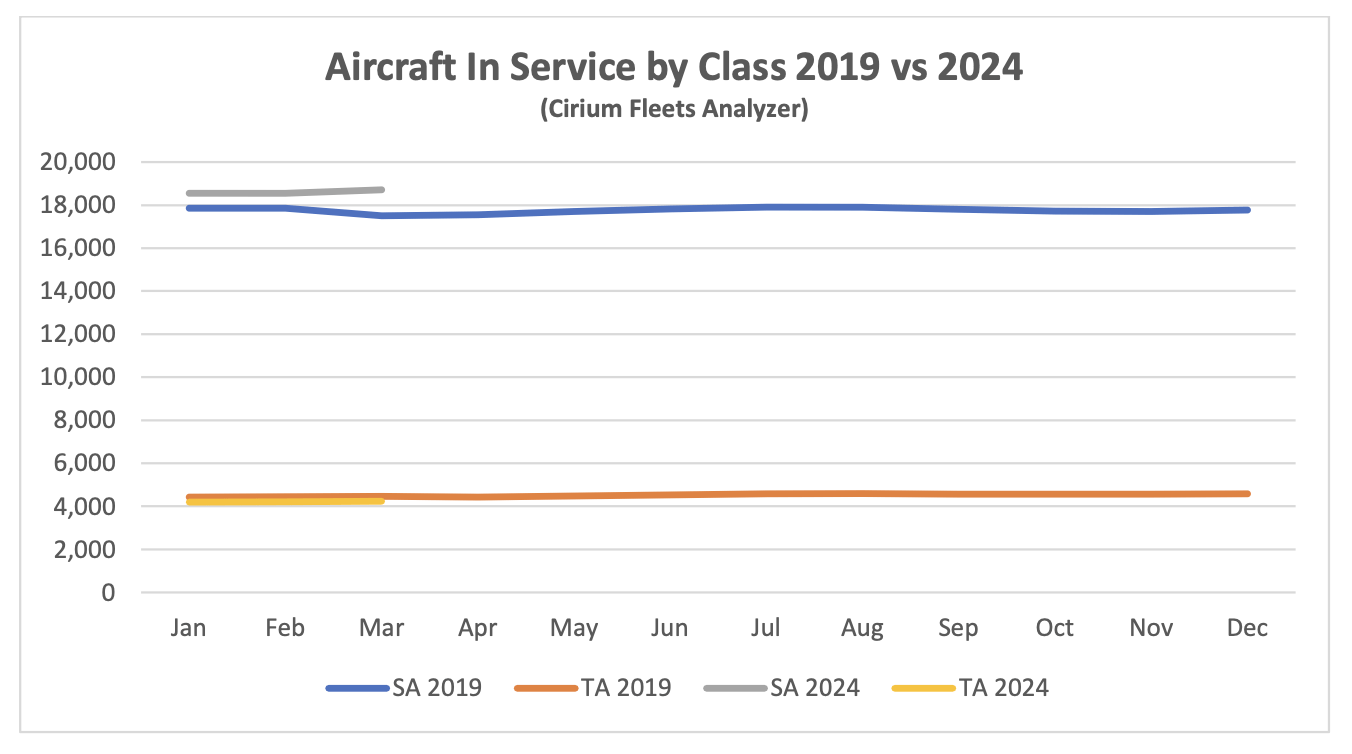
It is hard to see the TA 2024 data series because it is only very marginally lower than TA 2019.
New Aircraft Supply

IN contrast to 2022 Airbus exceeded its delivery guidance of 720 aircraft in 2023. Management is guiding total deliveries of 800 aircraft for 2024 with most of the increase likely to come from the A320 family. The latest status of Airbus’s production plans is:

The only significant production target not captured in the table above is the objective to raise A320 family production to 75 per month by 2026.

The latest status of Boeing’s production plans is:

The Alaska Airlines B737-9 incident in January has once again created significant uncertainty around Boeing’s ability to increase production of the Max. The FAA is investigating Boeing’s quality control systems and other related matters and has announced that it will not approve any increases in production until it is satisfied with Boeing’s level of compliance. Boeing has also announced that it will not seek certification of the B737-7 and -10 variants until it has engineering solutions for the engine inlet overheating issue resulting from extended engine anti-Ice operation in dry air. There is no definite timeframe to resolve this issue.
B737 inventory decreased from 175 at the end of 2023 to 110 at the end of Q1 2024, including 70 B737-8 aircraft due to be delivered to Chinese airlines which must be approved and accepted by the Chinese aviation regulator the CAAC. The 110 number above only includes aircraft manufactured before the start of 2024, suggesting that nearly all the B737s delivered in Q1 2024 were from inventory as the reduction of 65 compares to 67 aircraft delivered in the quarter. (Currently, China’s 13 domestic carriers operate 97 B737 MAX planes in their fleet. China Southern, Air China and Hainan Airlines have 24, 16 and 11 aircraft, respectively. Shanghai Airlines, Xiamen Airlines and Shandong Airlines are also B737 MAX operators.
As with the Max Boeing holds a significant inventory of undelivered B787 aircraft, c.40 at the end of Q1 vs c.50 at the end of 2023. Boeing has said it expects to deliver most of them in 2024. The inventory reduction of 10 aircraft compares with 13 total deliveries, suggesting that both B737 and B787 production is being severely disrupted. Boeing has not provided any delivery guidance for 2024.
COMAC of China achieved a significant increase in ARJ 21 deliveries and Embraer was in line with 2023.
Airline Industry Financial Performance
IATA released a new airline industry financial forecast in June 2024 as part of its semi-annual Global Outlook for Air Transport. The table below compares key forecast outputs for 2024 with IATA’s previous forecast published in December 2023.

The new forecast does not show a big change in RPKs or key costs such as jet fuel, but the yield, revenue and profitability outlook is significantly better.
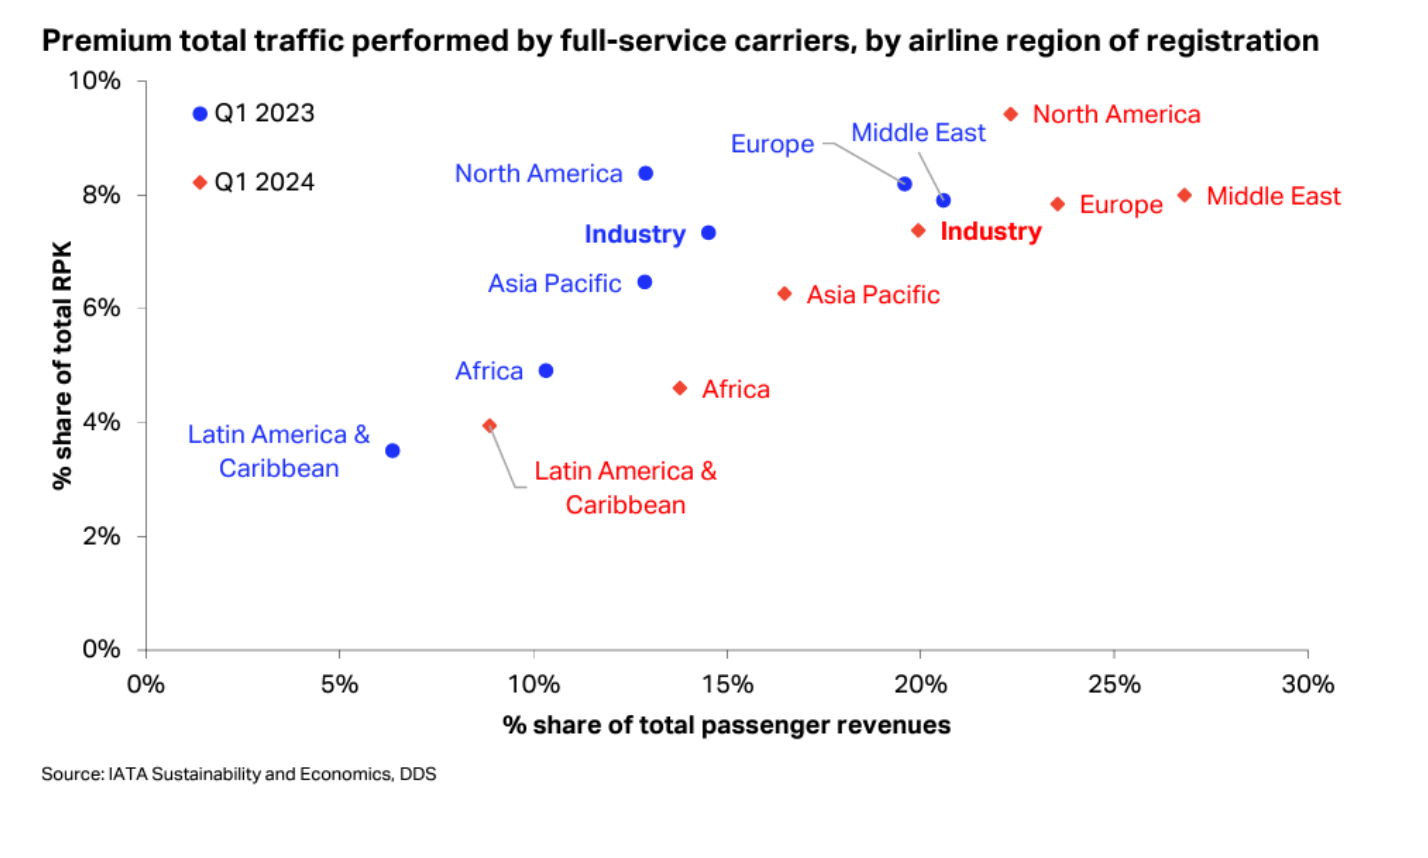 One development with a potentially important impact on 2024 airline profits is a recovery in the price of business and first-class travel. Although Q1 2024 share of RPKs was in line with typical historic levels at around 7% share of revenues increased from a historically low 15% to a more “normal” 20%. This will help the bottom line of the network airlines rather than low-cost airlines with very limited, if any, premium cabin offering.
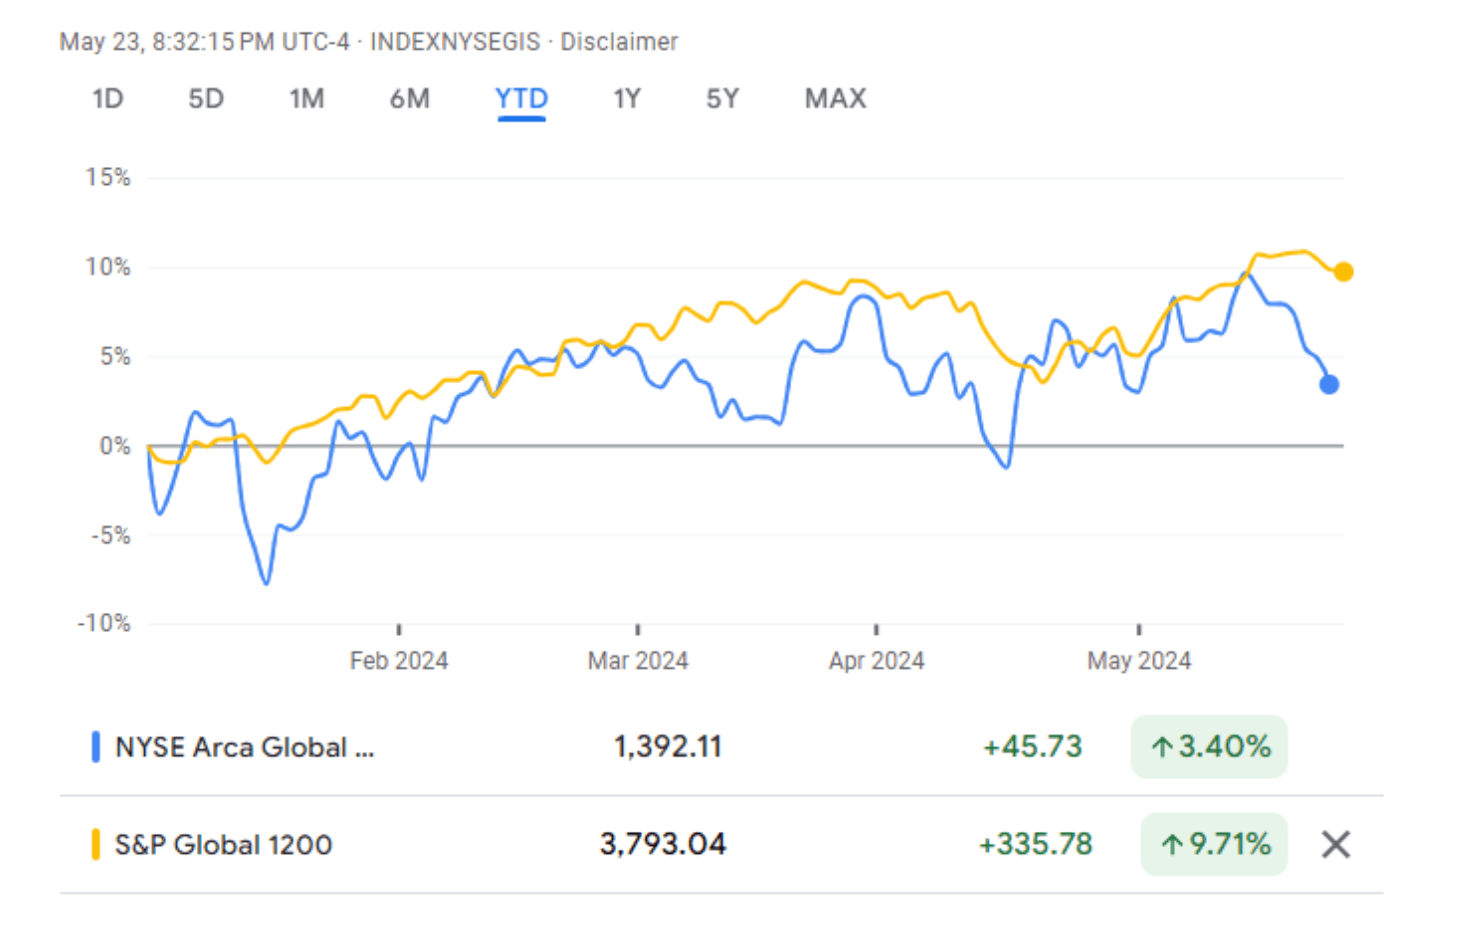
Since the start of 2024 airline share prices have shown persistent, albeit limited, downside volatility relative to the overall stock market.
NYSE Arca Global Airline Index vs S&P Global 1200 Index (Google Finance)
GOL of Brazil files for US bankruptcy protection in January. This was not a major surprise as GOL’s major competitors Aviance and LATAM had already done so during the pandemic and GOL had engaged in significant financial restructuring in the same timeframe.
The second largest airline by equipment value to fail is Lynx Air of Canada with a fleet including 9 X B373-8s. Lynx filed for bankruptcy protection in February, citing rising operating costs, high fuel prices, increasing airport charges, and a difficult economic and regulatory environment. Lynx was a low-cost airline that started operations in 2022 and some or all its problems are shared by most low-cost North American carriers up to and including Southwest Airlines, which have not benefitted from the strength of North American international traffic in the same way as the network airlines.
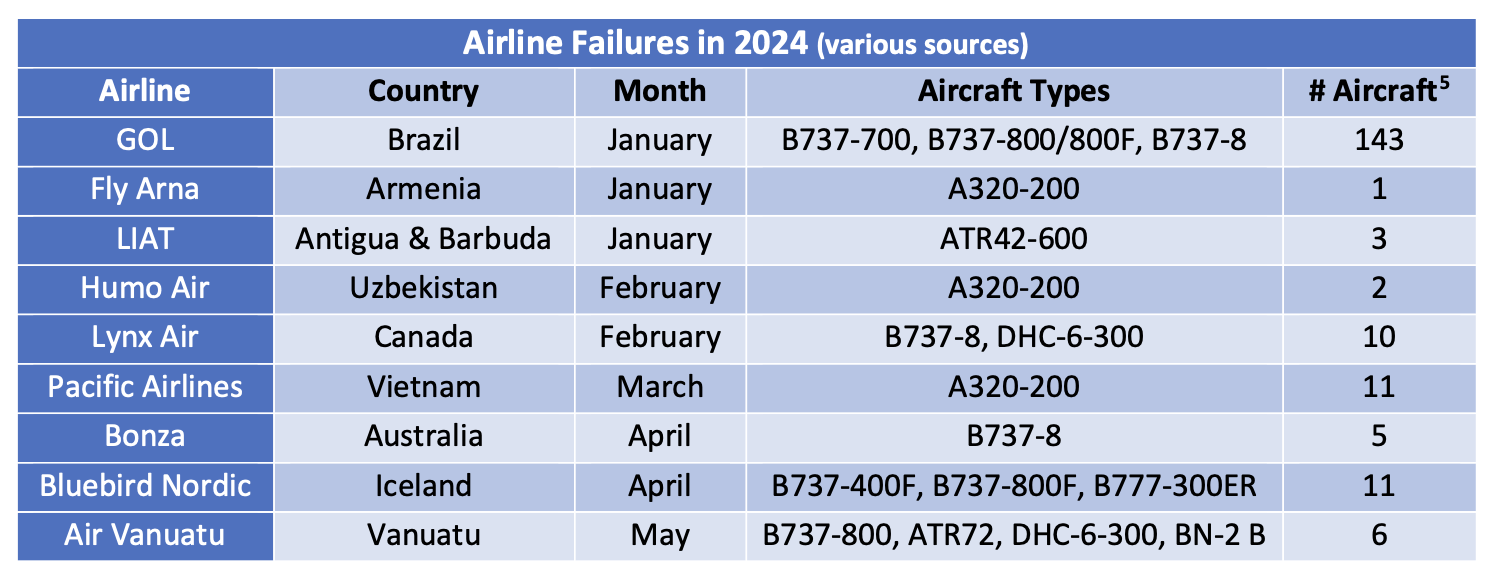 Sometimes airline financial distress comes in shades of grey rather than black and white. Although Pacific Airlines has ceased operations it has declared its intention to restart, and SpiceJet of India (43 aircraft) has suffered several adverse court judgments although it remains in business.
[1] RPKs is the acronym for revenue passenger kilometres, which is the product of the number of paying passengers times distance flown.
[2] Yield is total passenger revenue divided by total industry RPKs.
[3] ASKs is the acronym for available seat kilometres, which is the product of the number of available seats flown times distance flown.
[4]Airbus normally quotes its production rates based on an 11.5-month year for single-aisle aircraft.
[5]Fleet numbers are as of December 31st, 2023.
Disclaimer
This Presentation has been made to you solely for general information purposes and is not intended to provide, and should not be relied upon for legal, tax, accounting, investment, or financial advice. This Presentation is not a sales material and does not constitute or form any part of any offer, invitation or recommendation to the recipient, its affiliates or any other person to underwrite, sell or purchase securities, assets or any other product, nor shall it or any part of it form the basis of, or be relied upon, in any way in connection with any contract or transaction decision relating to any securities, assets or any other product. None of Sirius, its affiliates or shareholders shall have any responsibility or liability to the recipient, its affiliates, shareholders or any third party in relation to this Presentation or any other document or materials prepared by Sirius or its affiliates, officers, directors, employees, advisers, or agents. Sirius and its affiliates, officers, directors, employees, advisers, and agents have taken all reasonable care to ensure that the information contained in this Presentation is accurate. Neither Sirius nor any of its affiliates, officers, directors, employees, advisors, or agents has any obligation to update this Presentation. Under no circumstances should the delivery of this Presentation, irrespective of when it is made, create an implication that there has been no change in the affairs of the entities that are the subject of this Presentation. This Presentation may be updated and amended by a supplement and, where such supplement is prepared, this Presentation will be read and construed with such supplement. The statements herein which contain such terms as “may”, “will”, “should”, “expect”, “anticipate”, “estimate”, “intend”, “continue” or “believe” or the negatives thereof or other variations thereon or comparable terminology are forward-looking statements and not historical facts. No representation or warranty, express or implied, is made as to the fairness, accuracy, or completeness of such statements, estimates and projections. The recipient should not place reliance on any forward-looking statements. Neither Sirius nor its affiliates undertake any obligation to update or revise the forward-looking statements contained in this Presentation to reflect events or circumstances occurring after the date of this Presentation or to reflect the occurrence of anticipated events. The information set out in this Presentation has been prepared by Sirius based upon various methodologies and calculations which it believes to be reasonable and appropriate. Past performance cannot be a guide to future performance. In preparing this Presentation, Sirius has relied upon and assumed, without independent verification, the accuracy and completeness of all information available from public sources or which was provided to it or otherwise reviewed by it. This Presentation supersedes and replaces any other information provided by Sirius or its affiliates, officers, directors, employees, advisers, or agents in respect of the content of the Presentation. No information or advice contained in this Presentation shall constitute advice to an existing or prospective investor in respect of his personal position. None of Sirius, its affiliates, or its affiliates’ officers, directors, employees or advisers, connected persons or any other person accepts any liability whatsoever for any loss howsoever arising, directly or indirectly, from this Presentation or its contents.
