
- SPECIAL TOPIC – New Aircraft Pricing
- Macro-Economic Background
- Traffic and Aircraft Demand
- New Aircraft Supply
- Airline Industry Financial Performance
New Aircraft Pricing Update
Although Sirius specialises in mid-life aircraft we do our best to keep up with developments in new aircraft pricing, not least because our proprietary analysis suggests that replacement cost and age are by far the most important drivers of used aircraft values. In our Q2 2022 Industry Update we did a deep dive into the structure of new aircraft purchase contracts which you can link to here. This time we want to bring our commentary up to date and to present a new analysis of revenues per seat for Airbus and Boeing which we believe shows a very significant increase in replacement costs since the late 2010s.
Purchases of new aircraft involve deliveries over an extended period after the contract date. The average gap between contract and delivery date has been increasing since the late 2000s and is now twice as long as six years as the typical three-year level of the previous 20 years. Boeing’s specific problems with 737 Max, 777X and 787 development and production and the supply chain challenges it shares with Airbus cannot be the only reasons for this change as these did not really arise until 2019.
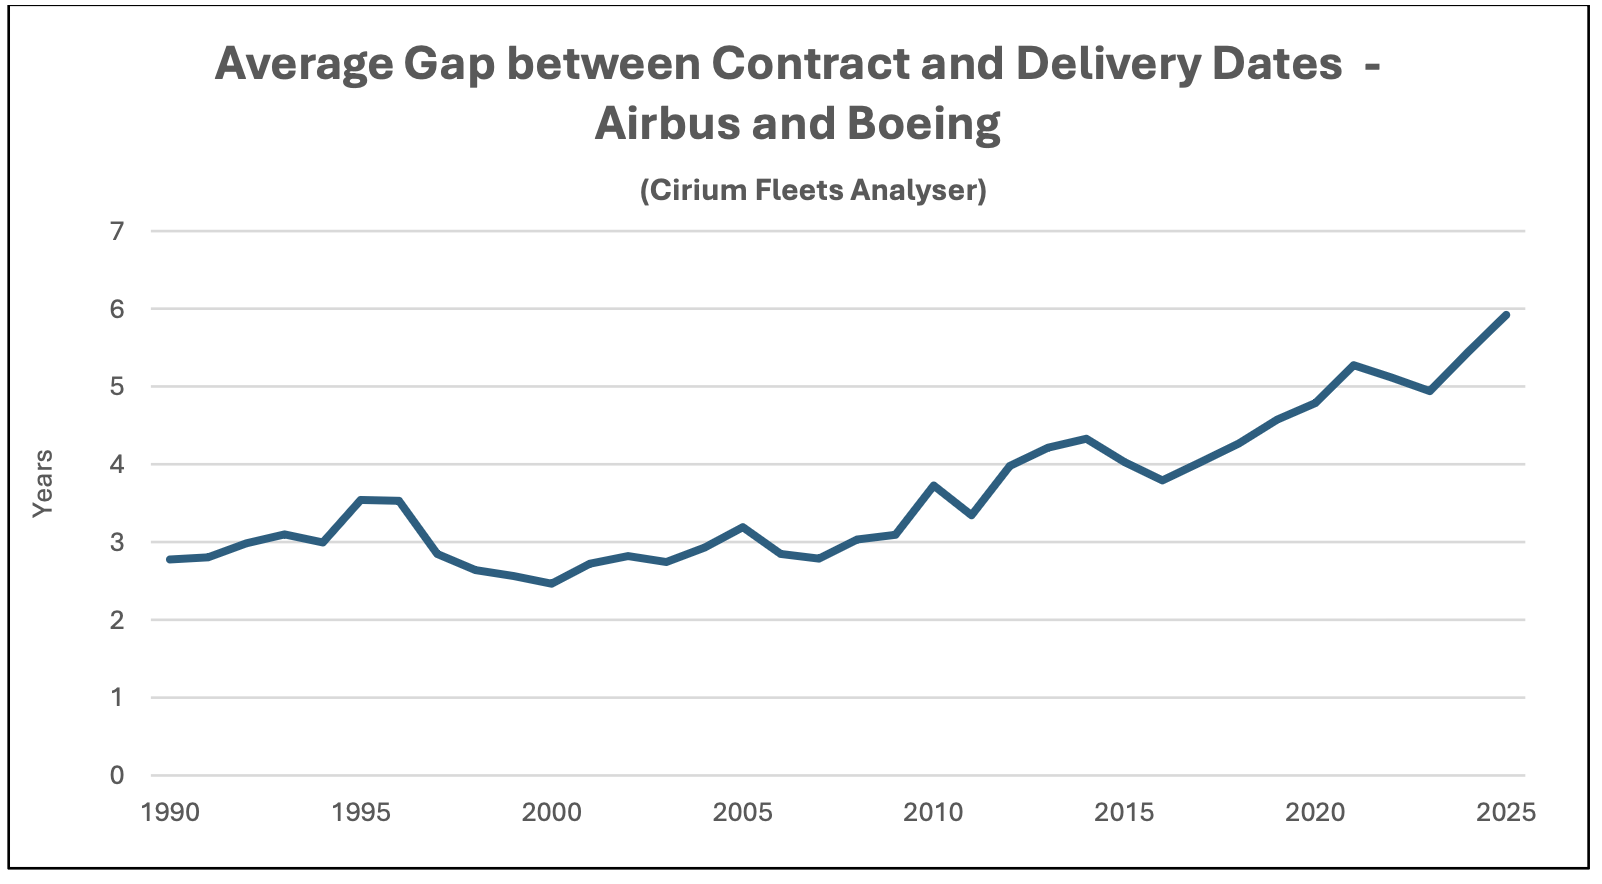
Part of the answer is almost certainly the introduction of the practice of “overbooking” delivery slots, first by Airbus and then also by Boeing. This happened because over time more attractive sale opportunities for both OEMs have involved customers with higher levels of performance risk than the large network airlines, such as recently established LCCs. In these circumstances it made sense to assume some customers would not take delivery, but if this had been correct the gap between order and delivery dates would not have increased. In these circumstances it should be logical to increase production, but this is psychologically difficult since it would mean “doubling down” on riskier customers. It has proved easier to stretch out the backlog even before production challenges started to arise.
One of the side-effects of this development has been an increase in the period for which a new aircraft’s base price is escalated. The base price is set at the contract date, and escalation is typically based on a blend of US inflation indices reflecting changes in wages and industrial materials[1]. Over a long period, our example of a typical escalation index is slightly ahead of the US CPI and significantly ahead of our proprietary estimates of actual aircraft inflation i.e. the change in prices of new aircraft weighted by total new aircraft revenues.
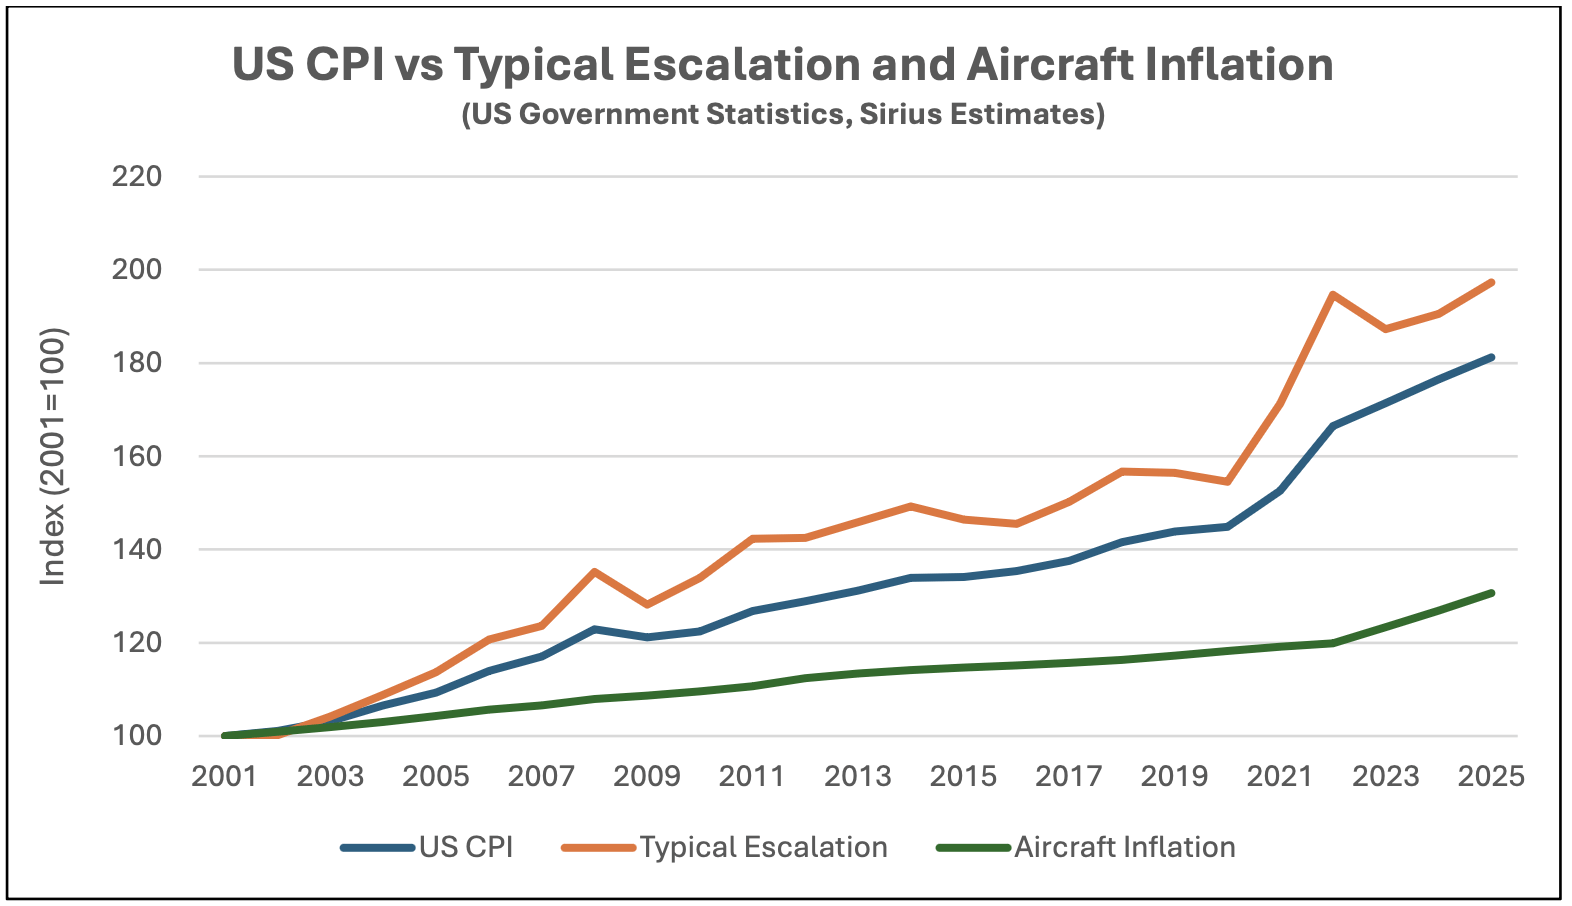
The relationship aircraft escalation and inflation implies that base prices have increased very little if at all. This obviously helps customers feel that they are getting a good deal and has created a perception amongst many industry participants that new aircraft prices were not increasing at all. Our opinion is that aircraft inflation was very subdued for a long time but never completely decoupled from inflation across the overall economy, settling into a pattern of increases at around the US CPI minus 1% per annum. If this is correct than a sharp increase in general inflation was always likely to lead to an increase in new aircraft prices.
Revenues Per Seat Calculations
Our analysis of revenues per seat starts in 2017 for Airbus and 2015 for Boeing. These start dates are driven by the timing of their respective implementation of two key changes in accounting policies for recording commercial aircraft sale revenues. The first of these is the treatment of concessions (discounts) provided by engine manufacturers. For many years Airbus and Boeing included engines in revenues and cost of sales at full list price which had the effect of inflating actual revenues because in practice engine manufacturers heavily discounted new engines to gain market share. This practice has been largely discontinued although the wording around the precise approach used suggests that not all engine discounts are captured in reported revenue. The second change is that sales of spares are now reported separately from sales of aircraft.
The combined impact of these changes is that we have numbers that are much more useful albeit imperfect. With Airbus there is also the challenge of estimating its aircraft sales revenue in US Dollars (“USD”) as substantially all new aircraft sale contracts are priced in USD wherever the manufacturer is based. We do this in two stages:
- First convert Euro (“EUR”) revenues to USD at the average exchange rate for the reporting period; and
- Second adjust USD revenues for the impact of expiring foreign exchange hedges – Airbus sells USD forward for EUR when it contracts the sale of an aircraft and discloses the volume of hedges expiring in each reporting period together with the average strike rate.
To make our figures comparable over time we use standardised seat counts based on two-class configuration for single-aisle aircraft and three-class configuration for twin-aisle aircraft.
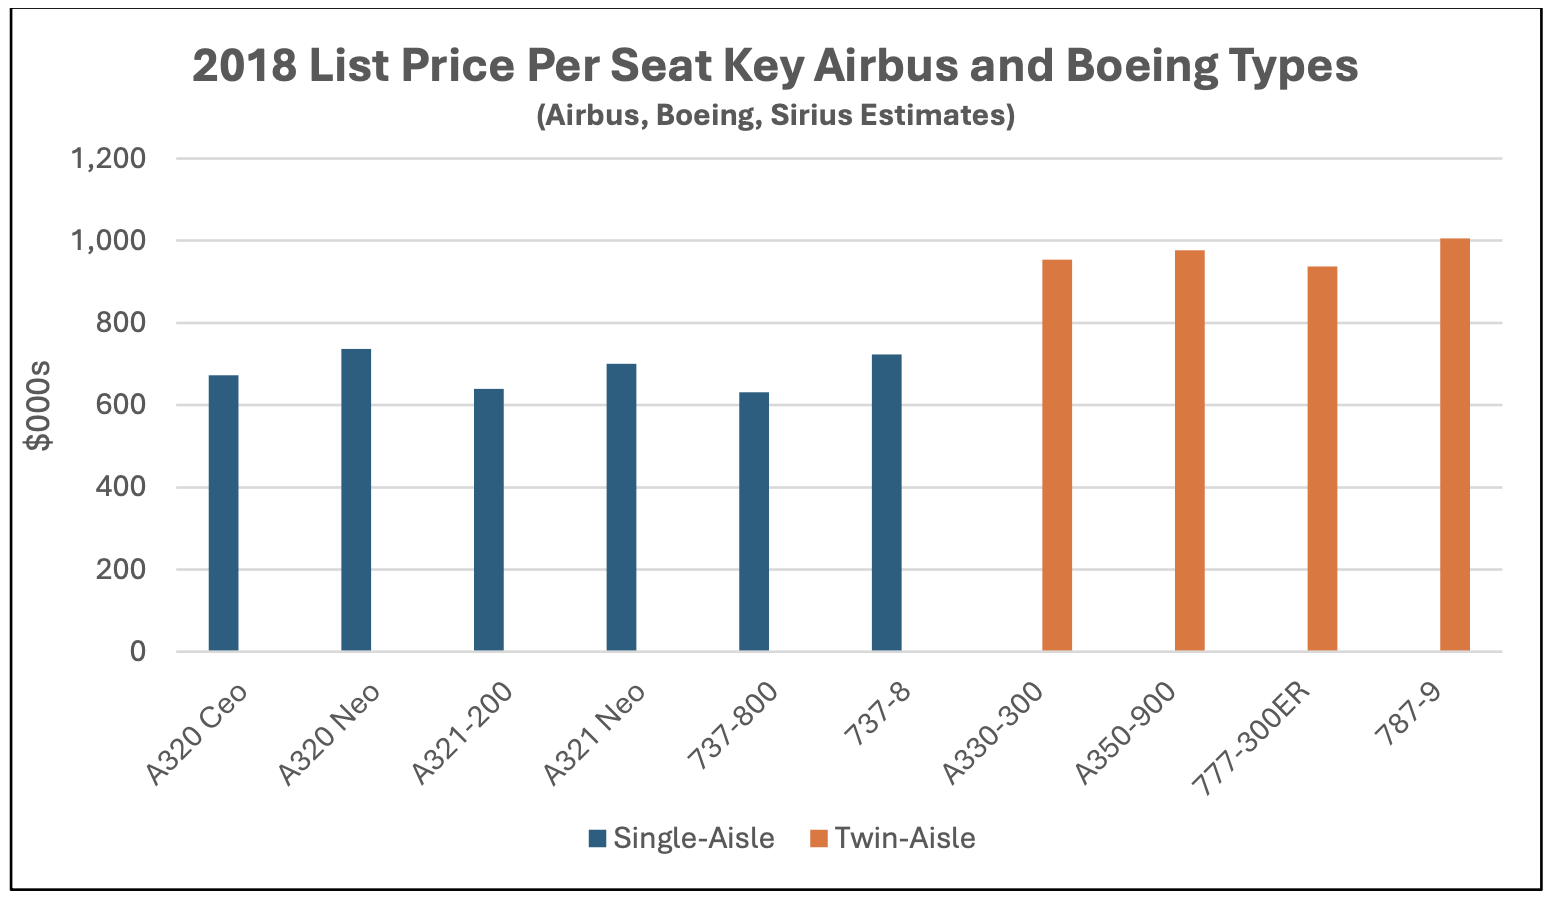
The charts below present not only our estimates of average revenues per seat but also the percentage of seats delivered accounted for by twin-aisle aircraft. This matters because twin-aisle aircraft are more capable (longer range etc.) and have had a higher capital cost per seat. To illustrate this the first chart shows the list price per seat for the main Airbus and Boeing aircraft types as of 2018, the last year when both manufacturers published list prices. At this stage list prices were far higher than any realistic estimate of actual prices (typical discounts were already over 50%) but they did provide a limited market signal of relative prices. The average list price per seat for the four twin-aisle types was $967,000, 42% higher than the average list price for the six single-aisle types at $684,000. This means that a change in the mix of seats delivered must be considered when looking at trends in average revenues per seat.
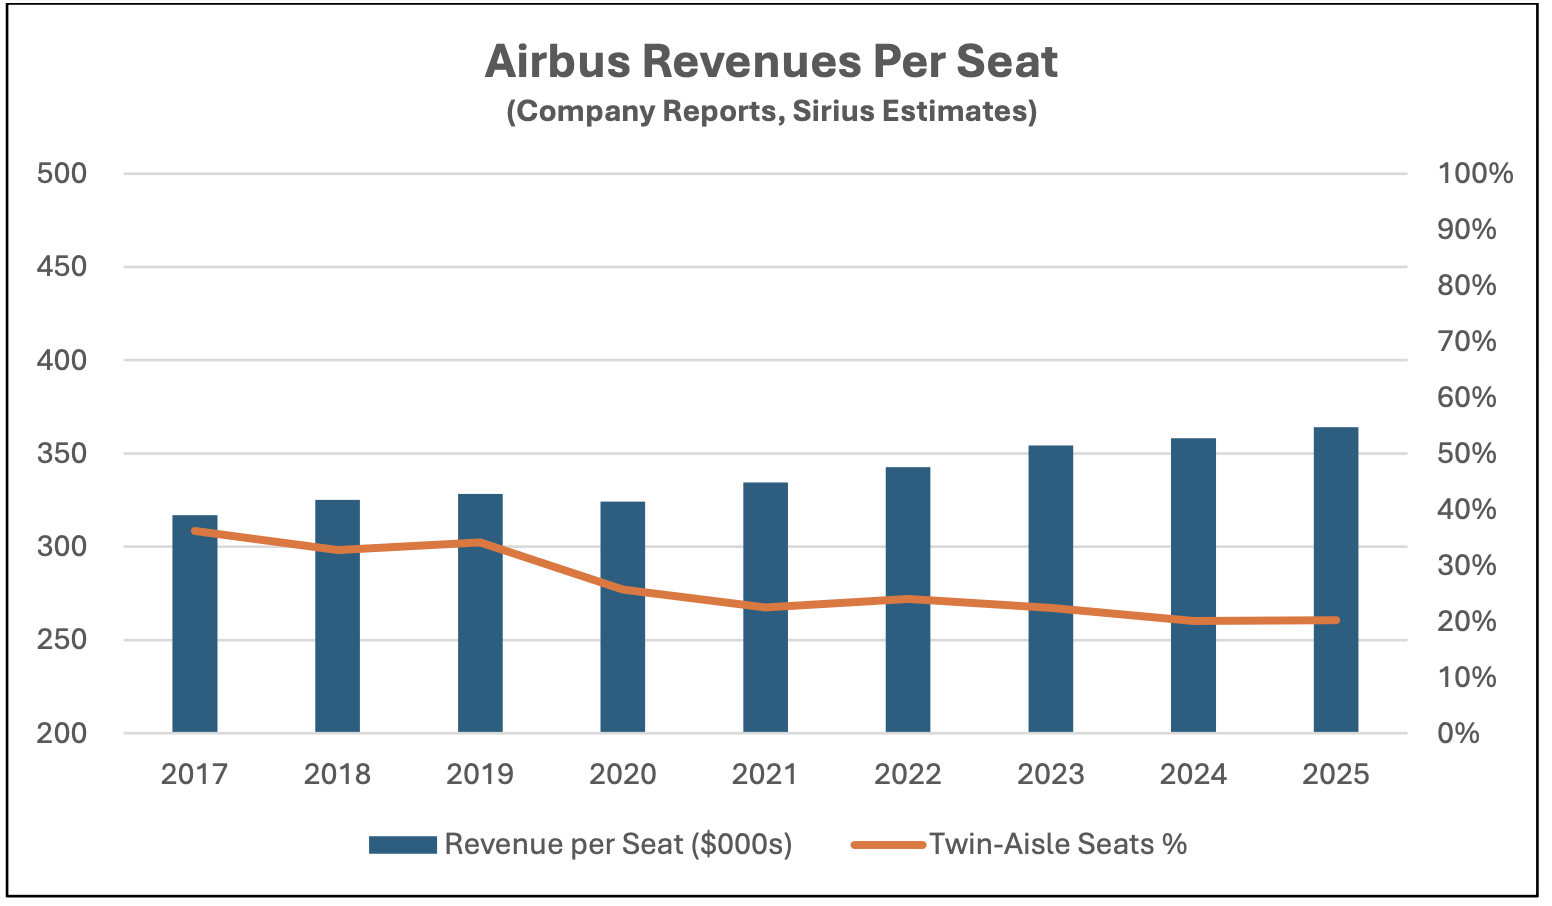
When reviewing the results for Airbus it helps that the company’s business has been relatively stable compared to Boeing. There is clear evidence of an increase in average revenue per seat. Since 2017 this figure has increased by 15% 70 $364,000 and only decreased in one year, 2020. This has been accompanied by a significant drop in twin-aisle seat share from 36% to 20%. If we assume a 40% premium in revenue per seat for twin-aisle aircraft, then revenues per seat would have to increase by a further 6% to compensate for this.
By way of contrast over this period Boeing has had a very volatile business for very well publicised reasons. The impact of delivery mix is much more important for Boeing because it has always been more focussed on the twin-aisle market. Its twin aisle seat share has been on something of a wild ride with a peak of 86% in 2020 when the 737 MAX was not being delivered and a low of 27% in 2022 when deliveries of the 787 were virtually halted due to the requirement for extensive rectification of manufacturing defects. It is only from 2023 that there has been some stability and over this period there has been a steady rise in average revenues per seat with a flat twin-aisle seat share
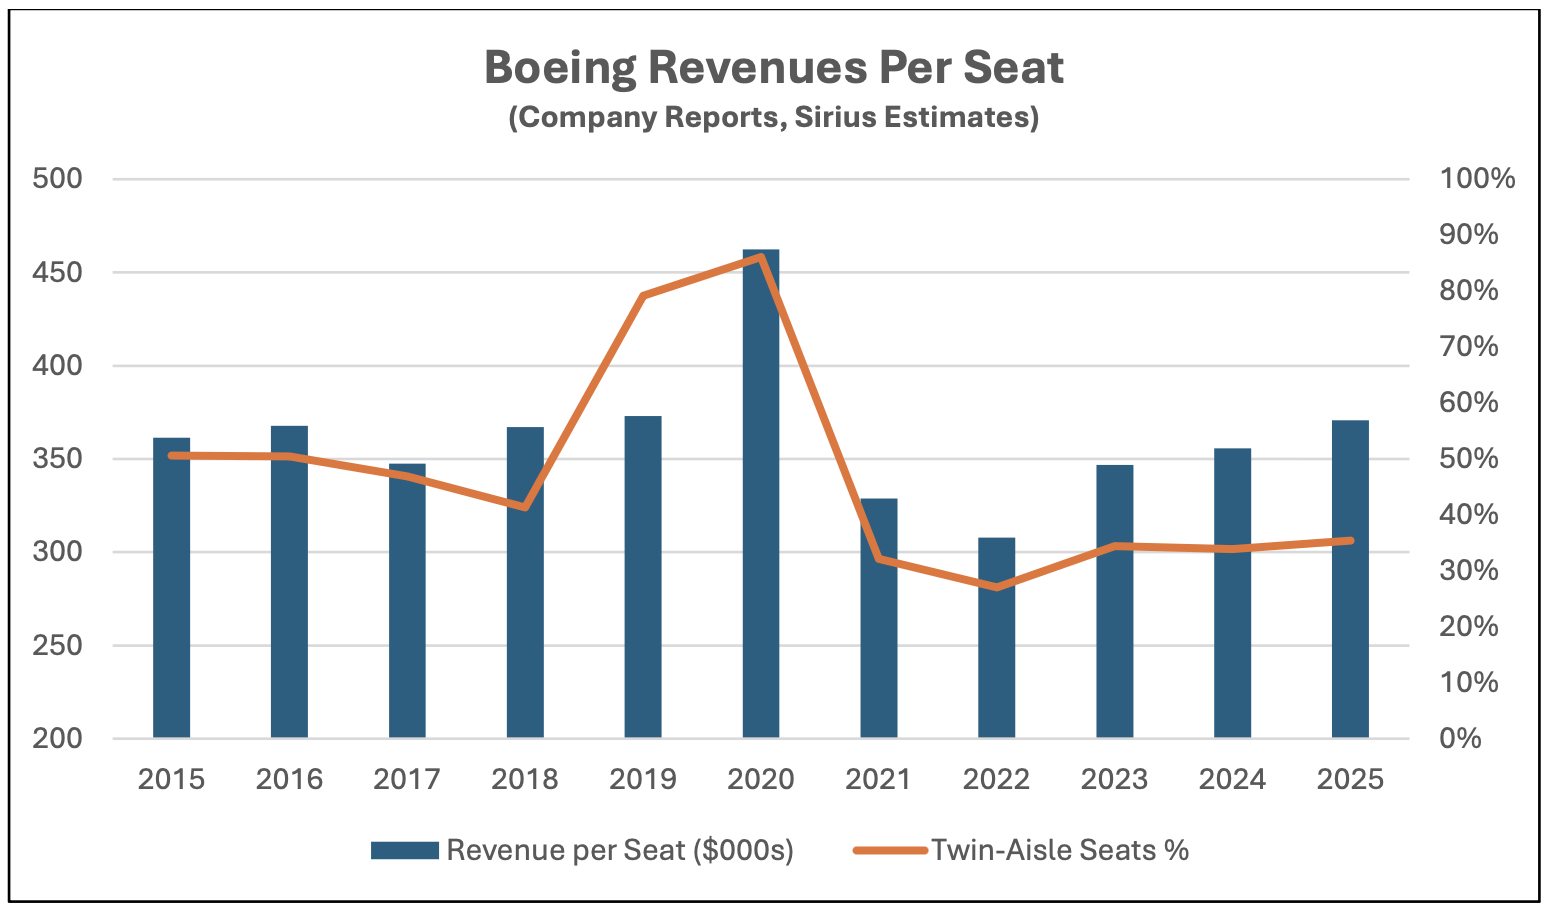
Given how closely Airbus and Boeing compete on price it would be surprising if Boeing’s overall adjusted change in average revenues per seat has been that different from Airbus i.e. somewhere around a 20% increase since the late 2010s. We have already noted the importance of replacement cost in driving used aircraft values. This means that a comparison of used aircraft values pre-Covid and today must take account of this change and to say that, for example, a ten-year-old A320-200 or 737-800 is expensive in 2026 compared to 2019 is an exercise in comparing apples and oranges.
Regular Topics
Macro-Economic Background
The latest IMF World Economic Outlook shows a continued marginal improvement in the forecast level of world GDP despite being published after the outbreak of war in the Middle East.
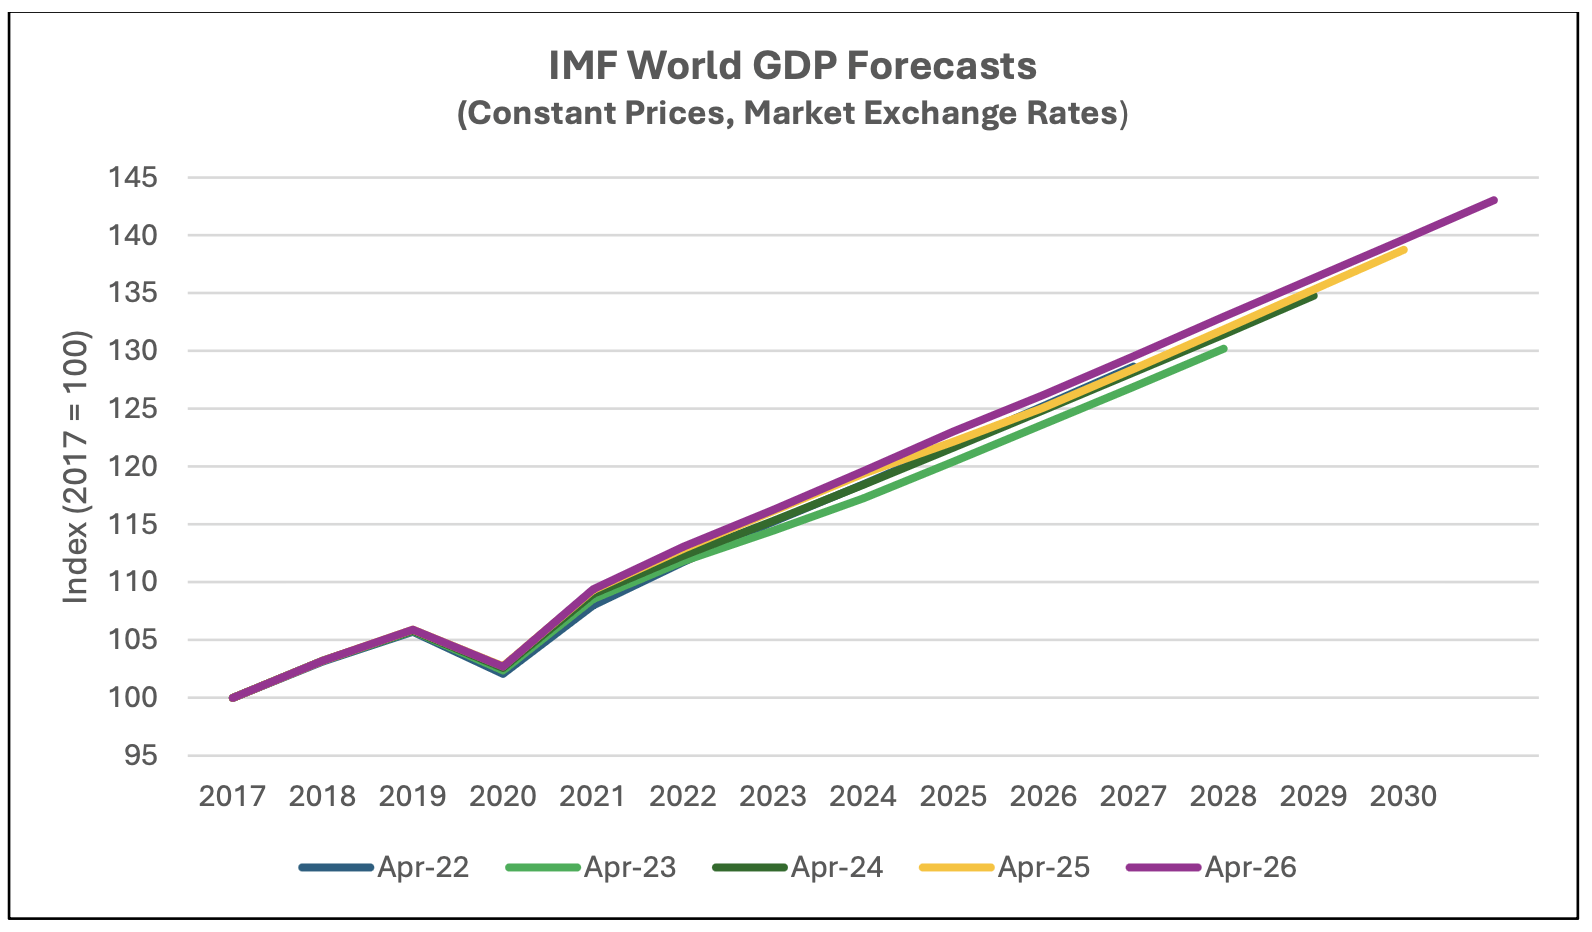
Economic growth is a key driver of long-term growth of air travel. However, since early 2020 its impact has been overshadowed by the fall and recovery in traffic associated with the pandemic. In time the influence of overall economic conditions on air travel is likely to reassert itself, but industry forecasts published by Airbus, Boeing and IATA assume much higher rates of traffic growth than GDP growth over the rest of the 2020s as the former catches up to its long-term trend (see our Q1 2024 Industry Update for a more detailed discussion).

One clear impact of the war has been a spike in jet fuel prices by much more than the increase in the cost of crude oil. A consistent feature of this market since Russia’s invasion of Ukraine in 2022 has been a high prevailing “crack spread” compared to normal historic levels. We have no expertise in the jet fuel market, but the following extract from IATA’’s Global Outlook for Air Transport (December 2025) provides some level of explanation for the situation prior to 2026, and we can only assume that the factors identified as driving the level of the “crack spread” have intensified.
“…the crack spread, is a function not only of the price of Brent, but also of competition for production space at the refineries.
Demand for jet fuel is projected to grow by nearly 4% in 2025 and 3% in 2026. Nevertheless, jet fuel represents a mere 9% of total global refined output and is not a priority for refineries. Instead, refineries optimize their product mix by prioritizing the production of other refined products, notably diesel and gasoline, due to higher demand and profit margins. Diesel production, in turn, competes with (non-refined) LNG (liquified natural gas) and its price developments. These factors, along with strong freight activity, seasonal heating demand, and a significant decrease in Russian refinery activity, have tightened middle distillate balances.”
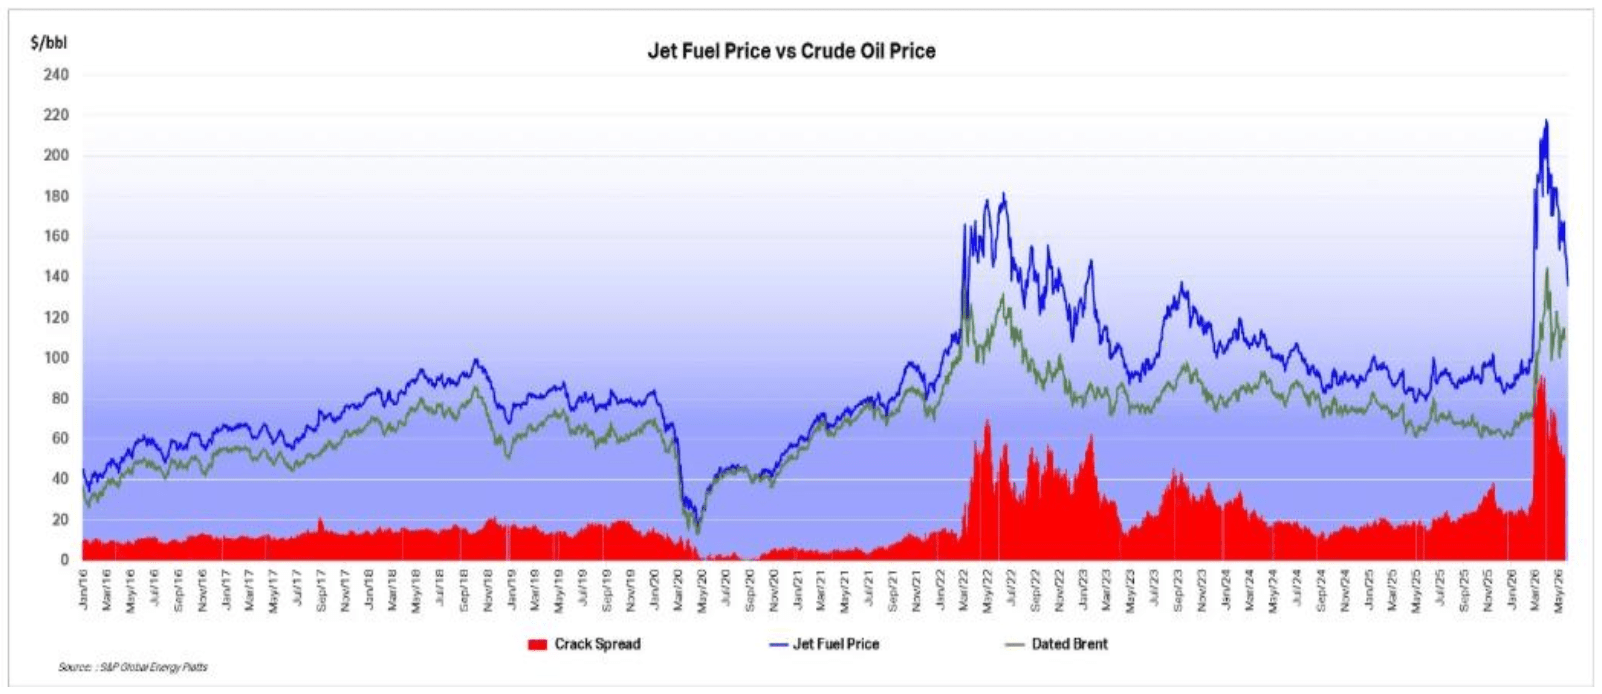
The good news is that the cost of jet fuel has declined considerably from its high of c. USD 5.00 per gallon and the latest global average per IATA’s Jet Fuel Price Monitor was USD3.37 suggesting that there is some measure of adaptation occurring in the supply chain. Even renewed escalation of hostilities cannot make the Straits of Hormuz more blockaded than it already is. Also, many airlines are still benefitting from fuel hedging programmes that are typically designed to reduce their exposure to the cost of jet fuel 6-12 months into the future. Our regular listings of airline bankruptcies (see below) shows no obvious increase in financial distress so far in 2026, but risk levels will remain high unless circumstances change.
Another indicator that is potentially important to aircraft investors is the breakeven inflation rate on US Treasury Inflation-Protected Securities (TIPS). This indicator measures inflation expectations and it matters because used aircraft values are strongly influenced by the cost of new aircraft and over time this cost is linked to US Dollar inflation. In the short term this linkage is driven by escalation clauses in aircraft purchase contracts and in the long term by the general input cost environment for the aircraft manufacturers. The chart below compares the breakeven rate for 10-year and 5-year TIPS.
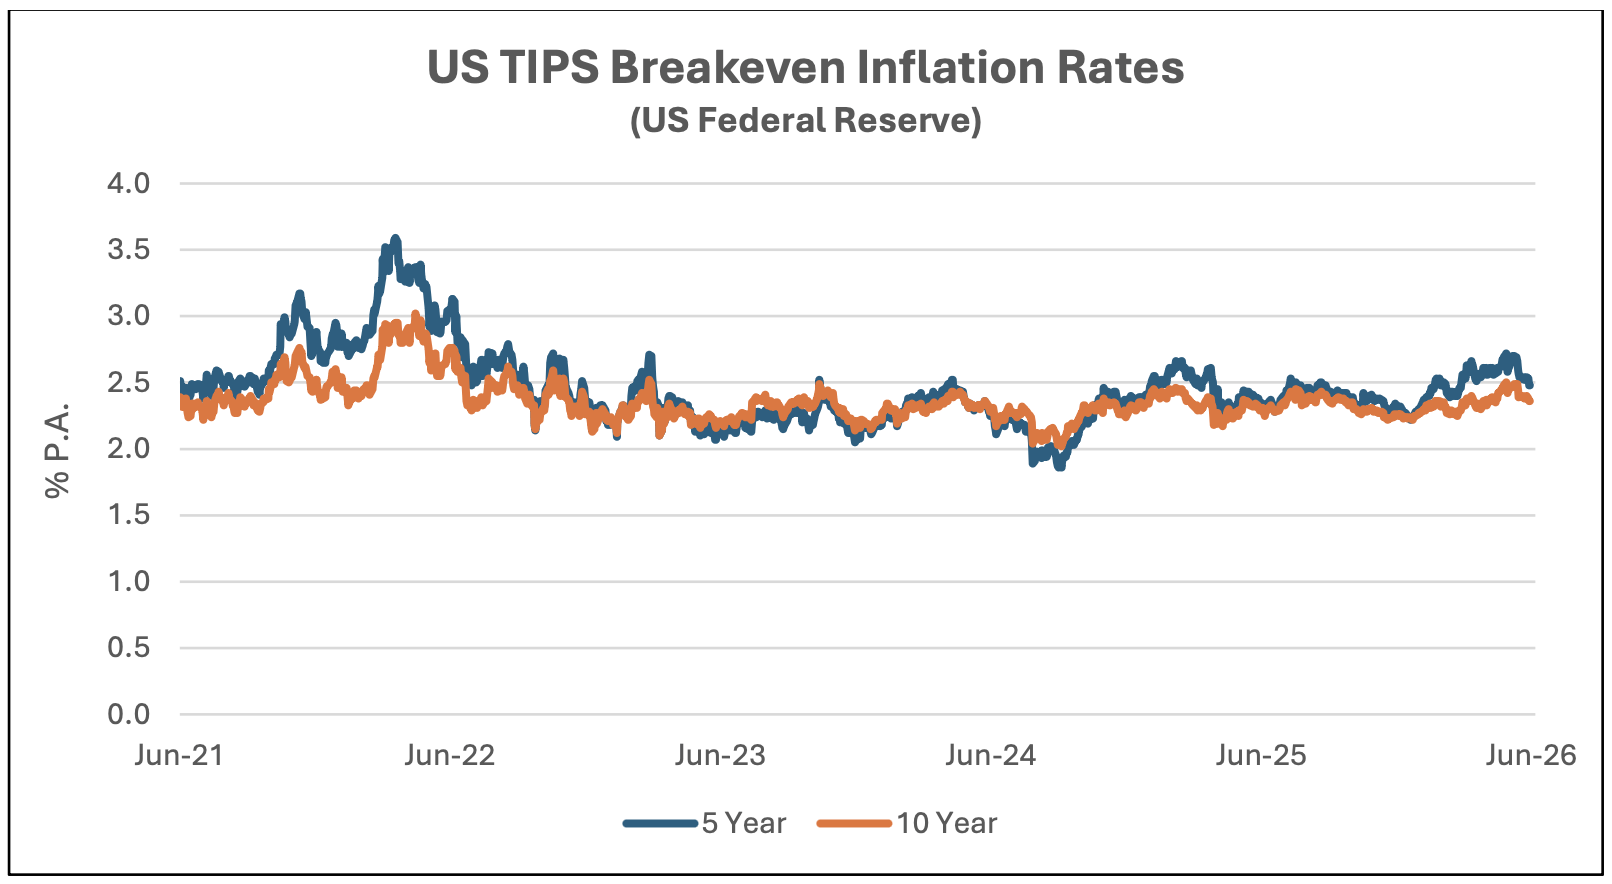
Although medium or long-term inflation expectations have never gone higher than 3.5%, actual inflation experience has often been much higher in the last few years. Our discussion above highlights the increase in new aircraft prices since the late 2010s and prevailing high oil prices are very likely to increase both general and aircraft inflation.

Traffic and Aircraft Demand

Traffic growth was robust in January and February, led by recovering domestic demand, particularly in China. This outweighed continuing domestic weakness and the US and a slowdown in India where supply has been constrained by operational issues at IndiGo, by far the largest airline in the country. After the outbreak of war at the end of February, it was not surprising to see weaker international activity, and this has continued in April.

RPKs[2] for the first quarter overall were up 4.0% and a lower increase in ASKs[3] meant a big 1.3% increase in load factor to 82.4%.
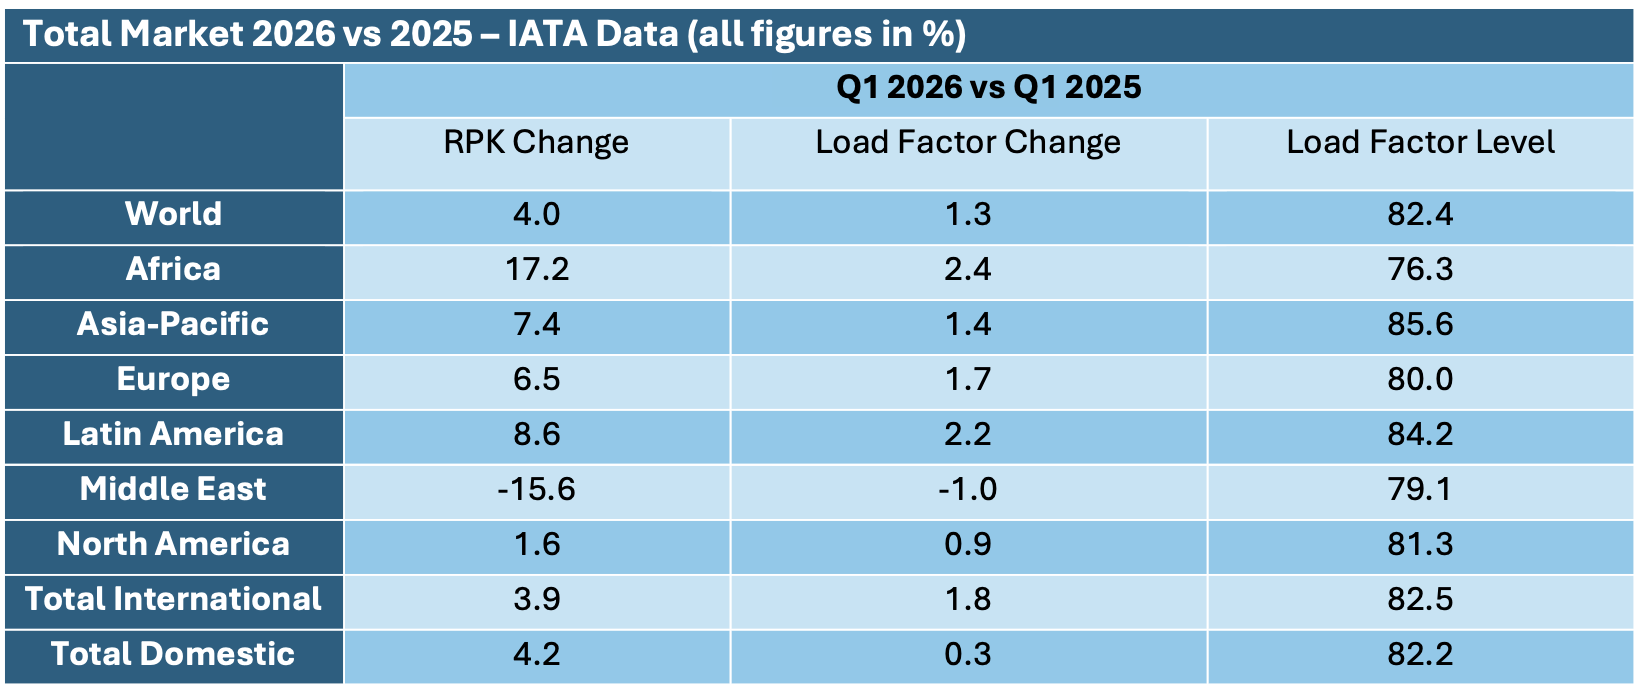
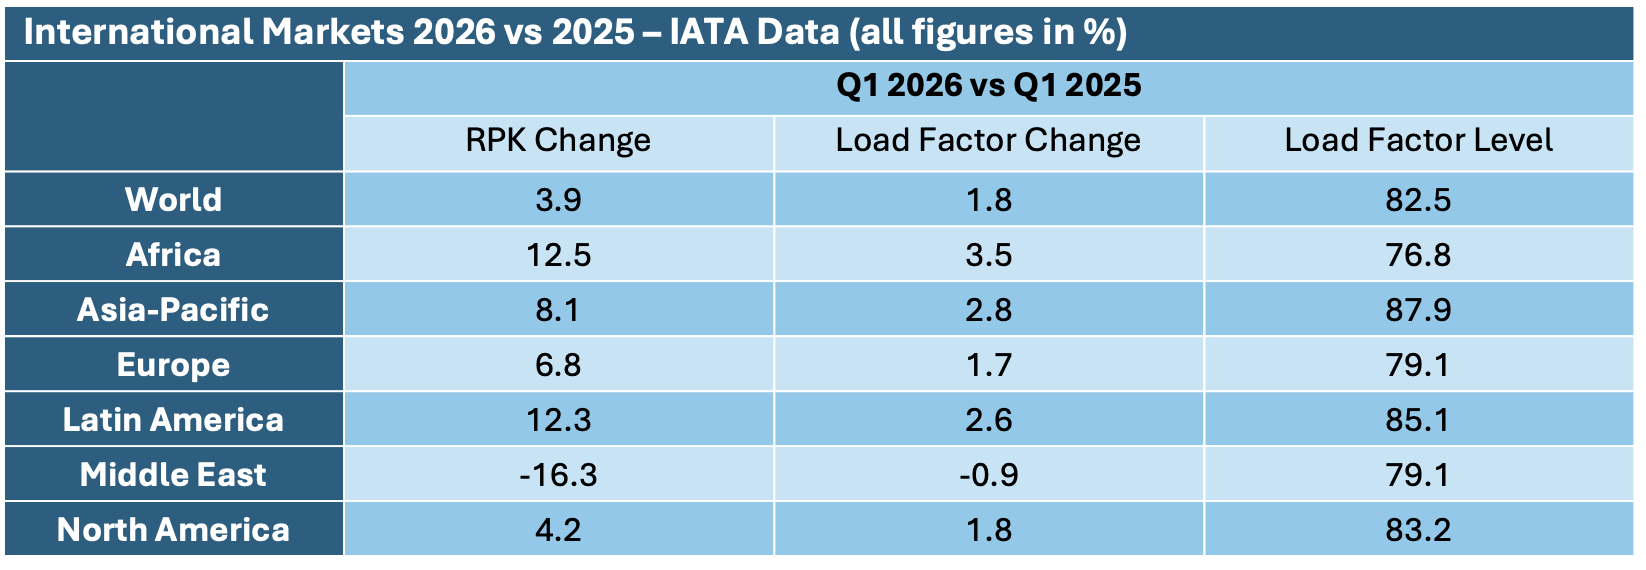

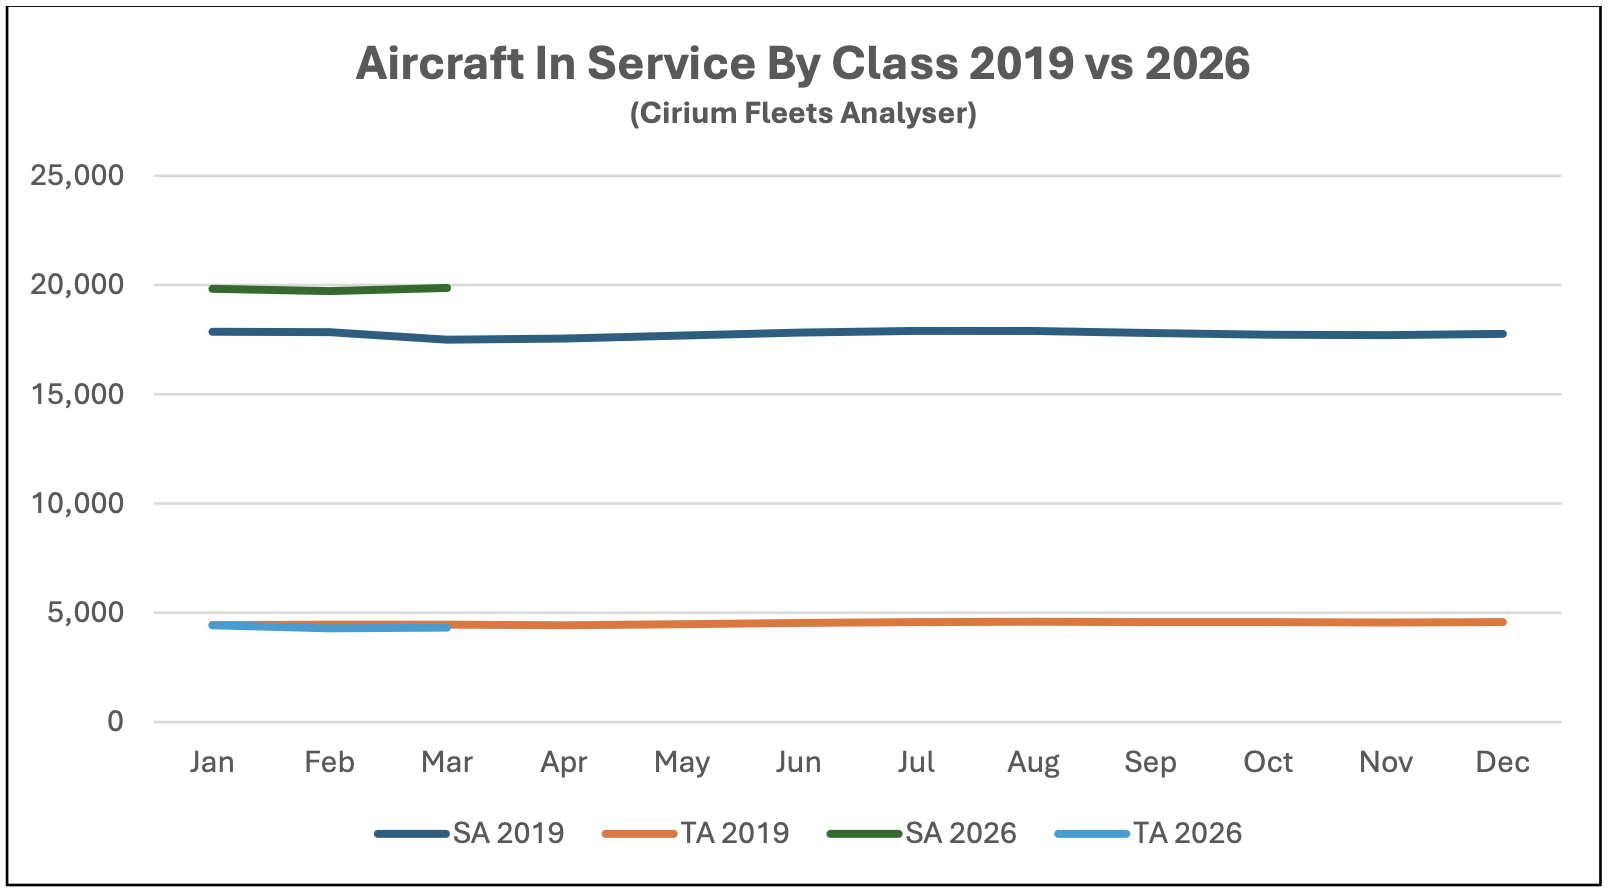
Although some short-haul aircraft serve international routes nearly all long-haul aircraft do so, and this is reflected in the relative demand for single-aisle (narrowbody) and twin-aisle (widebody) aircraft. Aircraft demand can be measured in terms of aircraft in service and ASKs, the standard measure of aircraft capacity deployed by airlines which indicates how intensively aircraft are being flown. Single aisle aircraft demand on both metrics is higher so far in 2025 than in 2019 whereas twin-aisle aircraft are in line.
The softer recovery for twin-aisle aircraft is mainly due to weak traffic to and from, and within the Asia-Pacific region. The figures by region in the tables above are based on airline domicile, so weak Europe to Asia traffic reduces recorded international RPKs in other regions. This short-term effect is accompanied by a very gradual long-term increase in single-aisle aircrafts’ share of global airline capacity at the expense of twin-aisle aircraft, which is caused by better operator economics and an increase in the number of markets where single-aisle aircraft can be deployed because of the greater range of new technology aircraft such as the A320 Neo and the B737 Max.

New Aircraft Supply
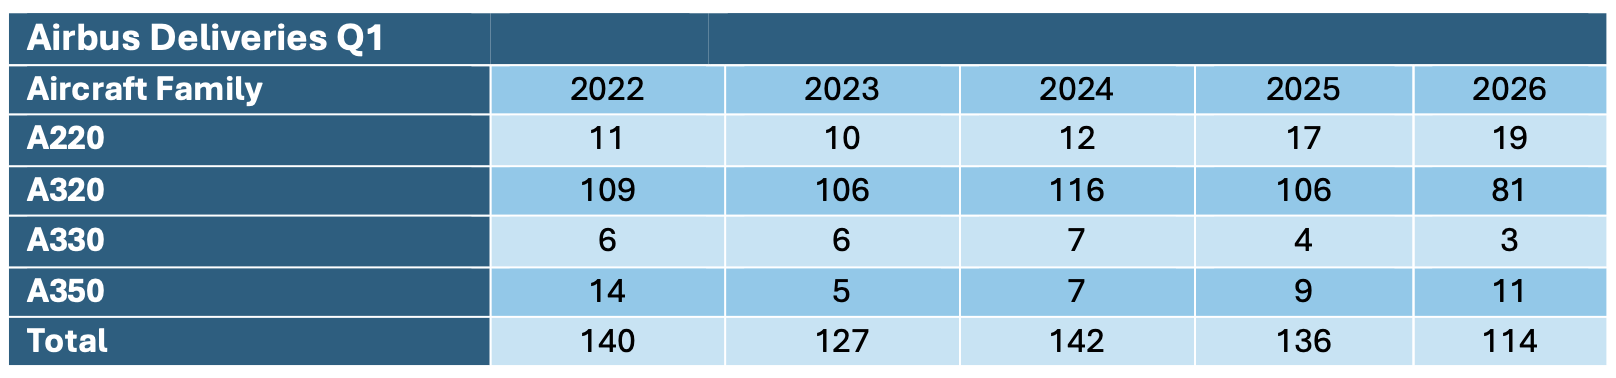
Airbus deliveries in Q1 2026 were sharply lower than in Q1 2025. It is normal to see a decline relative to the previous Q4, but a year-on-year drop is unusual. This was caused by an inability to deliver produced aircraft (more strictly speaking airframes) because of supply chain problems involving engines and other equipment supplied by third parties and an “administrative delay” affecting 20 aircraft to be delivered to Chinese customers.
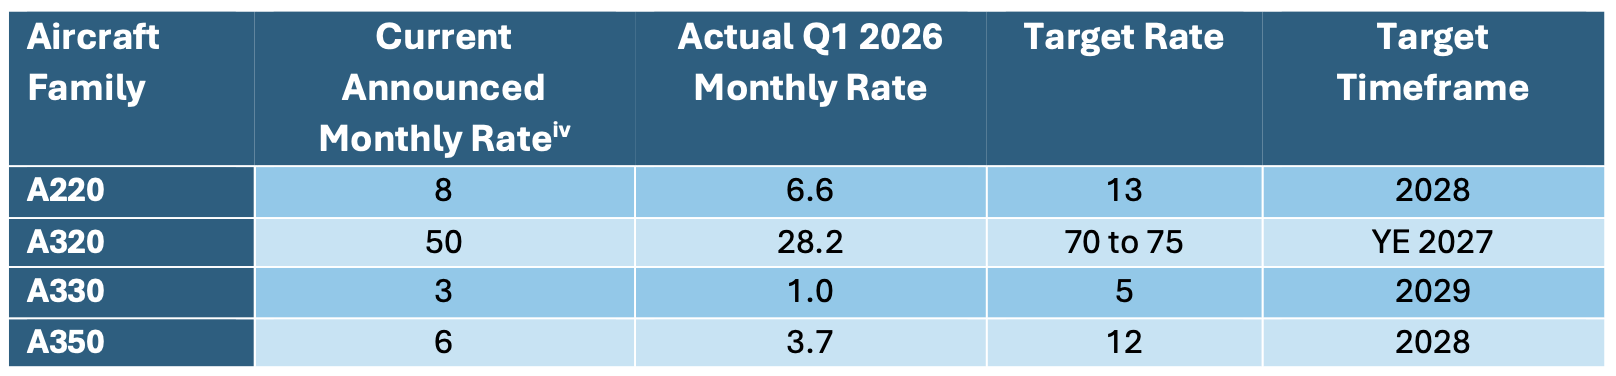
There has been no change in Airbus’s production plans (the current production figures in the table above include some external estimates as well as official Airbus guidance), and overall delivery guidance for 2027 remains at 870 aircraft.

Q1 2026 marks the first time Boeing has delivered more aircraft than Airbus since it suspended deliveries of the 737 MAX in 2019. The company says that 737 output has stabilised at 42 per month but there is no specific timeframe for an increase to 47 per month which has been previously discussed as the next step up for this aircraft family. Boeing are also suffering from problems with engine deliveries and other supply chain issues, but they did manage to deliver 93% of aircraft produced vs 70% for Airbus according to Flight Plan. The MAX 7 and MAX 10 remain due to be certified this year with deliveries starting in 2027.
There have been no new announcements about entry into service for the 777X, but there has been some discussion by Boeing of the uncertain timeframe for “change incorporation” for the 30 aircraft already built and in inventory in order to allow them to be delivered to customers.
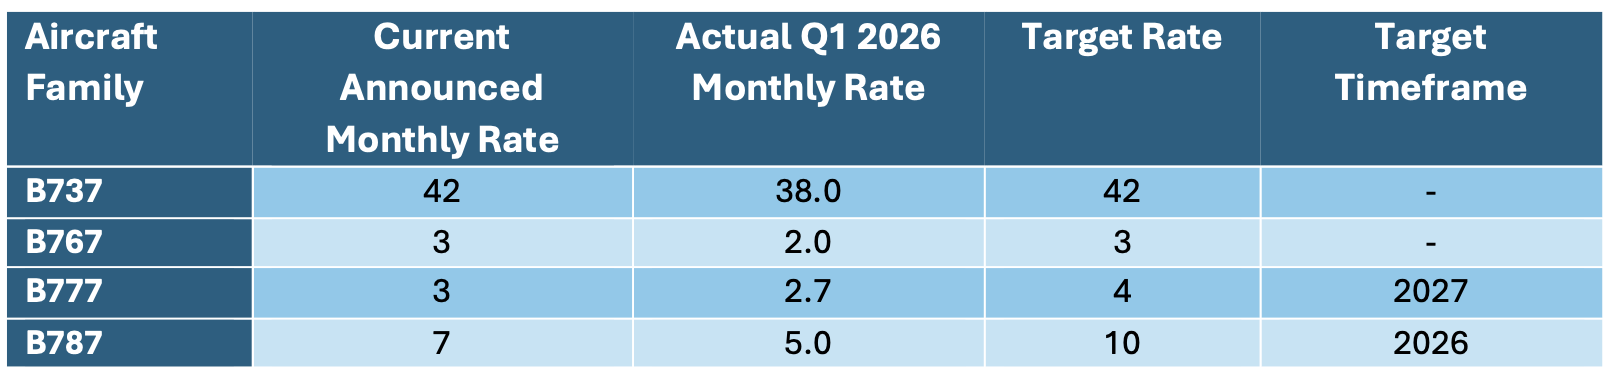
Embraer had a strong Q1 with 10 deliveries and 18 firm orders. Comac deliveries were down slightly.

Airline Industry Financial Performance

It is no surprise that airline stocks have underperformed the overall market since the end of February as higher fuel prices will hurt earnings both directly and indirectly by pushing up ticket prices.
There had been very few airline failures so far in 2026 and those that have gone bankrupt and/or shut down are small so will not result in a lot of aircraft needing to be redeployed (most of the aircraft operated by Joy Air were the Chinese-built MA60 turboprop aircraft which has a very limited international market).
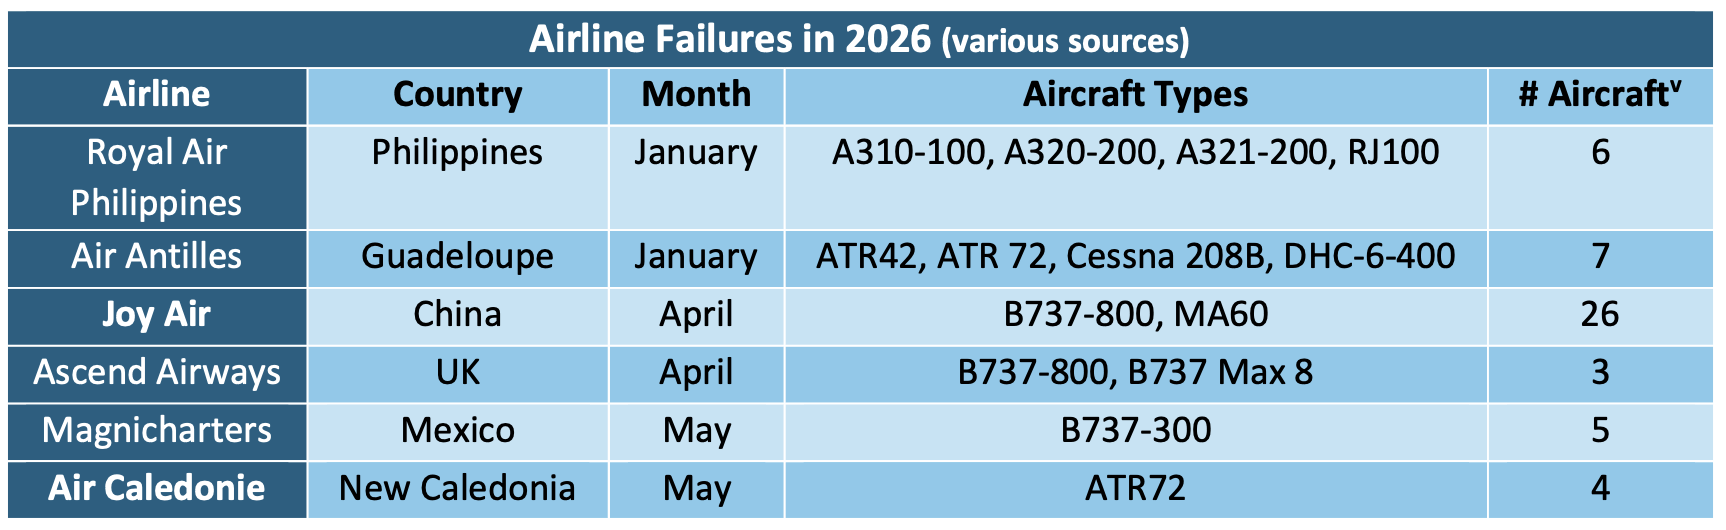
Spirit Airlines is not on this list because it went into bankruptcy in 2025. Spirit shut down in May 2026, and this has created a redeployment challenge for the aircraft leasing industry which has to find new homes for 66 A320 family aircraft including both Ceo and Neo variants. The current industry background is obviously not ideal so it will take time to work through this inventory, but there are no lessors with high exposures relative their overall fleets, so this process is very likely to be orderly.
Endnotes
[1] Although there is no standard blend, a typical combination might be:
– 50% Aircraft manufacturing Wages and Salaries (Series ID: CIU2023211000000I); and
– 50% Industrial Commodities (Series ID WPU03THRU15).
[2] RPKs is the acronym for revenue passenger kilometres, which is the product of the number of paying passengers times distance flown.
[3] ASKs is the acronym for available seat kilometres, which is the product of the number of available seats flown times distance flown.
[4] Airbus normally quotes its production rates based on an 11.5-month year for single-aisle aircraft.
[5] Fleet numbers are as of December 31st, 2025.
Disclaimer
This Presentation has been made to you solely for general information purposes and is not intended to provide, and should not be relied upon for legal, tax, accounting, investment, or financial advice. This Presentation is not a sales material and does not constitute or form any part of any offer, invitation or recommendation to the recipient, its affiliates or any other person to underwrite, sell or purchase securities, assets or any other product, nor shall it or any part of it form the basis of, or be relied upon, in any way in connection with any contract or transaction decision relating to any securities, assets or any other product. None of Sirius, its affiliates or shareholders shall have any responsibility or liability to the recipient, its affiliates, shareholders or any third party in relation to this Presentation or any other document or materials prepared by Sirius or its affiliates, officers, directors, employees, advisers, or agents. Sirius and its affiliates, officers, directors, employees, advisers, and agents have taken all reasonable care to ensure that the information contained in this Presentation is accurate. Neither Sirius nor any of its affiliates, officers, directors, employees, advisors, or agents has any obligation to update this Presentation. Under no circumstances should the delivery of this Presentation, irrespective of when it is made, create an implication that there has been no change in the affairs of the entities that are the subject of this Presentation. This Presentation may be updated and amended by a supplement and, where such supplement is prepared, this Presentation will be read and construed with such supplement. The statements herein which contain such terms as “may”, “will”, “should”, “expect”, “anticipate”, “estimate”, “intend”, “continue” or “believe” or the negatives thereof or other variations thereon or comparable terminology are forward-looking statements and not historical facts. No representation or warranty, express or implied, is made as to the fairness, accuracy, or completeness of such statements, estimates and projections. The recipient should not place reliance on any forward-looking statements. Neither Sirius nor its affiliates undertake any obligation to update or revise the forward-looking statements contained in this Presentation to reflect events or circumstances occurring after the date of this Presentation or to reflect the occurrence of anticipated events. The information set out in this Presentation has been prepared by Sirius based upon various methodologies and calculations which it believes to be reasonable and appropriate. Past performance cannot be a guide to future performance. In preparing this Presentation, Sirius has relied upon and assumed, without independent verification, the accuracy and completeness of all information available from public sources or which was provided to it or otherwise reviewed by it. This Presentation supersedes and replaces any other information provided by Sirius or its affiliates, officers, directors, employees, advisers, or agents in respect of the content of the Presentation. No information or advice contained in this Presentation shall constitute advice to an existing or prospective investor in respect of his personal position. None of Sirius, its affiliates, or its affiliates’ officers, directors, employees or advisers, connected persons or any other person accepts any liability whatsoever for any loss howsoever arising, directly or indirectly, from this Presentation or its contents.