
Macro-Economic Background
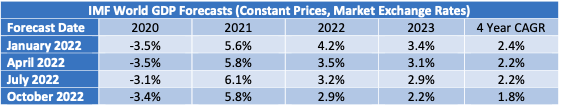
The IMF’s latest World Economic Outlook (July 2022) shows modest decreases for forecast growth in 2022 and 2023, although looking over the entire period since the onset of the pandemic these reductions are entirely offset by upward revisions to 2020 and 2021.
Global economic growth is vital to the long-term growth of air travel. However, in the next few years the key drivers of growth will likely be very specific to the airline industry, especially the recovery from the industry downturn caused by the Covid 19 pandemic.
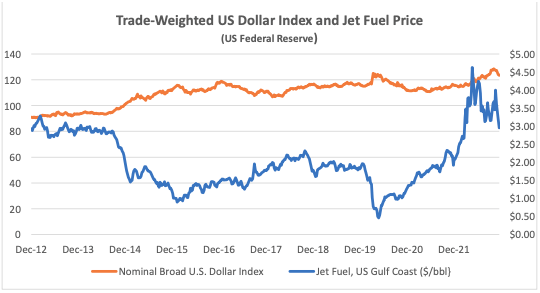
For airlines outside of the US the impact of the high cost of fuel has been compounded by a strengthening US Dollar. This is a very important factor in airline financial performance because so many airline costs are typically US Dollar-denominated – not just fuel, which may or may not be hedged, but also aircraft rents, debt service, aircraft, and spare parts.
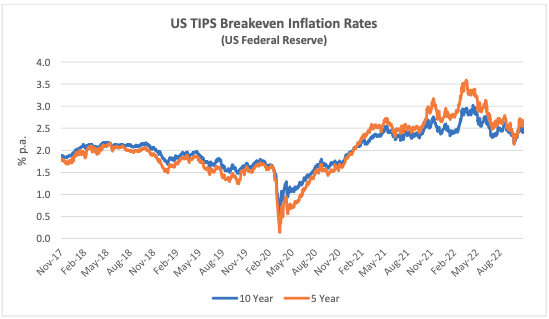
Another indicator that is potentially important to aircraft investors is the breakeven inflation rate on US Treasury Inflation-Protected Securities (TIPS). This indicator measures inflation expectations and it matters because used aircraft values are strongly influenced by the cost of new aircraft and over time this cost is linked to US Dollar inflation. In the short term this linkage is driven by escalation clauses in aircraft purchase contracts and in the long term by the general input cost environment for the aircraft manufacturers.
The chart below compares the breakeven rate for 10-year and 5-year TIPS to highlight the differences in expectations for the different time horizons. The shorter maturity has been more volatile, especially since the onset of the pandemic, but there is a strong overall correlation that suggests changed inflation expectations are not for a transitory “blip”.
Traffic and Aircraft Demand
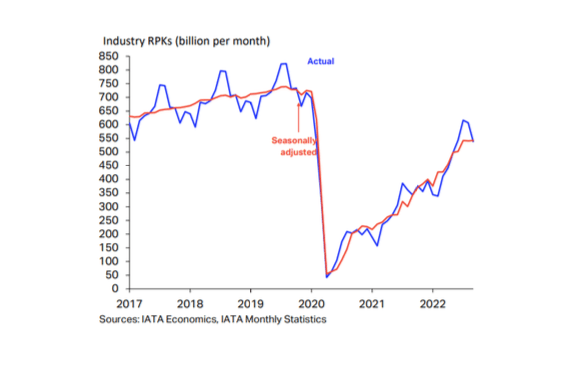
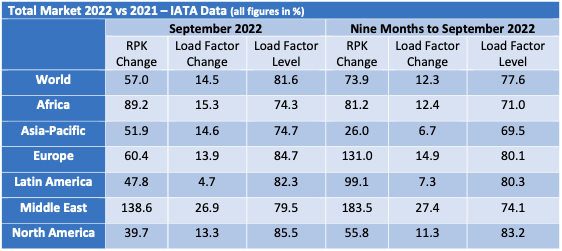
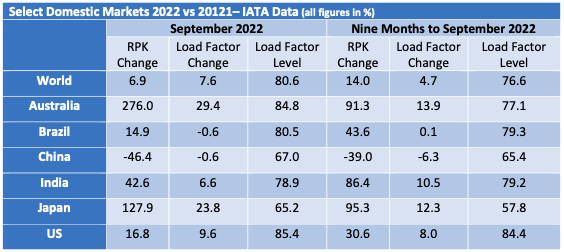
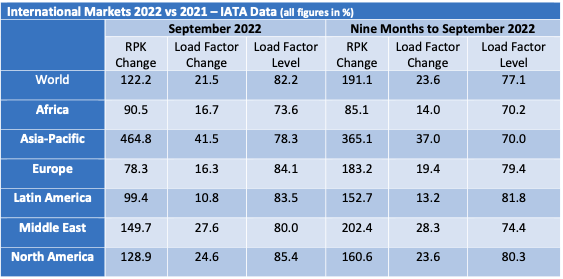
The strong recovery in air travel at the start of 2022 has continued through Q3 although overall RPKs for the month of September remained 26.2% below the comparable figures for 2019. Europe and the Middle East are the strongest performing regions because their recovery has mainly occurred this year, whereas the Americas already achieved a significant recovery in 2021. Traffic growth in Asia Pacific remains weak mainly due to the disruptive effect of lockdowns on domestic Chinese RPKs.
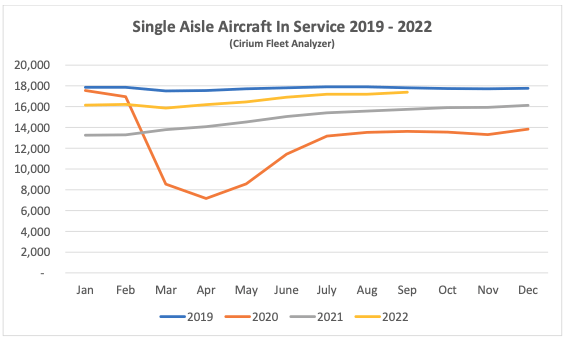
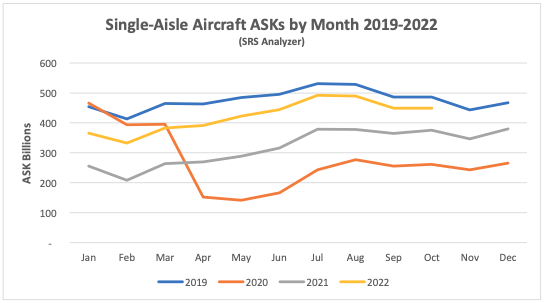
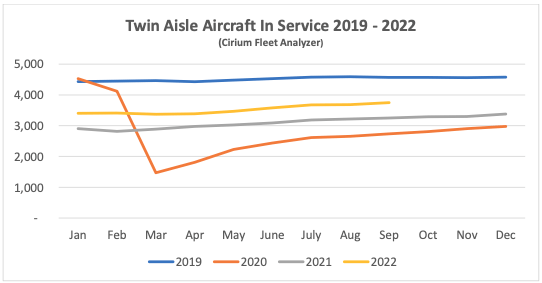
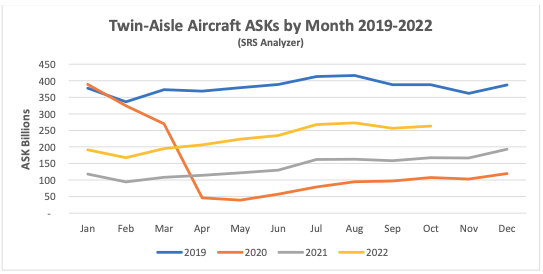
Although some short-haul aircraft serve international routes nearly all long-haul aircraft do so, and this is reflected in the relative demand for single-aisle (narrowbody) and twin-aisle (widebody) aircraft. Aircraft demand can be measured in terms aircraft in service and ASKs1, the standard measure of aircraft capacity deployed by airlines which indicates how intensively aircraft are being flown. Single aisle aircraft in service levels are now very close to where they were in 2019 with a slightly weaker recovery in ASKs due to lower utilization. The comparable figures for twin aisle aircraft remain much weaker.
New Aircraft Supply
The latest status of Airbus’s production plans is:
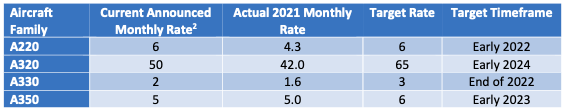
In its H1 2022 results presentation Airbus confirmed that it is aiming for an A320 production rate of 75 per month in 2025. However, due to supply chain problems it has put back the timing for its interim target of 65 per month from mid-2023 to early 2024. The A321 Neo XLR has had its target date for entry into service put back from 2023 to early 2024 and the timing for an increase in the A350 production rate has slipped from late 2022 to early 2023.
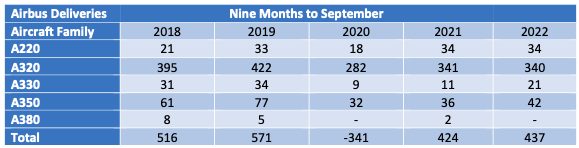
Airbus recently reduced its overall deliveries guidance for 2022 from 720 to 700.
The latest status of Boeing’s production plans is:
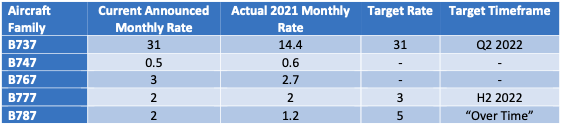
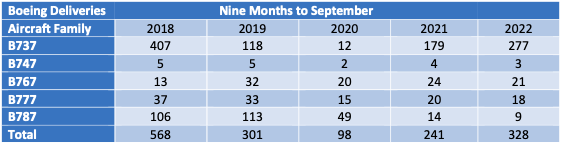
Boeing significantly increased B737 Max deliveries in the first nine months of 2022 and has achieved the target monthly rate of 31 that it announced when it resumed production in 2021. Boeing’s inventory of manufactured but undelivered B737 Max aircraft is dropping very slowly, from 335 aircraft at the end of 2021 to 290 at the end of June 2022 (we have not been able to identify an aggregate number for September 2022). Boeing has stretched out the period over which it expects to deliver these aircraft. Its most recent guidance is that it will reduce this inventory at a rate of 8-10 per month with some deliveries not occurring until 2025. Earlier discussion of an increase in production to 38 per month has been shelved due to supply chain problems.
Despite this overall success the B737 max still faces challenges. It has yet to be recertified by the Chinese authorities although this is expected to be resolved soon. Also, there is effective FAA certification deadline at the end of 2022 for the new B737 Max 7 and B737 Max 10 variants. If Boeing fails to meet this deadline these aircraft will have to be redesigned to add a new emergency alerting system, which would lead to delivery delays.
Boeing has also had quality and production problems with the B787, its main passenger twin-aisle product (nearly all B747, B767 and B777 deliveries are freighters or tankers). It suspended deliveries in May 2021 and restarted in Q3 2022. The inventory of undelivered B787 aircraft stands at 115 and Boeing has said it expects to deliver most of them within the next two years.
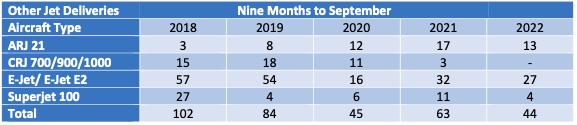
The number of commercial jets delivered by OEMs other than Airbus and Boeing through Q3 was slightly over 50% of the comparable figure for 2019. Modest declines for the CRJ and SSJ are due to the former ending production and the impact of sanctions on Sukhoi, in particular the announcement by the SSJ’s engine supplier Powerjet that it is withdrawing from the Russian market. The production decreases at COMAC and Embraer are more short term as the former has a strong backlog and the latter is guiding 60-70 deliveries for the full year.
Airline Industry Financial Performance
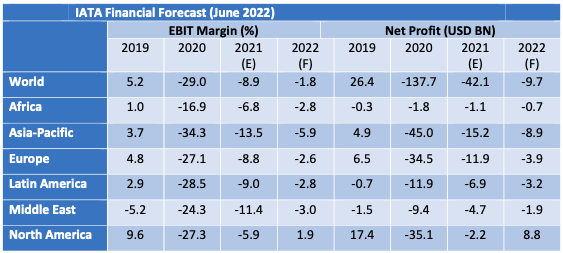
IATA’s June 2022 financial forecast shows the airline industry returning to near breakeven in 2022. North America is set to be the first region to move back into net profit and Europe is forecast to be the next best performer on an EBIT Margin basis. The forecast shows a general pattern of modest improvements compared to its predecessor in October 2021 except for a much-improved outlook for Europe and a much less favourable outlook for Asia-Pacific. Europe’s relative performance is much better than in 2021 due to positive impacts of its Covid passport scheme and the re-opening of North Atlantic travel, whereas Asia-Pacific is suffering from both lockdowns in China and more persistent government travel restrictions than in other regions.
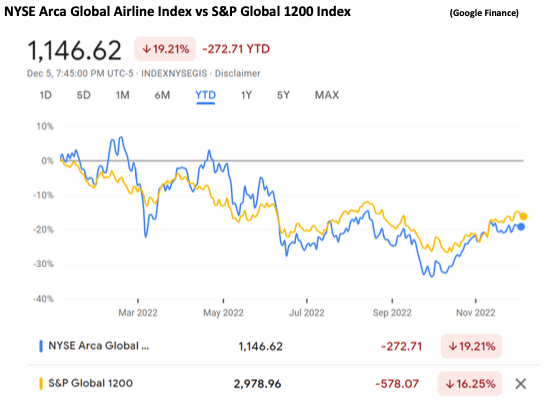
So far in 2022 airline shares have slightly underperformed the overall market. Since 2020 airlines have not recovered in line with the overall market because of the need to issue new stock to repair their balance sheets. New equity issuers have included Air Asia, Air France-KLM, Air New Zealand, American Airlines, easyJet, El Al, Flyr, Garuda, Lufthansa and TUI.
The major airline credit event in 2022 so far has been the effective confiscation of aircraft leased to Russian airlines by western lessors, which we discussed in detail in our Q1 2022 publication. There has been no fundamental change since then, although recent reports that some western aircraft are being cannibalised for spare parts is in line with our discussion of likely future developments.
In July 2022 SAS applied for Chapter 11 bankruptcy protection in the US courts. This is the only major airline bankruptcy so far this year. We have not been able to identify any other significant airline failures outside Russia since the start of 2022. Also, in June Comair (South Africa) entered liquidation after a successful restructuring in 2020. These events illustrate the fragile financial condition of many airlines post-pandemic and their vulnerability to adverse events such as the pilot strike at SAS. Given the high level of fuel prices and the US Dollar there is a good chance of further failures this winter, particularly if there is a recession. According to the aviation consultancy Ishka the number of airline groups in bankruptcy/restructuring in at the start of November was 10 with 498 aircraft affected3, although in early November the LATAM Group successfully emerged from Chapter 11.
Special Topic – Interest Rates and Aircraft Leasing
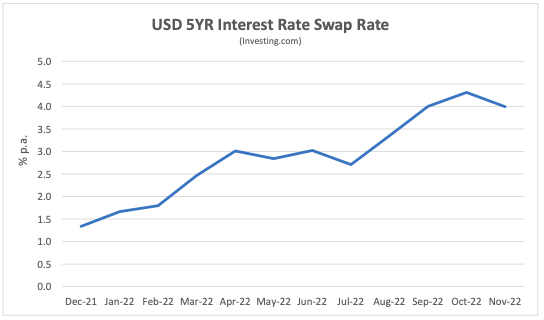
The most important economic event of 2022 has been the global increase in inflation and interest rates. The US Fed has led the way in raising rates so that the 5YR US interest rate swap rate has increased from 1.34% p.a. at the start of the year to just under 4% p.a. at the end of November.
This clearly has implications for the aircraft leasing market. Most aircraft lessors employ a significant amount of debt in their funding mix and seek to pass on increases in interest rates to their airline customers. The airlines are also leveraged so they have to weigh higher lease rates against the increased cost of ownership, which is the alternative to leasing. The conventional industry wisdom is that lease rates are “sticky” and rent increases lag increases in interest rates, but independent industry sources have recently confirmed an increase in rental yields for sale-leasebacks on new aircraft.
The impact of increases in interest rates is not necessarily the same for all aircraft types and vintages. As aircraft age the mix of a lessor’s cost of sales changes with the interest component reducing and the depreciation component increasing. Also, the book value of an older aircraft is lower, so the overall effect of a rise in interest rates is to increase the competitiveness of used vs new aircraft and vice versa.
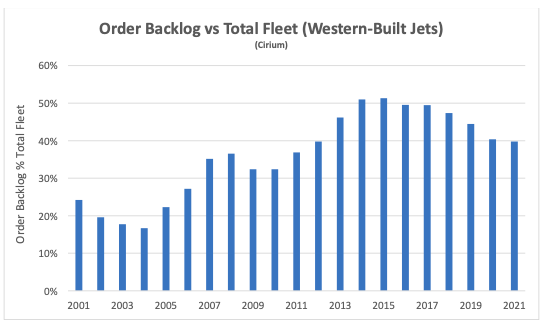
One way to observe this relative effect is to consider the combined impact of fuel prices and interest rates on aircraft orders. Fuel prices are the other side of the coin to interest rates because an increase in the former increases the competitiveness of new aircraft.
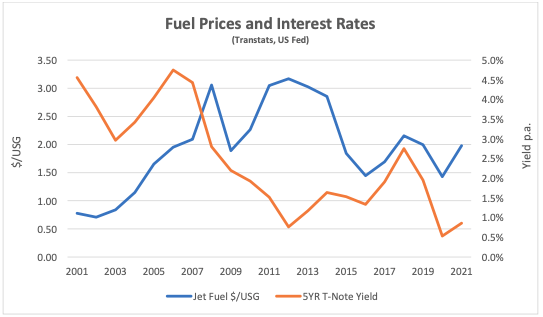
In the early 2000s fuel prices took off after many years in the doldrums, and from the onset of the financial crisis in 2008 until 2015 there was a historically unusual combination of high fuel prices and low interest rates. This created a huge demand for more efficient aircraft which was expressed in a record backlog of aircraft orders.
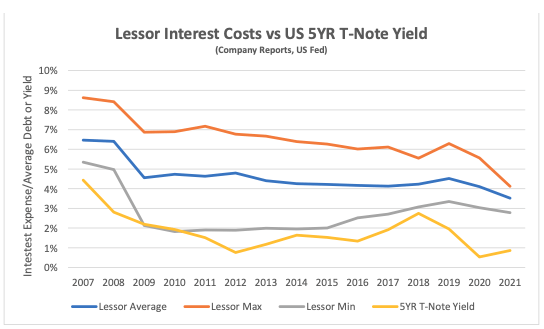
Increased interest rates may modestly improve lessor margins in the short term as lessor interest costs reflect a mix of financings executed over a number of years and move quite slowly. The chart below shows the range of interest costs for up to 16 different lessors from 2007 compared to the yield on the 5 Year US Treasury Note. It demonstrates a wide range around the average cost across all lessors which is driven by differences in size, asset mix, credit rating and access to the capital markets. The changes in the average cost of debt tend to lag market developments as explained above, and a lag as rates increase should be a positive.
The impact of increased interest rates on aircraft trading is proving less positive. Lessors typically sell aircraft subject to an existing lease and buyers evaluate transactions based on a discounted cash flow analysis rather than just looking at the “metal value” of the asset. Most aircraft leases have a fixed monthly rent4 , and when rates increase the trading value of aircraft on a fixed-rate lease goes down, all other things being equal.
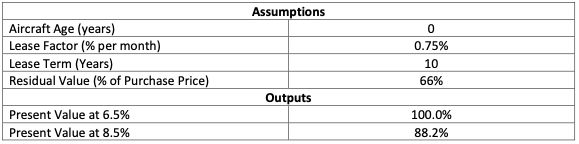
The table below shows an example of the effect on an increase in the discount rate on the trading value of a new aircraft. The residual value is based on a typical industry depreciation policy of writing down an aircraft over 25 years to a scrap value of 15% of purchase price. A 2% increase in the discount rate reduces the value of the aircraft by nearly 12%.
A significant change in trading values tends to disrupt market activity as sellers and buyers take time to recalibrate their expectations, and this has happened in 2022 according to informed market Intestest Expense/Average Debt or Yield
sources. However, if aircraft owners are hedged this should allow trading activity to increase in 2024.
This comment obviously begs a couple of questions
• what does “being hedged” mean? ; and
• what are the mechanics of unwinding hedges to allow trades to proceed?
Lessors appear to take a number of different approaches to managing interest rate risk insofar as one can judge by studying annual reports. The strictest approach to hedging is to target the trading value of a lessor’s assets so that the average life of a lessor’s debt is slightly below its average lease term (aircraft are depreciating assets). Even this is by no means a perfect hedge as different aircraft buyers may not have the same approach to calculating their weighted average cost of capital at different levels of interest rates. The example above implicitly assumes 100% sensitivity to rising rates across the capital structure, whereas buyers often have a equity return target that does not track a particular interest rate benchmark.
Another approach is to focus more on minimising the sensitivity of earnings to changes in interest rates for a number of years without fully matching average lease term. Under both approaches the level of borrowings relative to aircraft also matters. If a lessor is fully matched on debt life vs. lease term this does not mean that it has hedged its trading values if its debt level is way below what would be considered a market level for potential buyers.
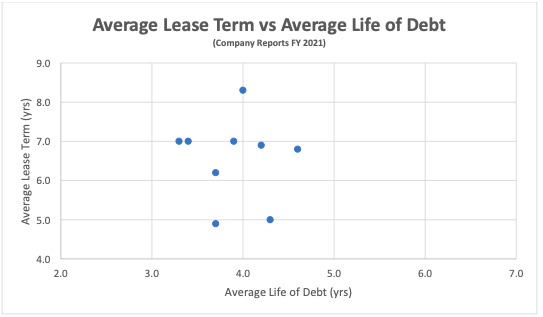
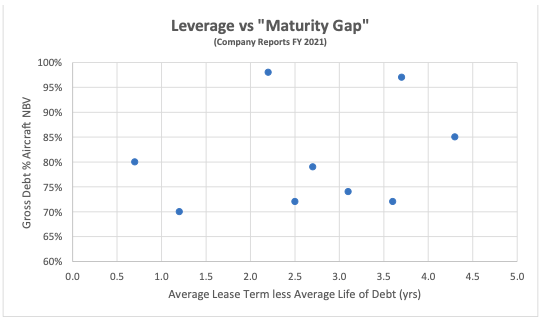
The chart above shows the maturity gap between average lease term and debt life for a number of major lessors. Both axes cover a range of five years and it is clear there is a lot more variability in the former than the latter. Average lease term variation is mainly a function of fleet age as leases on new aircraft have longer tenors than for used aircraft and fleet ages range from 3.9 to 10.2 years old for this group. There is less variation in business fundamentals on the liability side of the balance sheet as all these lessors have investment-grade credit ratings. The narrower range of outcomes on debt suggests that it is relatively inefficient in terms of cost to borrow more on a long-dated basis to increase the average life to over five years.
The chart does not include derivative positions because reading the detail of the company reports suggests that these are mostly used to match fixed rate lease income with floating rate debt and not to change the maturity structure of aggregate debt. Part of the reason for the lack of additional strategic derivative positions to reduce this mismatch is that these would be subject to regular mark- to-market calculations that would impact the income statement, as hedge accounting is generally only allowed for interest rate derivative positions that hedge floating rate debt into fixed rate debt. The figures show that across the industry there is a general robust level of hedging albeit not achieving a full match with average remaining lease term.
Also, it is important to re-emphasise that the level of debt relative to aircraft is just as important to hedging trading value as the maturity mismatch. The market level of debt for a leased aircraft is a subjective judgement, but it is very unlikely to be over 70% today, so the debt levels carried by these lessors also contribute to hedging trading value, in some cases to a very significant degree.
The debt levels discussed above are gross rather than net, and the latter are often much lower. Some lessors carry significant cash balances as part of their overall liquidity position alongside undrawn credit lines. Liquidity is a subject that merits detailed consideration in its own right, but in general lessors entered the pandemic with high levels that allowed them to ride out a short period of higher bond yields and afterwards achieve renewed access to the bank loan and debt capital markets.
The mechanics of monetising hedges to facilitate aircraft trades in the next few years may prove to be quite diverse. If one is unwinding a pay fixed interest rate swap allocable to an aircraft being sold the procedure including the accounting treatment is well-established and straightforward to execute. However since the financial crisis all of these lessors have obtained public credit ratings and have issued significant amounts of fixed-rate notes in the debt capital markets, and it is possible that future hedge unwinds may involve repurchase of debt at a discount as the yield on this debt has increased since it was issued. There is much less precedent for this type of transaction, and there is always the alternative of benefitting from below market interest costs for the remainder of the debt’s tenor rather than buying back, but it would not be a surprise to see this happening quite soon.
[1] ASKs is the acronym for available seat kilometres, which is the product of the number of seats flown and distance flown.
[2] Airbus normally quotes its production rates based on an 11.5-month year for single-aisle aircraft and an 11- month year for twin-aisle aircraft.
[3] Fleet totals are based on Cirium Fleets Analyser data as of November 2022
[4] Some aircraft are leased on a floating rate basis where the rent is adjusted periodically in line with short-term interest rates. The amount of the adjustment calculated to pass on the interest rate cost of the lessor’s debt associated with the aircraft