
- Special Topic – Aircraft Leasing Industry Financial Performance
- Macro-Economic Background
- Traffic and Aircraft Demand
- New Aircraft Supply
- Airline Industry Financial Performance
Aircraft Leasing Industry Financial Performance
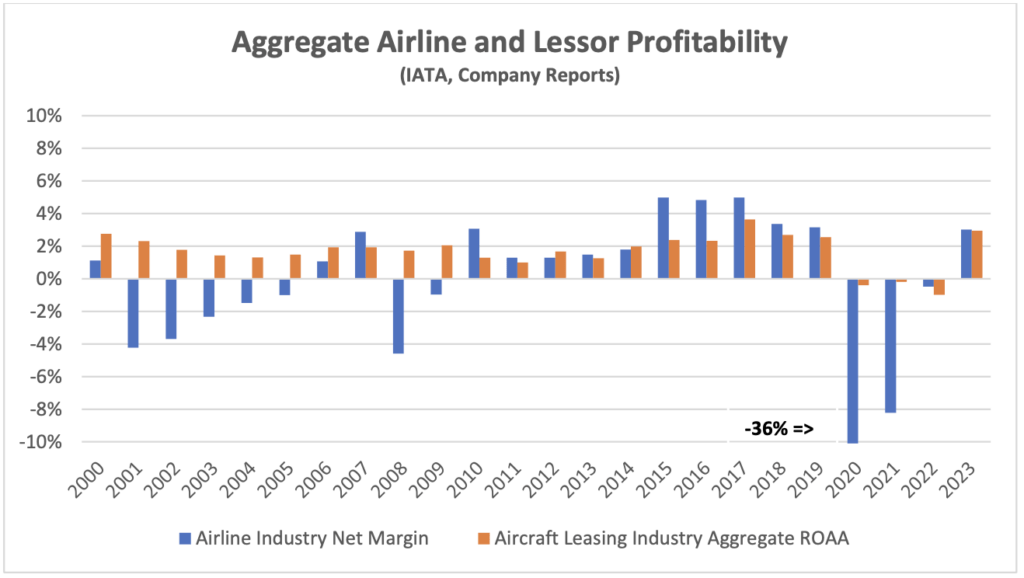
2023 saw a significant improvement in the profitability of the aircraft leasing industry. There were no major asset write-downs such as those incurred because of Covid, and the de facto expropriation of most aircraft leased to Russian airlines in 2022. In fact, several lessors were able to write back some of the latter charges as they received partial insurance settlements. Despite these unprecedented problems the aggregate performance of the industry has been relatively stable, particularly relative to the performance of the airline industry[1].
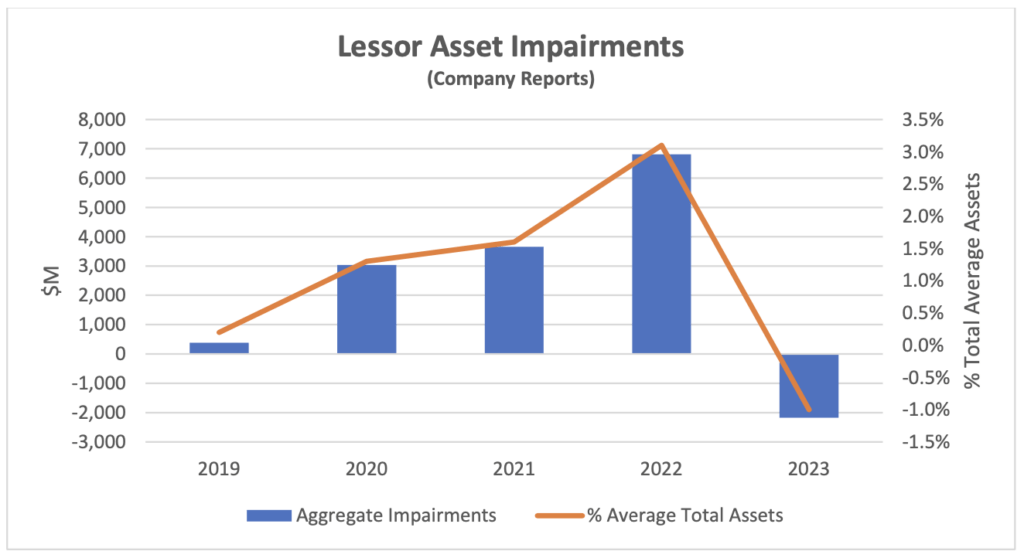
Asset impairments and write-backs have had a huge impact on aggregate industry results since 2020 as shown in the chart below. Insurance settlements in respect of aircraft expropriated by Russia are likely to have a positive impact on results in 2024 and beyond. Most amounts paid to lessors to date have been received from Russian insurers while litigation with western insurers continued. However, AerCap recently settled some of its claims with the latter which may presage more payments. It is a measure of the defensive financial strength of the industry that there has been very little financial distress in this period. Two lessors sought court protection, NAC and Voyager, which both had niche asset strategies based on regional and widebody aircraft respectively. None of the major lessors with more diverse aircraft fleets suffered a credit rating downgrade.
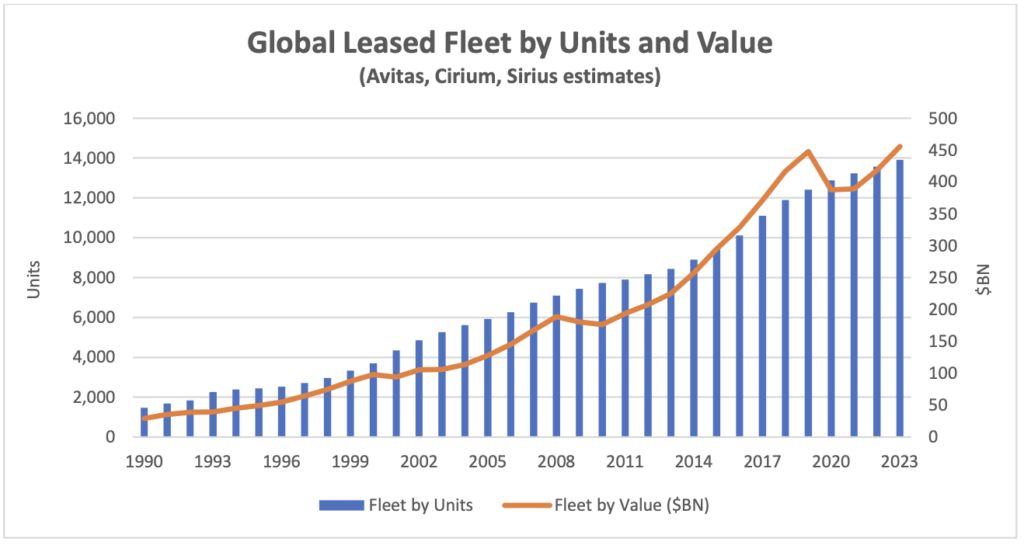
Before we discuss underlying financial performance it’s worth a detour to note some important changes to the industry background for aircraft lessors. First growth in terms of asset value has slowed down. This is mainly due to the disruption of new aircraft deliveries particularly at Boeing which is discussed in more detail below. There has also been some impact from cyclical changes in aircraft values although this has largely worked its way through the system (the chart below uses Avitas Market Values where available). This increases competition between lessors in the new aircraft market as most of them have targets for balance sheet growth although there are fewer deals available.
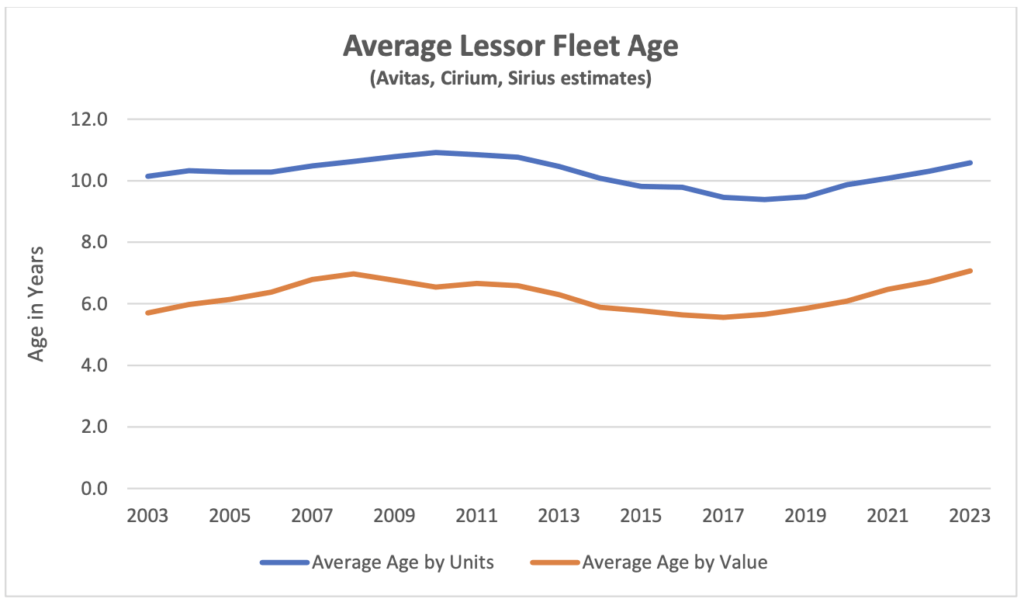
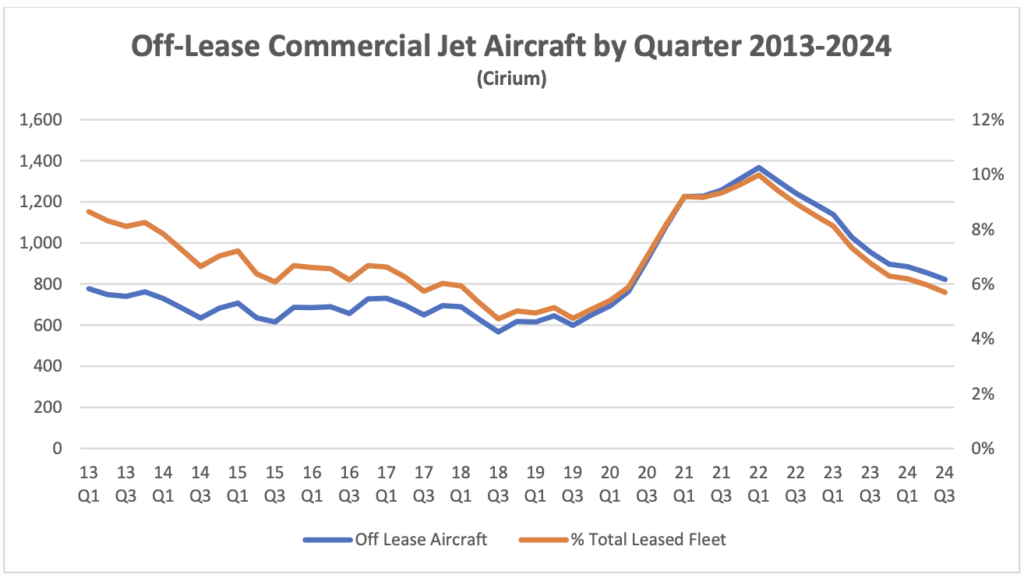
One side effect of the reduced level of new acquisitions is that the lessor fleet is ageing. This matters because an older fleet is likely to have higher levels of off-lease aircraft which may or may not be offset by higher rental income relative to aircraft book value. As the chart below shows age on a unit basis is consistently higher than on a value basis, which is the preferred age metric for analysing lessors. Average age by value is at its highest level in the last 20 years and is likely to increase further given the shortage of new aircraft deliveries.
We believe net lease rental yield is a key measure of underlying performance. This ratio is the net rent earned by the lessor excluding maintenance rent etc. as a percentage of average aircraft book value and is analogous to rental yield in commercial property[2]. The chart below shows the range of yields achieved by the group of lessors we follow over the last ten years. This ratio has started to recover after a significant decline since 2019, but it is not a strong recovery as one would expect a higher yield if only because of fleet ageing.
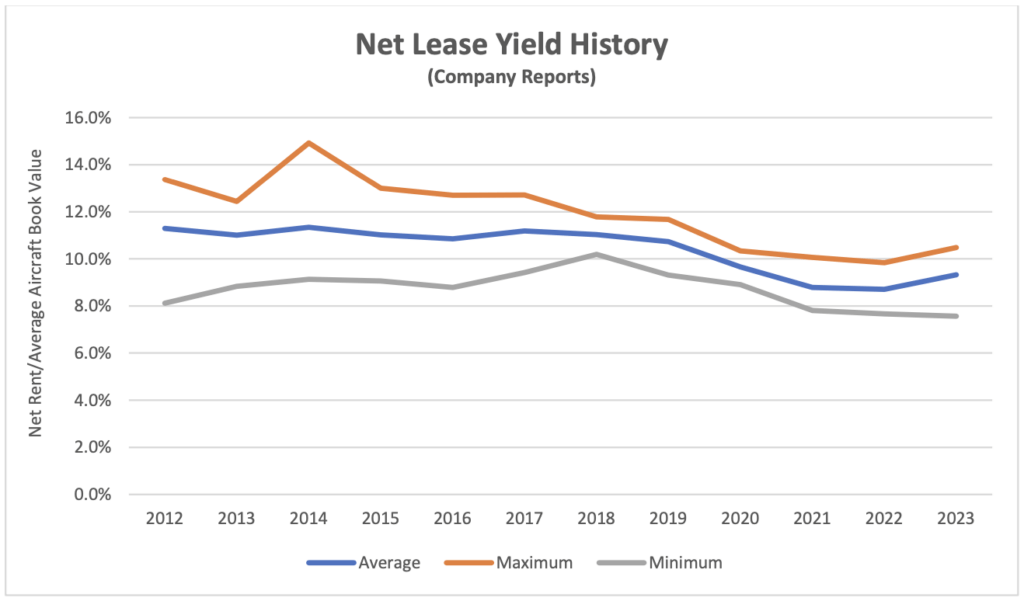
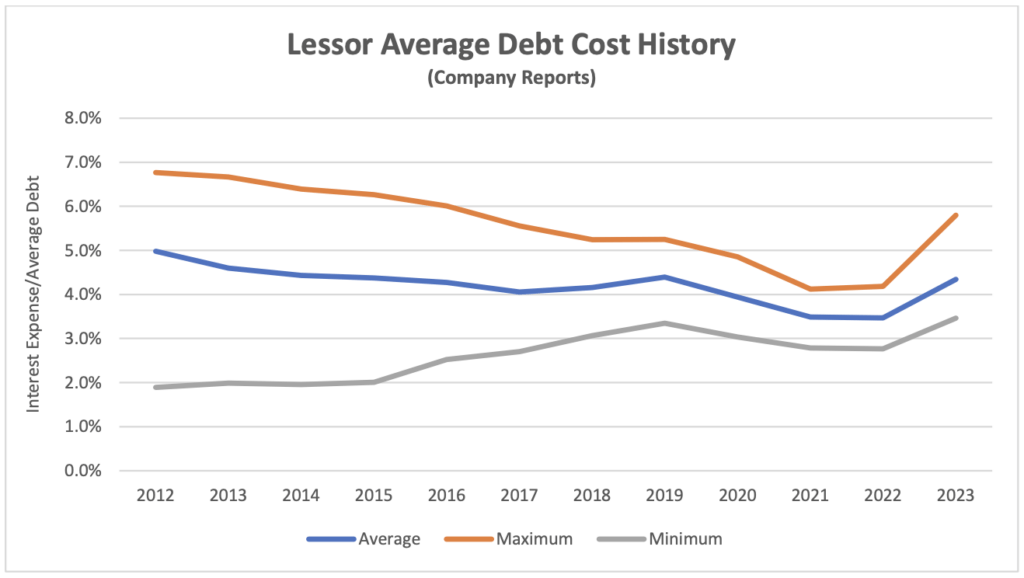
The recovery in yield also needs to be considered in the light of changes in interest costs. Interest expense is a key part of aircraft lessors’ cost of sales – they seek to pass on any increases to their airline customers in higher rents and are likely to pass on decreases by way of lower rents due to competitive pressures. One should not expect changes in interest rates to immediately feed through into aircraft lease rates as the relationship between them is more than a little “sticky” and tends to be hard to identify separately from the impact of changes in aircraft supply and demand. Lessors typically have significant medium-term fixed-rate borrowings to hedge their fixed-rate leases, so their cost of debt is relatively stable. Despite these caveats it would be reasonable to expect a greater increase in rents to have occurred in 2023 given the rise in interest rates and the increased age of the fleet.
The reason for this muted recovery is unlikely to be high levels of off-lease aircraft as these have declined to relatively normal levels after taking into account fleet ageing since 2019. It should be borne in mind that aircraft out of service due to unscheduled engine maintenance remain on lease and accrue rent. It seems plausible that the slow recovery in rental yield is mainly caused by increased competition in the new aircraft market as lessors continue to pursue asset growth.
The level of credit impairments across the industry went negative in 2023, presumably due to reversals of provisions made in prior years. In most cases this is unlikely to be connected to Russian insurance settlements as most identifiable movements relating to these payments have been taken under the asset impairment heading, but there is plenty of scope for recoveries elsewhere.
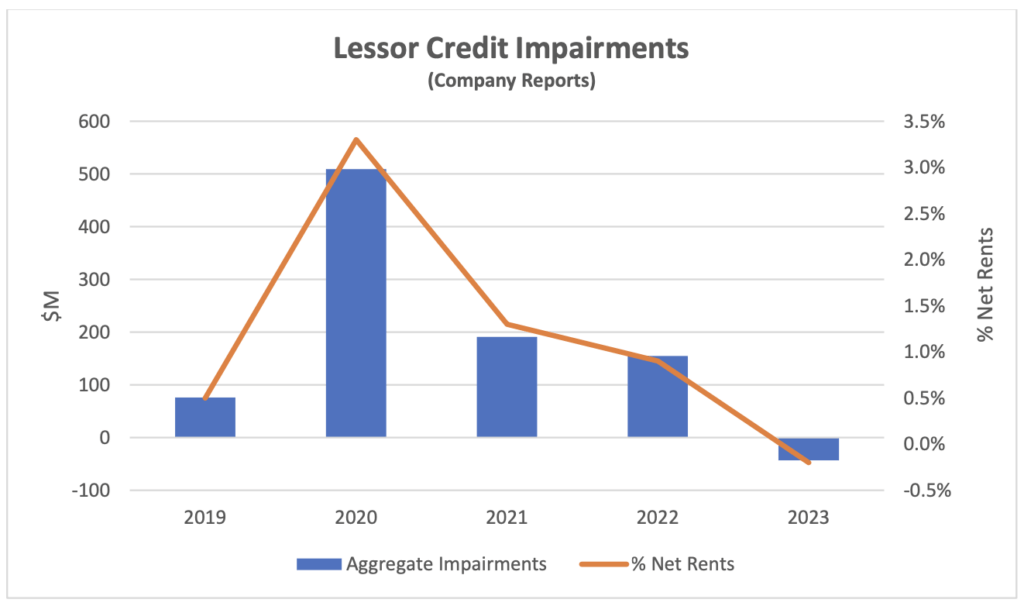
Absent future major shocks we would expect these numbers to remain at low levels in future as was the case before 2020. There are several reasons why this is old and the new normal for the industry. The most important is that early lease termination is a common element of managing a delinquent lessee so rent no longer accrues and therefore does not have to be written off. Lessors are rightly very focussed on the integrity of their assets and associated records so physical possession is more important than “running the meter”, especially with a mobile asset that can be redeployed to earn revenue elsewhere.
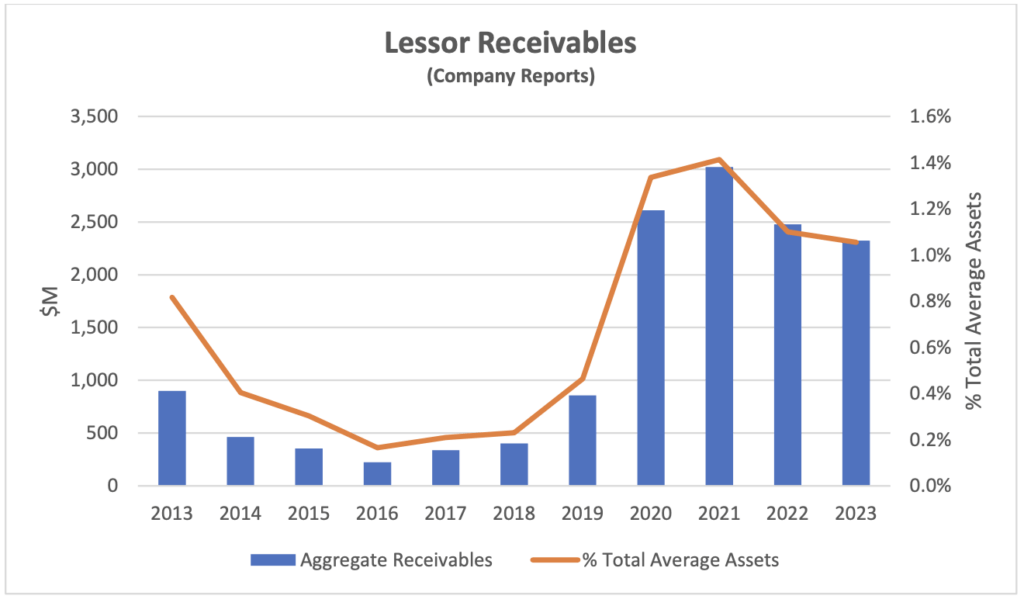
In contrast the level of receivables across the industry remains at a high level compared to 2019. We define receivables broadly and typically include items such as notes receivable as well as overdue rents as the latter often arise when rents are formally rescheduled. At a little over 1% of total assets this does not represent a major threat to the industry but is perhaps surprising given the recovery in airline profitability after 2021. The slow pace of decline is at least partly attributable to new airline restructurings as some lessors have seen an increase in this balance sheet item.
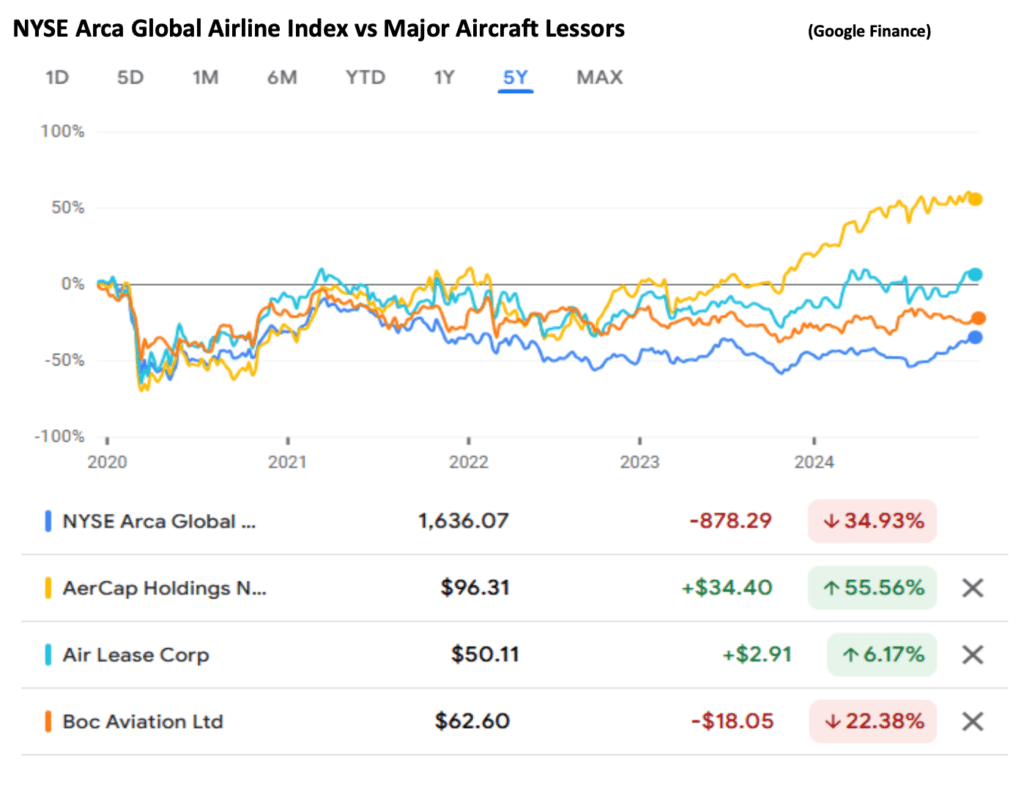
In the long run aircraft lessor stock prices have outperformed most airlines. The chart below compares the performance of the NYSE Arca Global Airline Index with the three largest public aircraft lessors over 5 years. The lessor stocks have significantly outperformed the airline industry during this period which encompasses both the pandemic and Russia’s invasion of the Ukraine.
Amongst the lessors the most notable development is the outperformance of AerCap. It would be easy to attribute this to the acquisition of GECAS, as AerCap’s earlier acquisition of ILFC saw its share price virtually double when the transaction was announced. However, the GECAS acquisition was announced in early 2021 and the outperformance only started in 2023. Another explanation that does not really make sense is business growth as AerCap’s balance sheet has shrunk since 2021 whereas Air Lease and BOC Aviation have both grown.
Where AerCap really differentiates itself from its comps is through its aggressive programme of share repurchases. From 2016 to 2023 AerCap spent nearly $6.5 billion buying back its own shares compared to its 2016 market capitalization of $7.3 billion (its current market capitalization is $18.8 billion). AerCap’s execution of this strategy has been driven by its ability to consistently sell aircraft at a profit, and it has benefitted shareholders as nearly all its share repurchases were at a discount to book value per share. Even now its share price to BV ratio is only a little over 1:1.
Macro-Economic Background
We have mentioned a few times recently that we want to shift the focus of our discussion of world GDP development from a look back to a look forward perspective. Looking back made a lot of sense in the last few years as this kind of data can be subject to major revisions and it was important to capture the overall impact of the pandemic from 2020 through 2024. Any revisions now are very small, so it is time to move on.
The chart below compares the IMF’s forecast for world GDP growth from its October 2024 World Economic Outlook with its three most recent predecessors. The forecast horizon moves forward each year, so it is helpful to create indices that help visualise the rate of change – obviously steeper is better. The 2024 forecast is notably more positive than the previous two years.
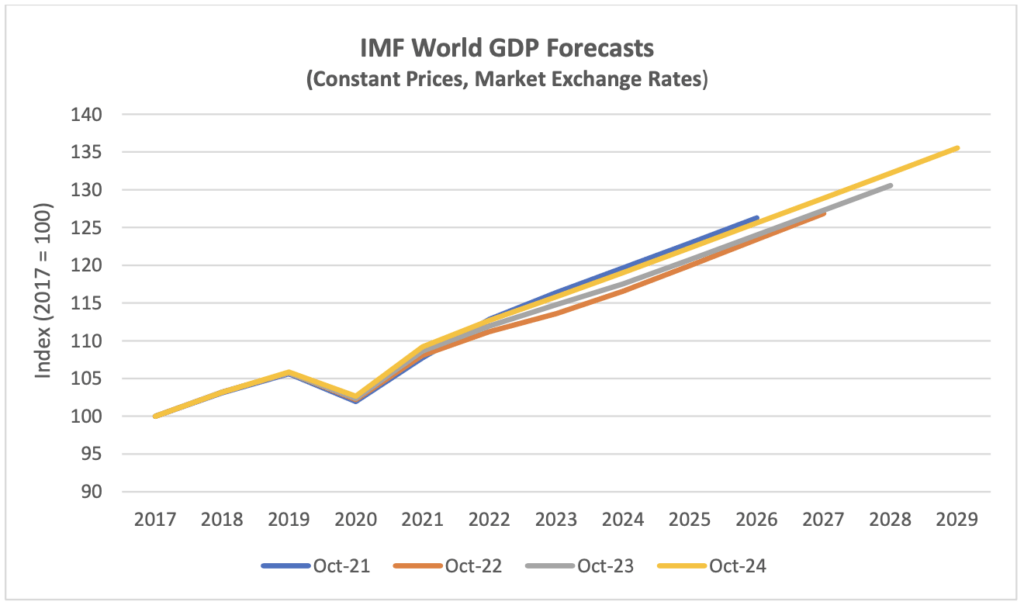
Economic growth is a key driver of long-term growth of air travel. However, since early 2022 its impact has been overshadowed by the fall and recovery in traffic associated with the pandemic. In time the influence of overall economic conditions on air travel is likely to reassert itself, but industry forecasts published by Airbus, Boeing and IATA assume much higher rates of traffic growth than GDP growth over the rest of the 2020s as the former catches up to its long-term trend (see our Q1 2024 Industry Update for a more detailed discussion).
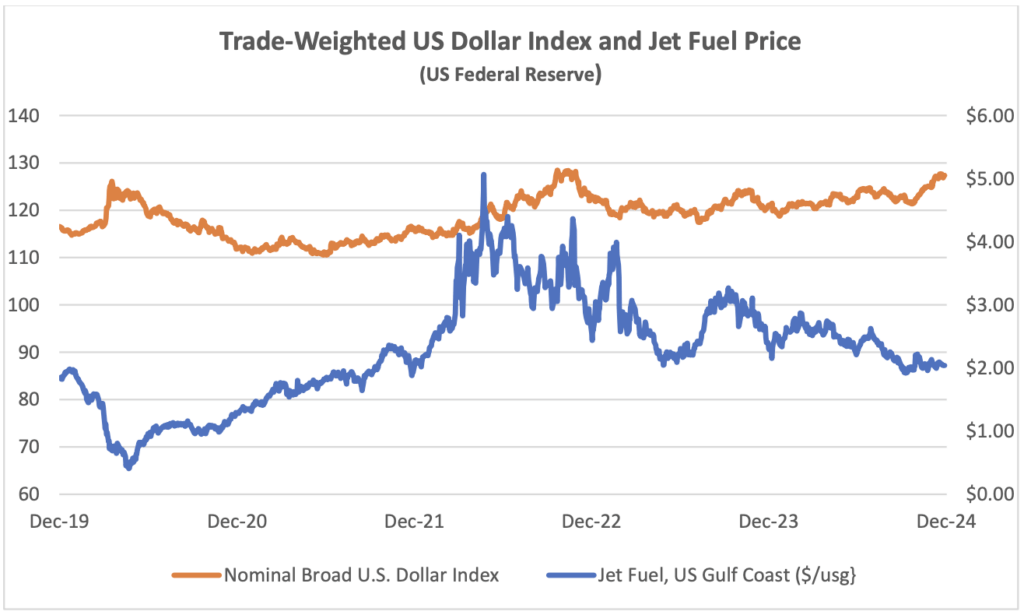
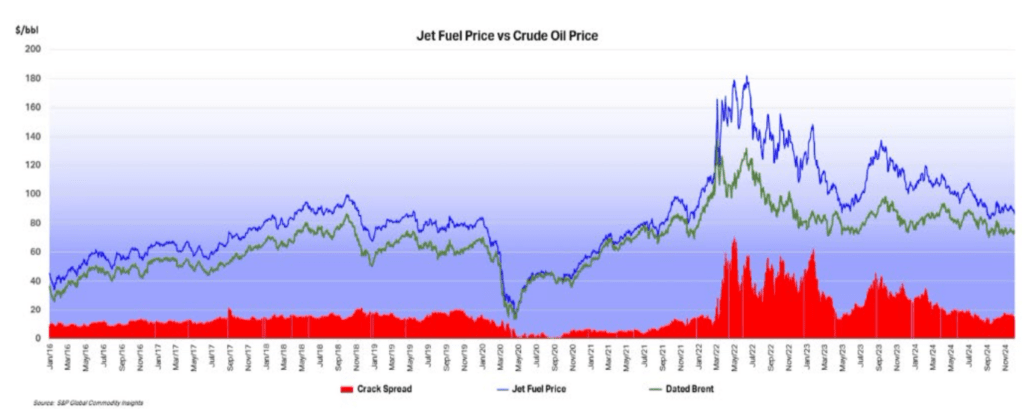
The US Dollar has weakened since its recent peak in September 2022, providing relief for airlines outside the US for dollar-denominated costs such as fuel, aircraft rents and aircraft spares. The price of jet fuel has remained volatile, but it has moderated since February 2024. This reduction has mainly been driven by a reduction in the “crack spread” from c.$30 to c.$13.
Another indicator that is potentially important to aircraft investors is the breakeven inflation rate on US Treasury Inflation-Protected Securities (TIPS). This indicator measures inflation expectations and it matters because used aircraft values are strongly influenced by the cost of new aircraft and over time this cost is linked to US Dollar inflation. In the short term this linkage is driven by escalation clauses in aircraft purchase contracts and in the long term by the general input cost environment for the aircraft manufacturers. The chart below compares the breakeven rate for 10-year and 5-year TIPS.
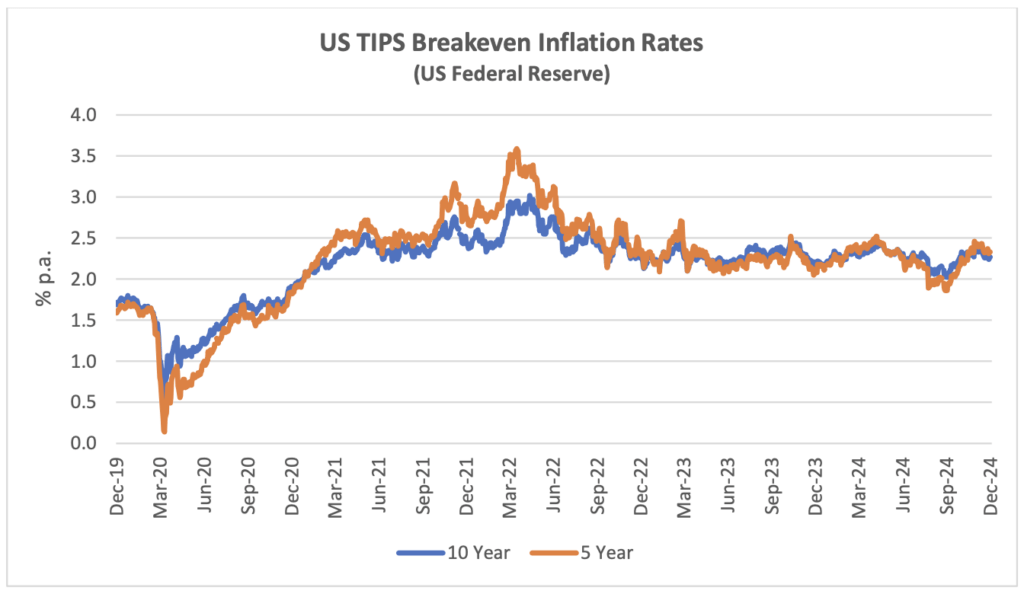
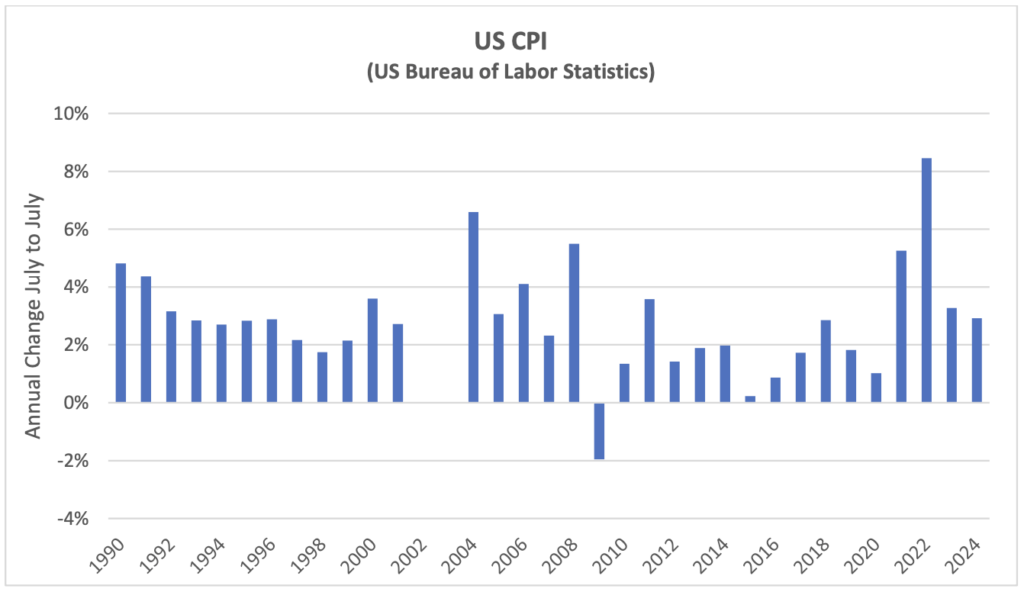
Although medium or long-term inflation expectations have never gone higher than 3.5%, actual inflation experience has been much higher in the last few years. This has led to higher appraised values for new aircraft.
Traffic and Aircraft Demand
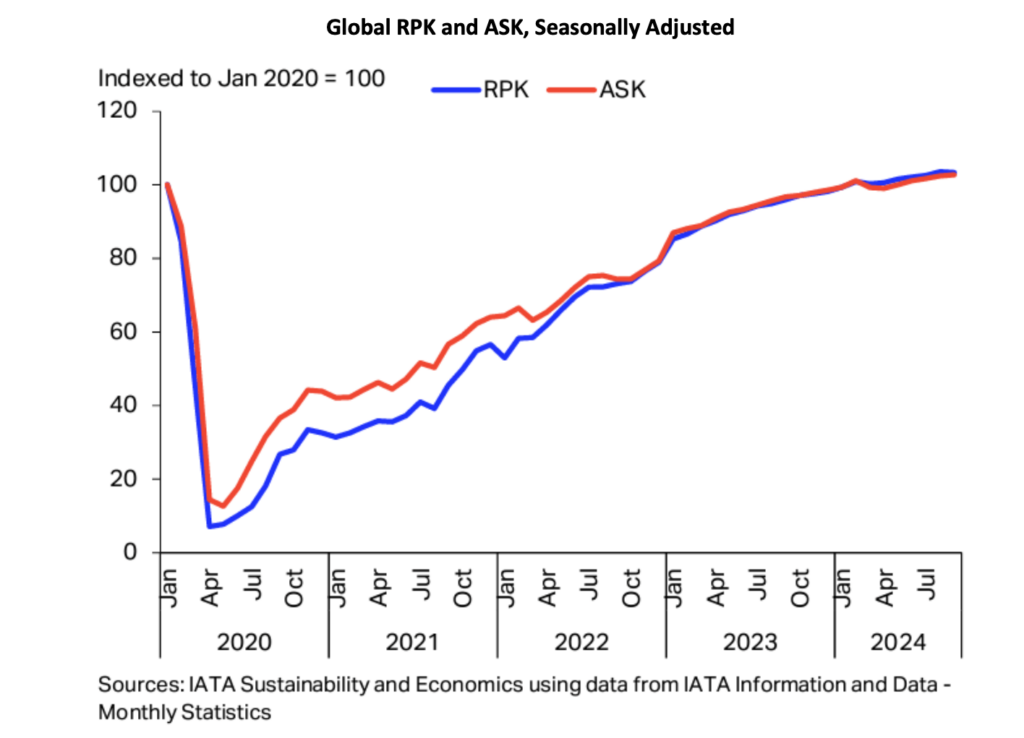
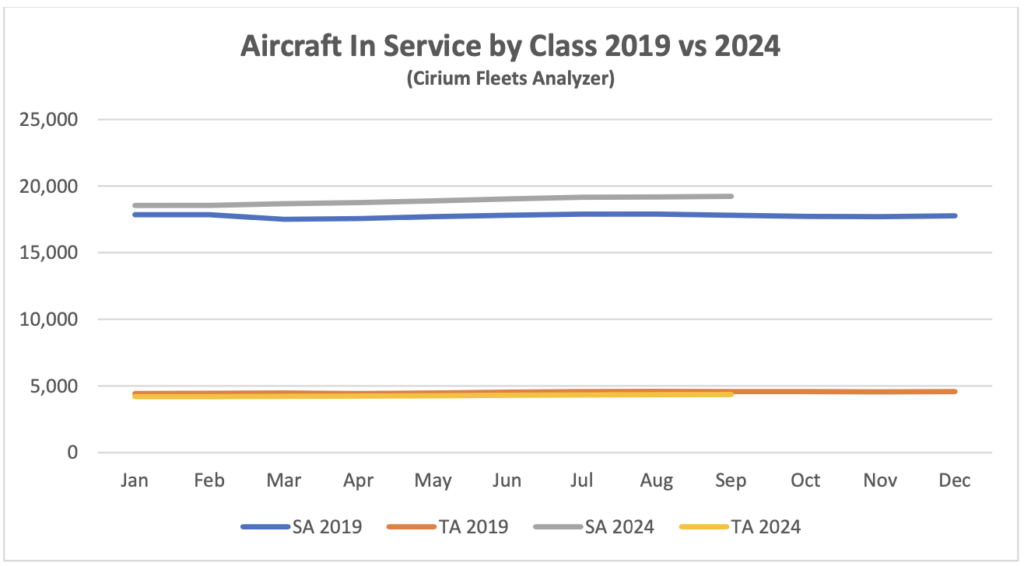
Although some short-haul aircraft serve international routes nearly all long-haul aircraft do so, and this is reflected in the relative demand for single-aisle (narrowbody) and twin-aisle (widebody) aircraft. Aircraft demand can be measured in terms of aircraft in service and ASKs, the standard measure of aircraft capacity deployed by airlines which indicates how intensively aircraft are being flown. Single aisle aircraft demand on both metrics is higher so far in 2024 than in 2019 whereas twin-aisle aircraft are marginally weaker by aircraft in service and lagging more in terms of ASKs. The difference between the two metrics may be down to the gradual move away from very large aircraft such as the B747 and A380 towards the smaller B787 and nA350, resulting in fewer ASKs per aircraft unit. It is hard to see the TA 2024 data series because it is only very marginally lower than TA 2019.
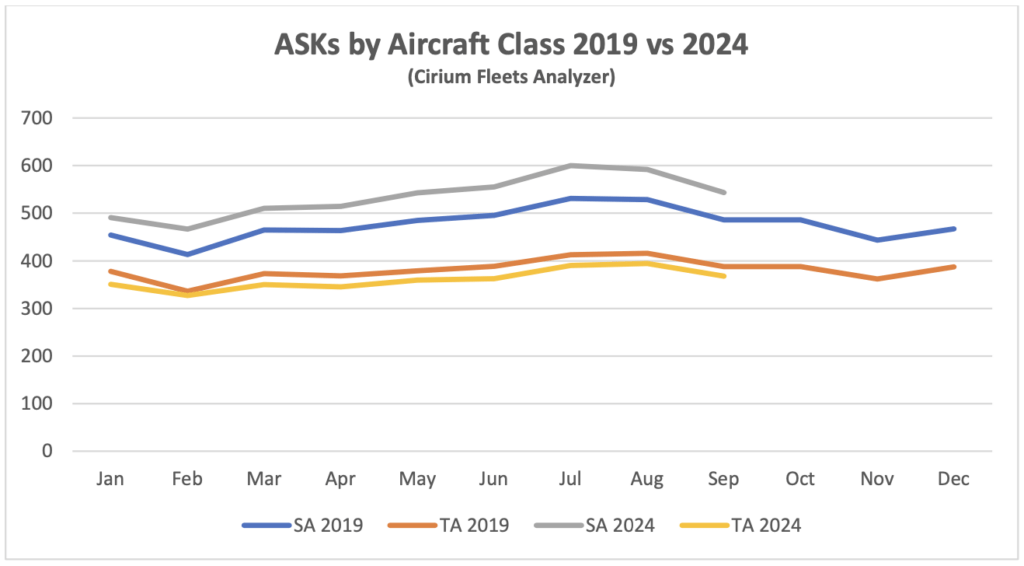
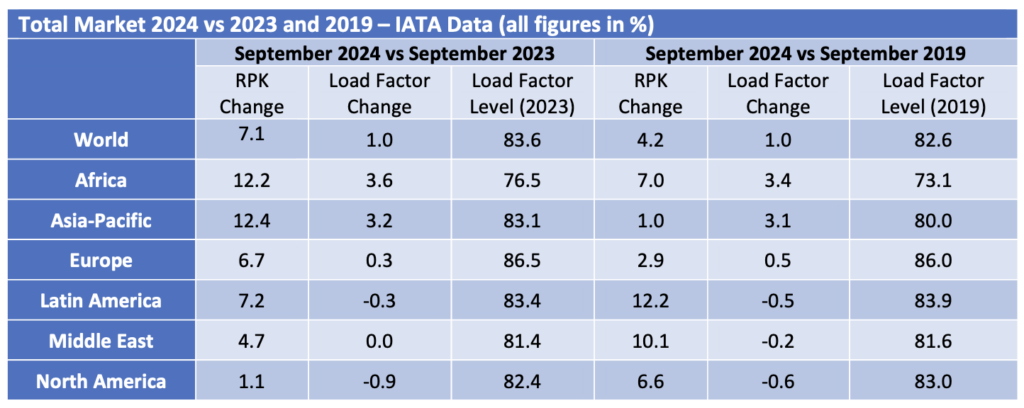
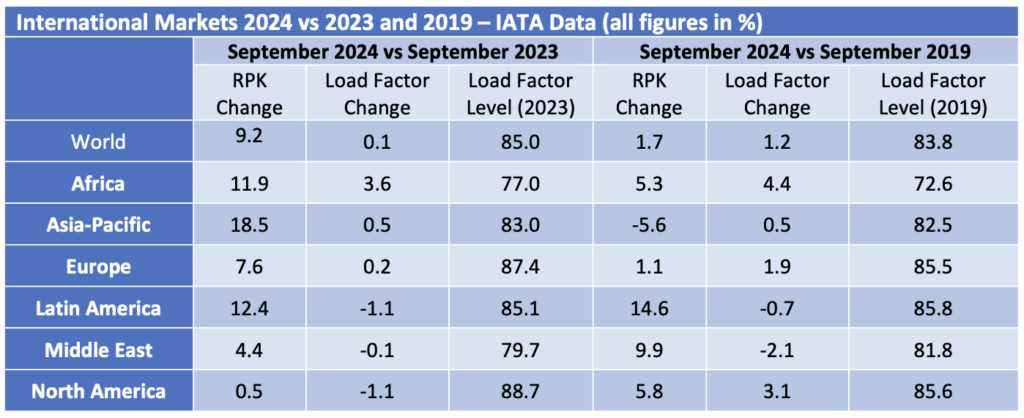
Full recovery has yet to be achieved for twin-aisle aircraft, mainly due to weak traffic to and from, and within the Asia-Pacific region. The figures by region in the tables above are based on airline domicile, so weak Europe to Asia traffic reduces recorded international RPKs in other regions. Twin-aisle aircraft in service has shown a greater improvement relative to 2019 than ASKs which suggests that aircraft are being returned to service with lower utilisation in anticipation of continued recovery.
New Aircraft Supply
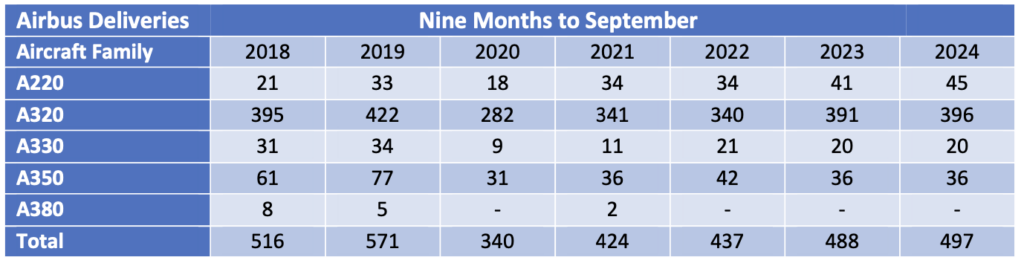
Airbus continues to guide total deliveries for 2024 at 770 commercial jets compared to 735 in 2023 although deliveries for the first nine months were only slightly higher at 497 vs 488. Chief executive Guillaume Faury stated during the 9 months Airbus results announcement that “We are struggling with more pragmatic issues as we speak now in 2024 for reaching the 770 (target)”. Single-aisle engines, cabin equipment and aerostructures are the main supply chain bottlenecks. On a more positive note, the first A321XLR delivered to Iberia at the end of October.
The latest announced status of Airbus’s production plans is:
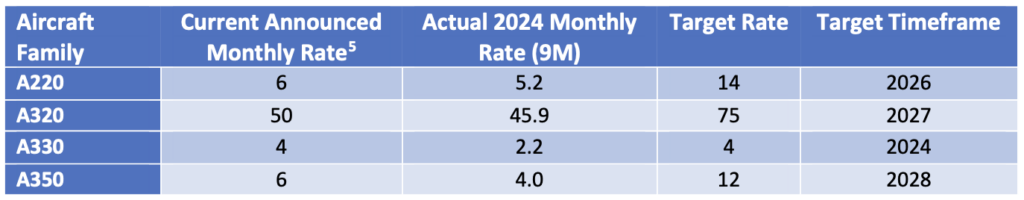
Previously announced production plans included an interim target for A320 production of 65 per month but this was not mentioned as part of the most recent update. Although actual production rates to date are below current announced production rates Airbus normally delivers most aircraft in the fourth quarter, so they are likely to catch up by year end for most types.

Boeing suffered another disruption to its aircraft production activity when its machinists went on strike in September. There are reports that 737 Max production restarted in early December after the strike was resolved in November, although Boeing has not confirmed this. At the end of Q3 Boeing held an inventory of 60 B737-8 aircraft produced prior to 2023 compared to 175 at the start of the year, plus 35 -7 and -10 variants awaiting certification. B787 production has also been hit by the strike as well as supply chain problems and rework requirements. Inventory reduced from 50 at the start of the year to 30 at the end of Q3. The inventory reductions show that Boeing is struggling to deliver “new build” aircraft so far this year.
Boeing has stopped providing official production guidance. Its long-term target for B737 production is 56 per month but this is clearly several years away, and, in the meantime, production is capped at 38 a month by the FAA until it is happy that the manufacturer has resolved the quality control lapses that caused the door panel of an Alaska Airlines B737-9 to detach in flight last January. Several analysts have written that production will be at very low levels for some time. B787 production will also take time to build back towards Boeing’s target of 5 per month.
Boeing has also pushed back target entry into service dates for its new B777 models with B777-9 EIS now 2026, B777-8F 2028 and B777-8 2030.
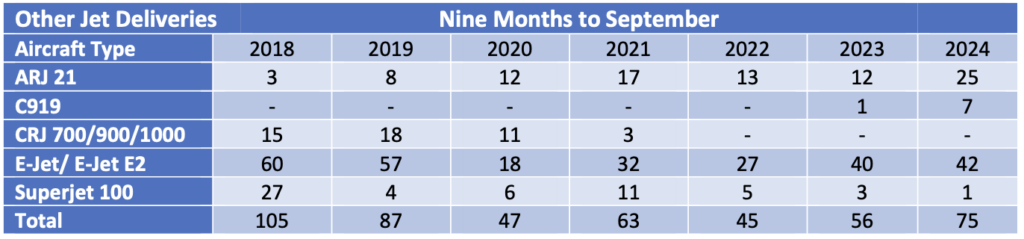
The number of commercial jets delivered by OEMs other than Airbus and Boeing remains subdued. COMAC of China achieved a significant increase in ARJ 21 and C919 deliveries and slightly ahead of 2023.
Airline Industry Financial Performance

Airline shares have caught up with the broader stock market with a very strong Q4 so far. This is mainly due to strong performance by the US network airlines (United in particular) on the back of strong premium travel demand and moderating fuel prices.
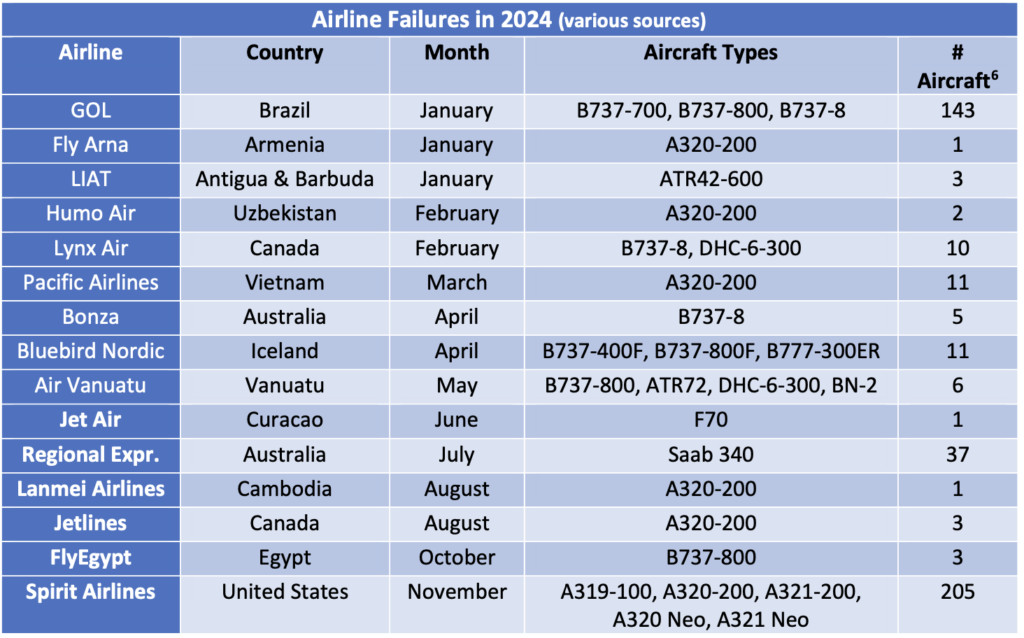
Ironically enough November also saw the largest airline bankruptcy of 2024 when Spirit Airlines filed for Ch. 11. Along with other US low-cost airlines Spirit has suffered from a switch in US passenger demand towards international travel and more effective competition from the large network airlines. It has also had to deal with the need to ground a significant proportion of its fleet due to unscheduled maintenance on its Pratt & Whitney GTF engines. It reflects the strength of aircraft demand that Spirit management have said their bankruptcy restructuring objectives relate only to their obligations to shareholders and bondholders rather than lessors and other financiers.
The other large airline failure this year occurred when GOL of Brazil filed for US bankruptcy protection in January. This was not a major surprise as GOL’s major competitors Avianca and LATAM had already done so during the pandemic and GOL had engaged in significant financial restructuring in the same timeframe.
[1] Sirius has created the time series of aggregate aircraft leasing industry returns by based on public financial information in respect of the following companies: AerCap, Aircastle, Air Lease Corp., ALAFCO, Aviation Capital Group, Avolon, AWAS, BOC Aviation, CDB Aviation, DAE Capital, Fly Leasing, GECAS, Genesis Lease, ILFC, Intrepid/Voyager, Nordic Aviation Capital and SMBC Aviation Capital. We have excluded NAC from our calculations for 2022 because their net income includes a $2.6 BN gain on restructuring of financial liabilities and some other large one-off items.
[2] For the purposes of calculating net rental yield we include assets such as maintenance rights and lease premiums in aircraft book value as both these items are allocations of amounts paid for used aircraft and their exclusion would inflate net lease yield compared to aircraft bought new. We have excluded ALAFCO and NAC from these calculations
– ALAFCO has been subject to an orderly wind-down in recent years and this has made this ratio very volatile due to the timing of aircraft sales.
– NAC’s bankruptcy involved very substantial aircraft impairments relative to its total aircraft book value which have distorted this ratio.
[3] RPKs is the acronym for revenue passenger kilometres, which is the product of the number of paying passengers times distance flown.
[4] ASKs is the acronym for available seat kilometres, which is the product of the number of available seats flown times distance flown.
Disclaimer
This Presentation has been made to you solely for general information purposes and is not intended to provide, and should not be relied upon for legal, tax, accounting, investment, or financial advice. This Presentation is not a sales material and does not constitute or form any part of any offer, invitation or recommendation to the recipient, its affiliates or any other person to underwrite, sell or purchase securities, assets or any other product, nor shall it or any part of it form the basis of, or be relied upon, in any way in connection with any contract or transaction decision relating to any securities, assets or any other product. None of Sirius, its affiliates or shareholders shall have any responsibility or liability to the recipient, its affiliates, shareholders or any third party in relation to this Presentation or any other document or materials prepared by Sirius or its affiliates, officers, directors, employees, advisers or agents. Sirius and its affiliates, officers, directors, employees, advisers and agents have taken all reasonable care to ensure that the information contained in this Presentation is accurate. Neither Sirius nor any of its affiliates, officers, directors, employees, advisors or agents has any obligation to update this Presentation. Under no circumstances should the delivery of this Presentation, irrespective of when it is made, create an implication that there has been no change in the affairs of the entities that are the subject of this Presentation. This Presentation may be updated and amended by a supplement and, where such supplement is prepared, this Presentation will be read and construed with such supplement. The statements herein which contain such terms as “may”, “will”, “should”, “expect”, “anticipate”, “estimate”, “intend”, “continue” or “believe” or the negatives thereof or other variations thereon or comparable terminology are forward-looking statements and not historical facts. No representation or warranty, express or implied, is made as to the fairness, accuracy or completeness of such statements, estimates and projections. The recipient should not place reliance on any forward-looking statements. Neither Sirius nor its affiliates undertakes any obligation to update or revise the forward-looking statements contained in this Presentation to reflect events or circumstances occurring after the date of this Presentation or to reflect the occurrence of anticipated events. The information set out in this Presentation has been prepared by Sirius based upon various methodologies and calculations which it believes to be reasonable and appropriate. Past performance cannot be a guide to future performance. In preparing this Presentation, Sirius has relied upon and assumed, without independent verification, the accuracy and completeness of all information available from public sources or which was provided to it or otherwise reviewed by it. This Presentation supersedes and replaces any other information provided by Sirius or its affiliates, officers, directors, employees, advisers or agents in respect of the content of the Presentation. No information or advice contained in this Presentation shall constitute advice to an existing or prospective investor in respect of his personal position. None of Sirius, its affiliates, its or its affiliates’ officers, directors, employees or advisers, connected persons or any other person accepts any liability whatsoever for any loss howsoever arising, directly or indirectly, from this Presentation or its contents.