
- Special Topic – Aircraft Trading Update
- Macro-Economic Environment
- Traffic and Aircraft Demand
- New Aircraft Supply
- Airline Industry Financial Performance
Aircraft Trading Update
It is a cliché to point out that there is no “ticker” in the aircraft market. A result of this lack of transparency relative to some other asset types is the temptation to fall back on anecdotal evidence of market activity, which obviously runs the risk of confirmation bias, groupthink and other distortions.
One source of real data is aircraft lessor financial statements which provides details of aircraft sales revenue and normally units sold as well. The chart below shows aircraft sales revenue for ten companies that could reasonably be classed as “new aircraft lessors”, which is to say that most of the aircraft they acquire are new or nearly new. The only significant exception is AerCap which has grown in part through the acquisition of competitors such as ILFC and GECAS, although these mature businesses were also built on the acquisition of new aircraft.
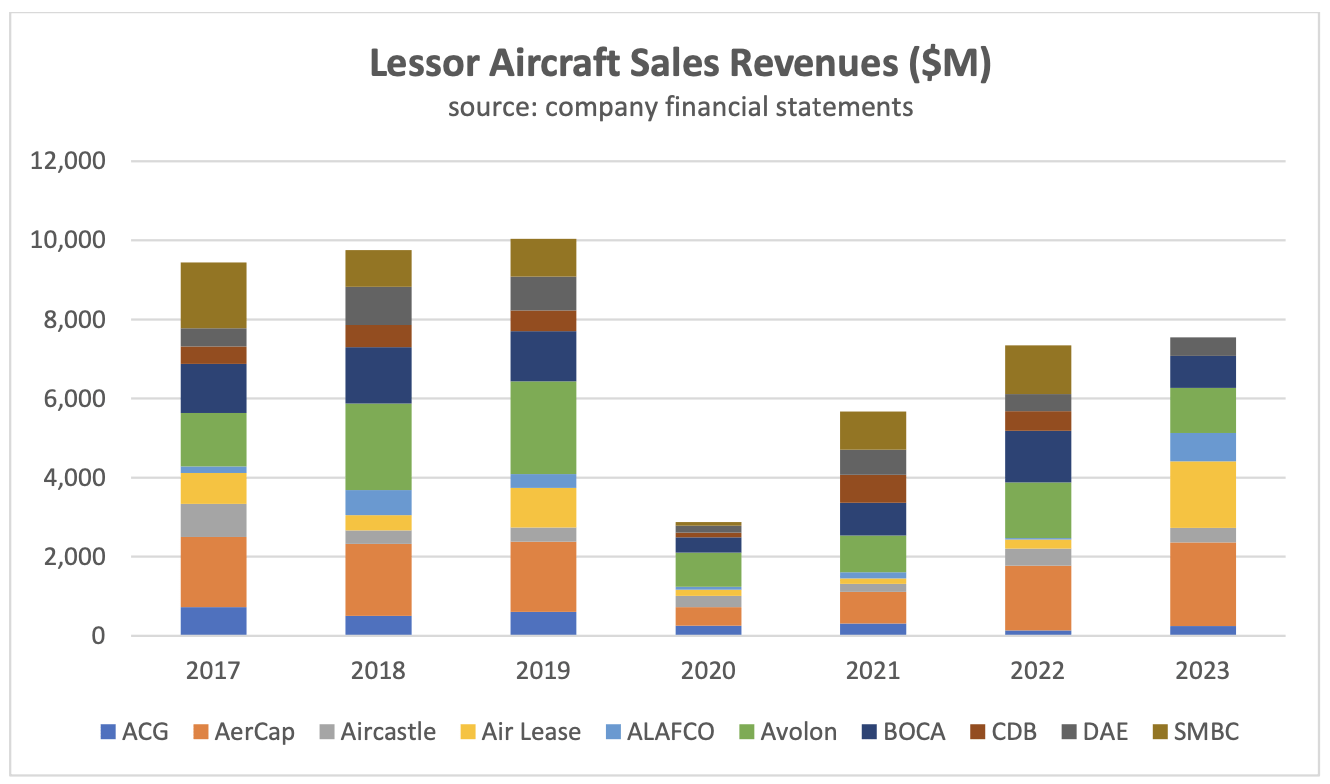
The chart shows the impact of the pandemic on trading activity. The sharp reduction aircraft sales revenues was driven by two key factors:
- A large proportion of the aircraft sold by these lessors are subject to lease and the sales process typically requires lessee (airline) co-operation. In 2020 and 2021 many airlines sought rent deferrals, and it would not have been practical for lessors to seek consent to an aircraft sale whilst simultaneously negotiating a rescheduling.
- Potential buyers of aircraft sought more attractive economics but there was little lessor appetite to sell at a loss, so the market largely failed to clear. None of the lessors featured in the chart suffered any material downgrade to their credit ratings because of the pandemic and they all had large liquidity buffers so they could afford to sit the market out.
The market has gradually recovered since 2020 although it has yet to return to pre-pandemic levels. There is some understatement of activity in 2023 as CDB and SMBC have yet to publish their financials, but this is offset by GECAS trading activity being included as part of AerCap and a large one-off asset sale by ALAFCO.
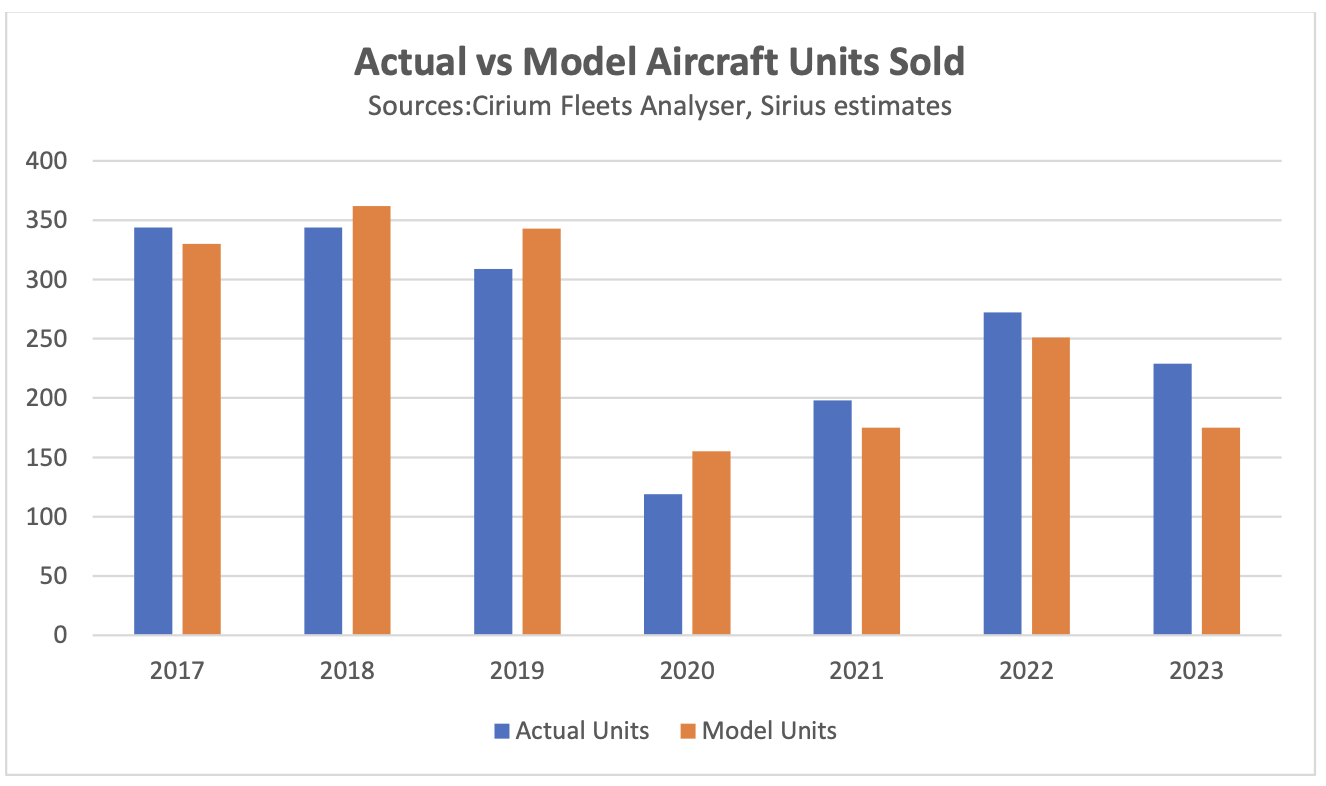
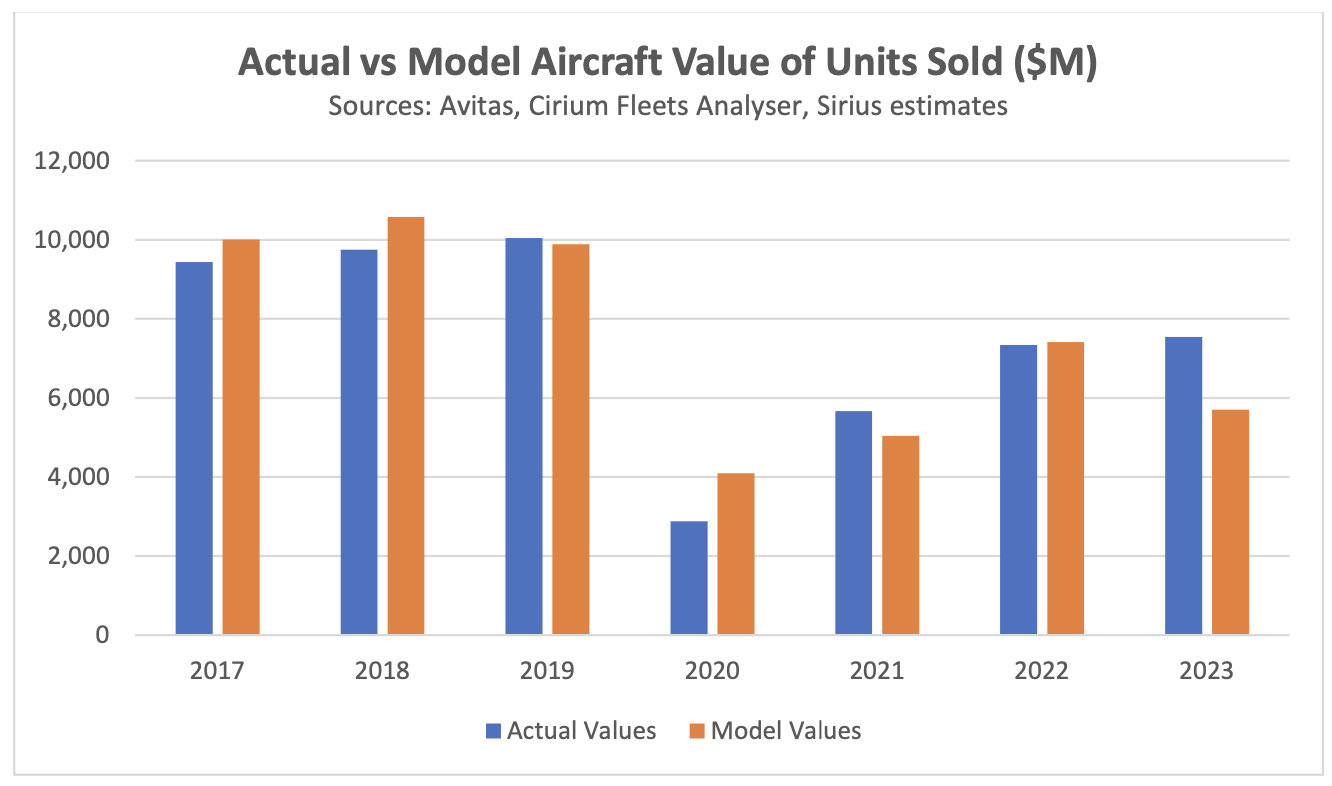
Given the limitations of this approach we thought it might be worth trying to use alternative data sources to get a better sense of the overall market. Our approach was to use data on the number of aircraft trades from Cirium Fleets Analyser combined with historical values from the Avitas Blue Book. There are a lot of reasons why this approach is not going to tie out too closely to the numbers from the financial statements, principally:
- It is challenging for data providers like Cirium to capture which aircraft are owned rather than managed by lessors as many aircraft are held in special-purpose companies which may or may not be owned by the lessor. We have assumed all aircraft managed by a lessor are also owned as we believe this is the “least bad” approach.
- The timing of a sale for accounting purposes may not coincide with the actual transfer of title and there may be delays in making the regulatory filings that allow data providers to identify a transaction.
- Avitas Blue Book values generally assume an aircraft is in a “half-life” maintenance condition whereas real world transactions reflect actual maintenance status and/or the impact of a lease in place.
The two charts below compare the “Actual” numbers in the financial statements with the numbers derived from our methodology which we refer to as the “Model” numbers. We have shown these numbers in the aggregate for all ten lessors and on this basis the two approaches tie out reasonably well, although there can be greater divergences at the level of the individual lessor. The relatively big shortfalls in the model vs actual figures by units and value in 2023 may reflect the impact of reporting delays as discussed above.
It seems reasonable to conclude that the Model approach is a reasonable basis for looking at the broader aircraft trading market although it’s probably best considered a guide to the direction of travel rather than an exact record.
The kind of aircraft trading discussed above is a subset of the larger overall aircraft trading market. Cirium classifies aircraft purchases as:
- Purchase (no lease involved)
- Sale and leaseback on delivery
- Sale and leaseback
- Purchase subject to lease
- Securitization
Most of the sales by large lessors consist of aircraft subject to lease or securitizations. We have filtered the securitisation transactions to eliminate those which are financings rather than transfers of economic ownership. This is mainly a function of whether E notes were issued along with senior debt, but we have also researched industry publications and pre-sale reports. We have also eliminated some non-commercial aircraft types and there are some gaps in the value data available, but we still capture c. 90% of transactions overall and our coverage improves to more than 90% over time.
The charts below show historic aircraft trades from 1990 by category, units and value.
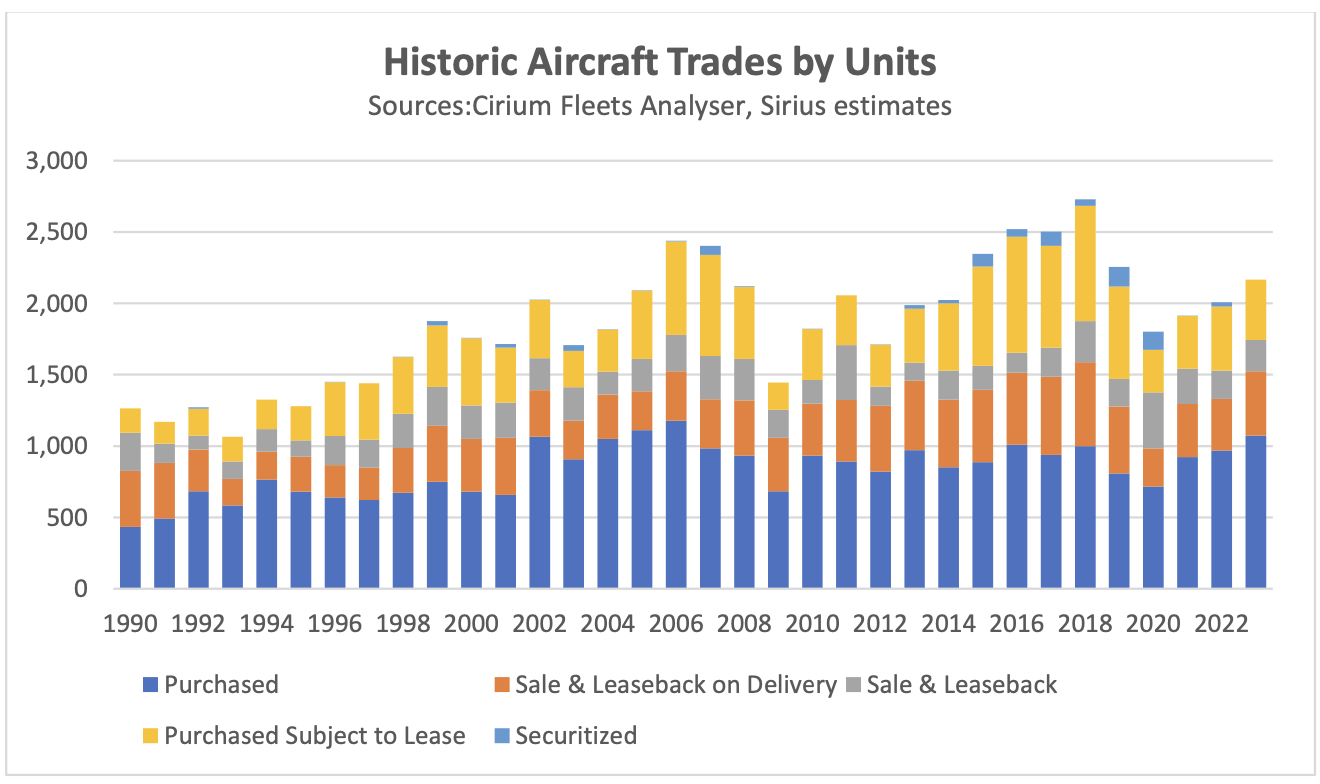
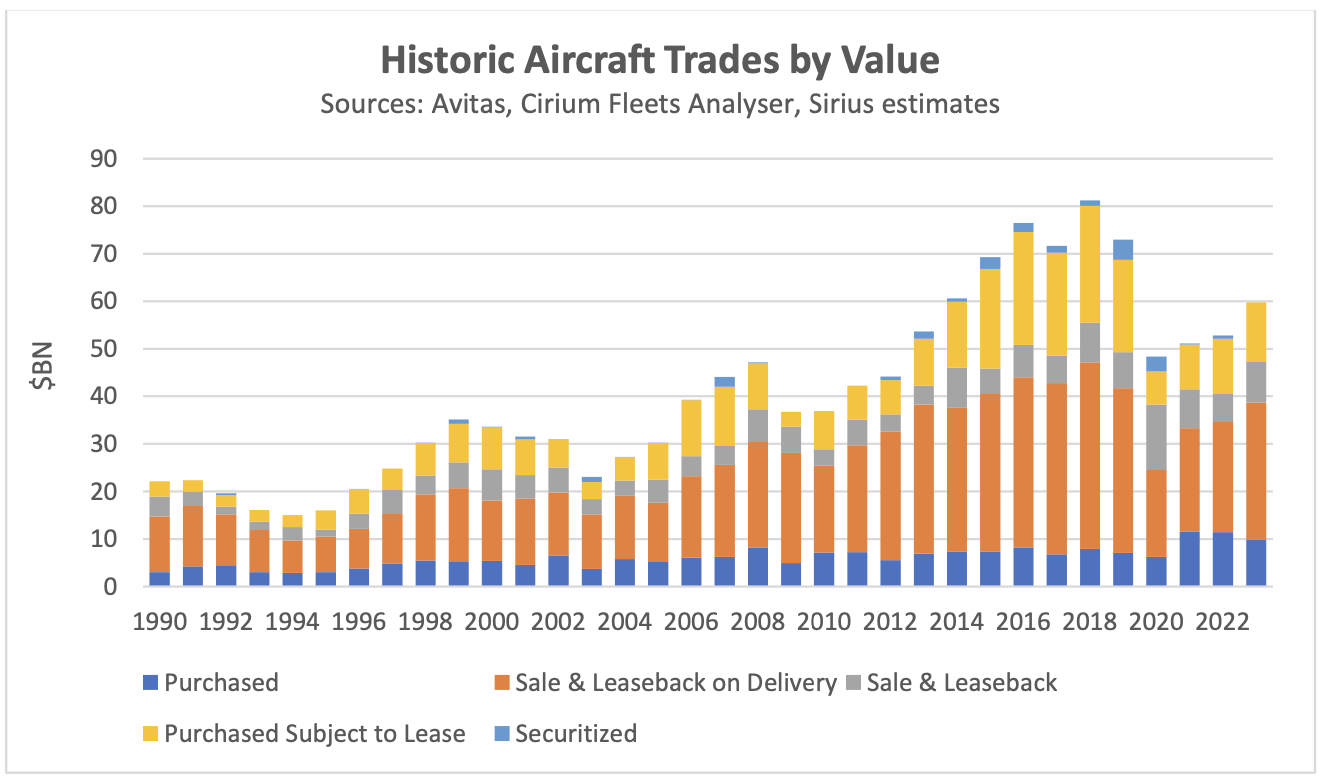
There is a striking difference between market shares for some transaction types based on value and units. Sale and leasebacks on delivery have very high unit values as they involve brand new aircraft and purchases with no lease attached tend to involve older aircraft with correspondingly low values. The other transaction types have relatively similar market shares by both units and value as they generally involve mid-life aircraft.
The transaction participants are mostly the kinds of companies one would expect. Most sellers in all sale-leasebacks are airlines and the buyers are financiers, principally operating lessors. Most sellers and buyers of aircraft subject to lease are operating lessors and in securitizations the sellers are typically operating lessors and the buyers special purpose companies.
Purchases with no lease attached are more varied. Airlines account for between 40% and 45% of sellers by units and value but only c. 30% of buyers. Financiers including lessors account for 50% to 60% of sellers and buyers by both units and value, and the lower airline share of purchases is made up of a mixture of non-airline aircraft operators (air taxi, military etc.) and MROs.
A key conclusion from this analysis is that the market for used aircraft trades is much larger than implied by an analysis based only on the financial statements of major lessors. Our final chart compares the overall market by value with this sub-set. This is true even if one excludes purchases without a lease and sale-leasebacks of used aircraft which are not a significant part of the large lessors’ sales offering.
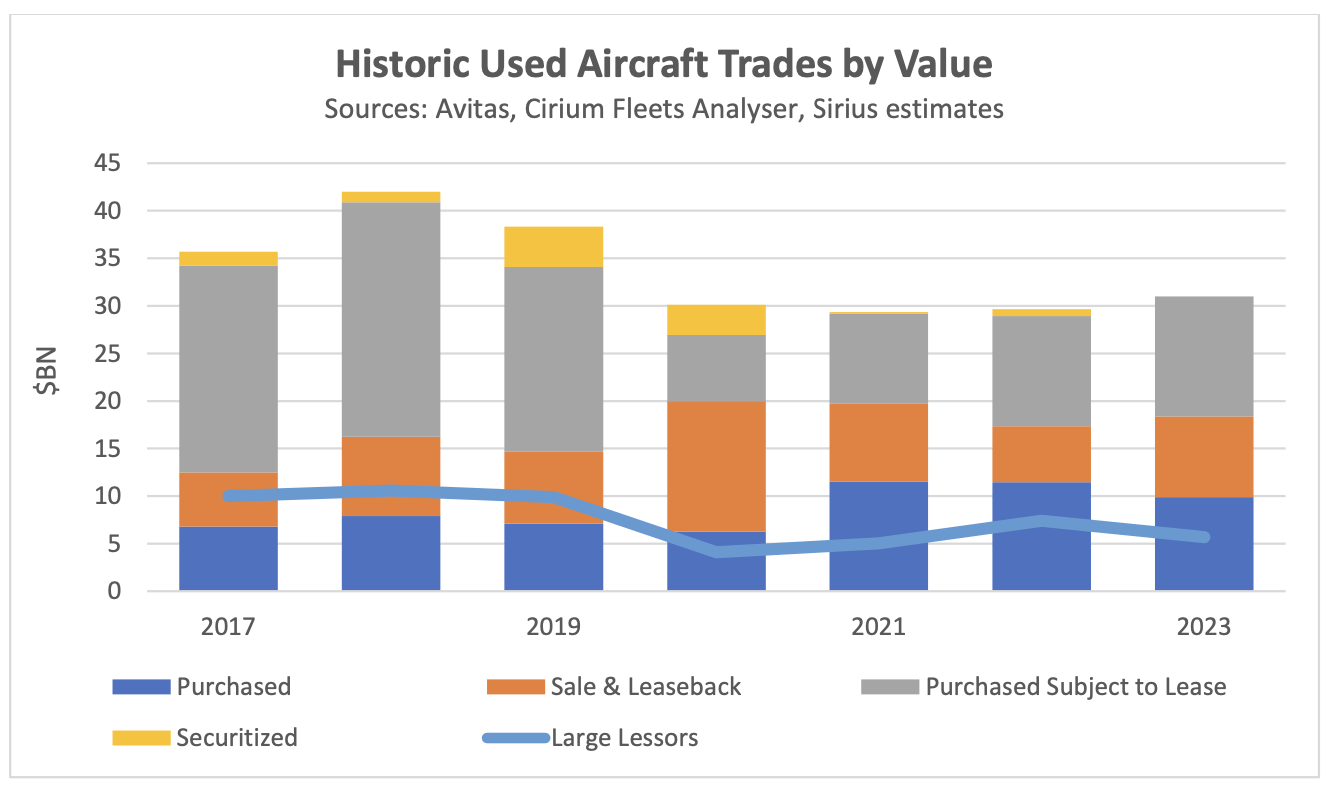
It is also clear that the cyclicality in the trading activity of large lessors is also present in the overall market, although the reasons for lower trading activity in downturns may not be the same for other market participants.
Macro-Economic Environment
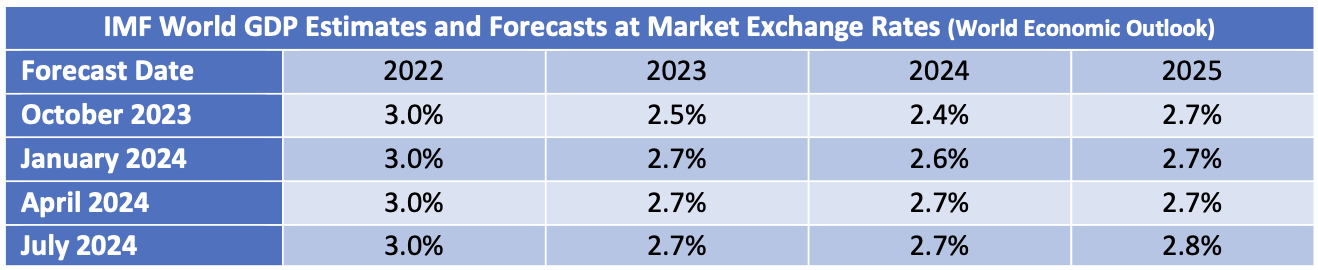
As we discussed in our Q1 2024 industry update we have changed our GDP focus from the retrospective amount of damage done by the pandemic to looking forwards. The IMF has gradually been taking a more optimistic view with its latest 2024 projection at 2.7% vs 2.4% only nine months ago.
Economic growth is a key driver of long-term growth of air travel. However, since early 2022 its impact has been overshadowed by the fall and recovery in traffic associated with the pandemic. In time the influence of overall economic conditions on air travel is likely to reassert itself, but industry forecasts published by Airbus, Boeing and IATA assume much higher rates of traffic growth than GDP growth over the rest of the 2020s as the former catches up to its long-term trend (see our Q1 2024 Industry Update for a more detailed discussion).
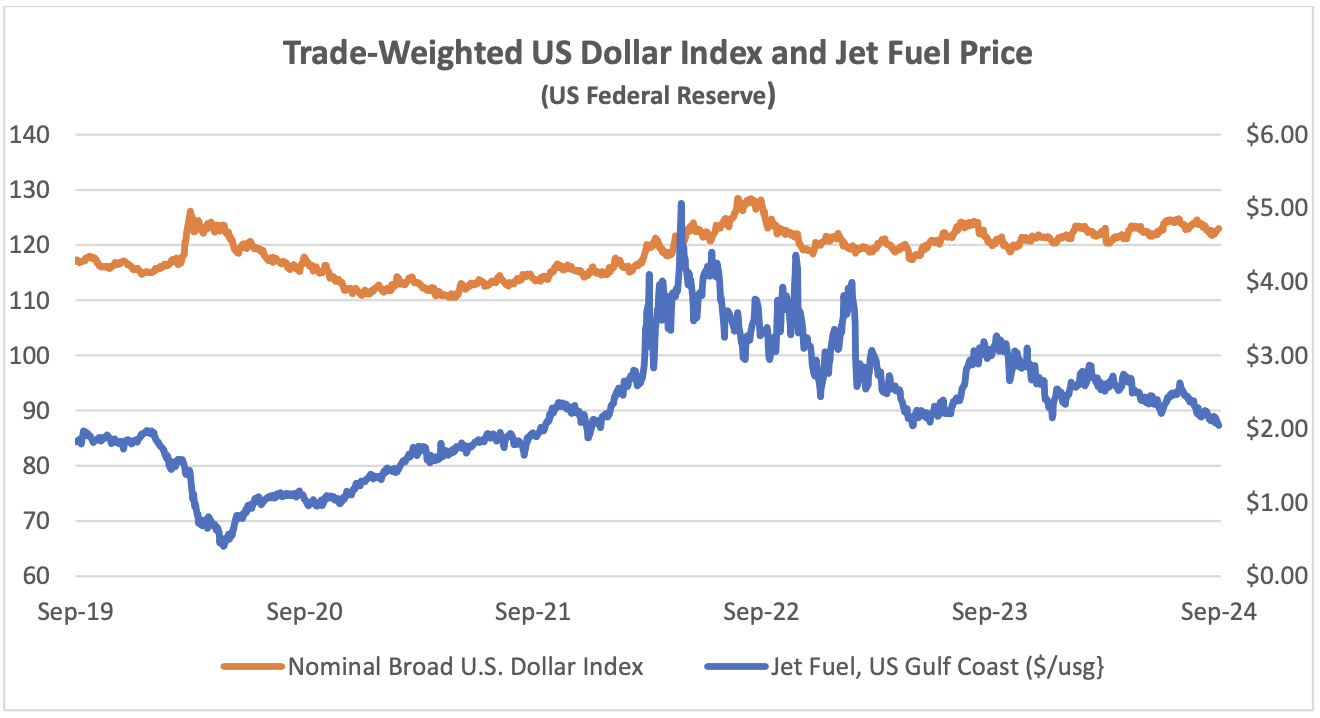
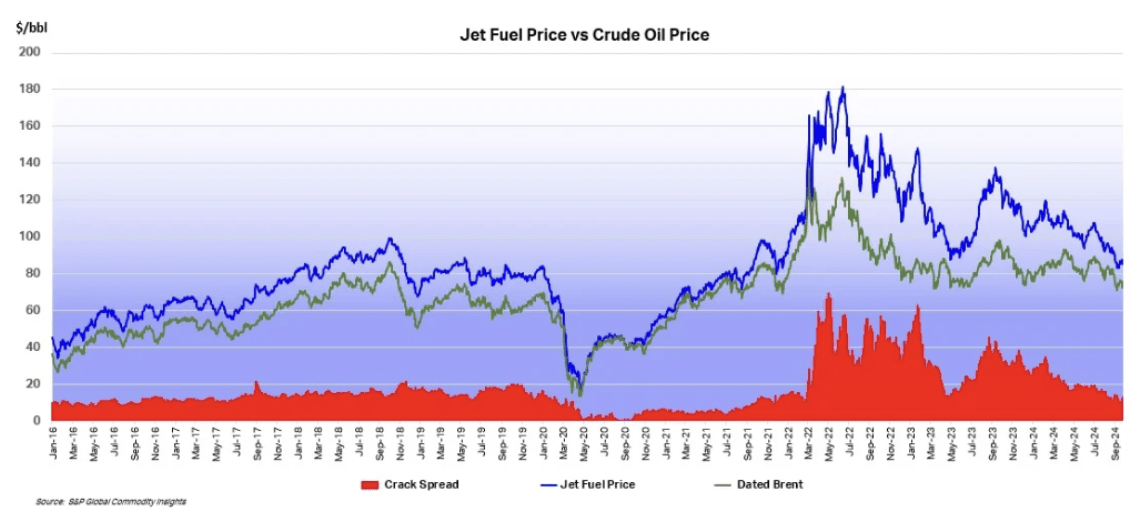
The US Dollar has weakened since its recent peak in September 2022, providing relief for airlines outside the US for dollar-denominated costs such as fuel, aircraft rents and aircraft spares. The price of jet fuel has remained volatile, but it has moderated since February 2024. This reduction has mainly been driven by a reduction in the “crack spread” from c.$30 to c.$12.
Another indicator that is potentially important to aircraft investors is the breakeven inflation rate on US Treasury Inflation-Protected Securities (TIPS). This indicator measures inflation expectations and it matters because used aircraft values are strongly influenced by the cost of new aircraft and over time this cost is linked to US Dollar inflation. In the short term this linkage is driven by escalation clauses in aircraft purchase contracts and in the long term by the general input cost environment for the aircraft manufacturers. The chart below compares the breakeven rate for 10-year and 5-year TIPS.
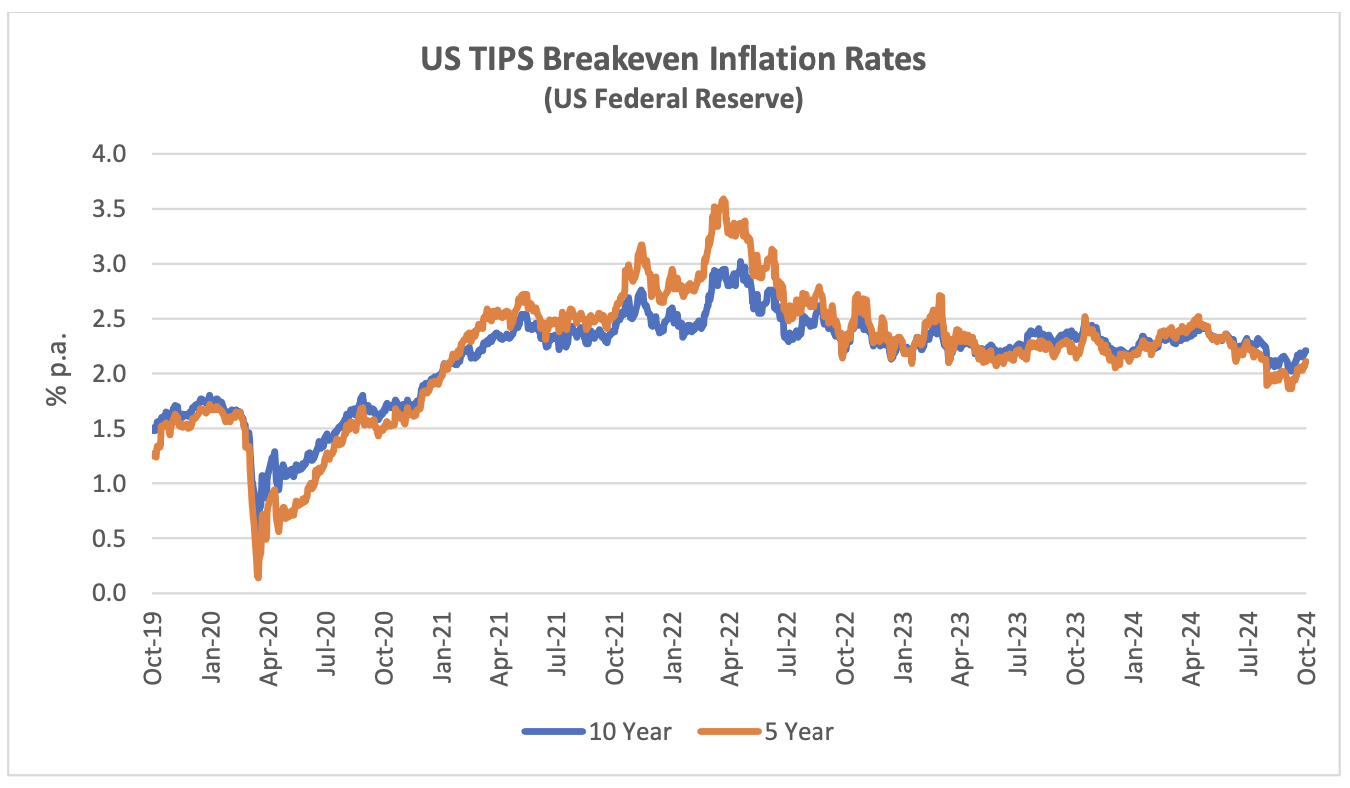
Although medium or long-term inflation expectations have never gone higher than 3.5%, actual inflation experience has been much higher in the last few years. This has led to higher appraised values for new aircraft.
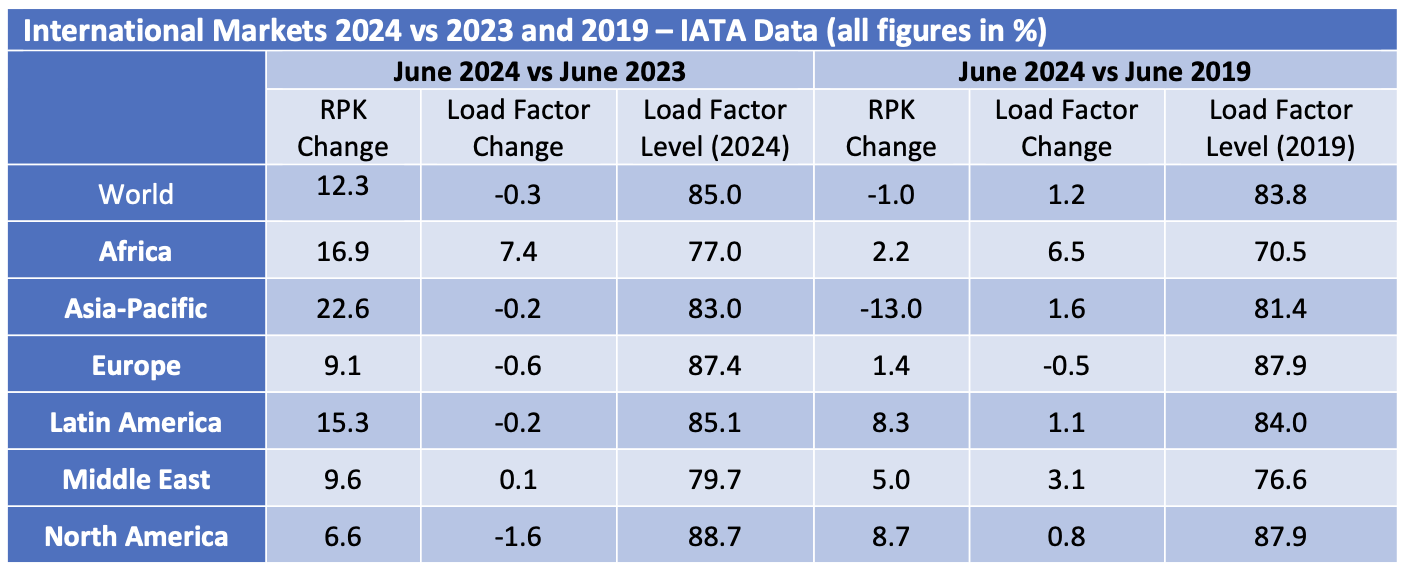
Traffic and Aircraft Demand
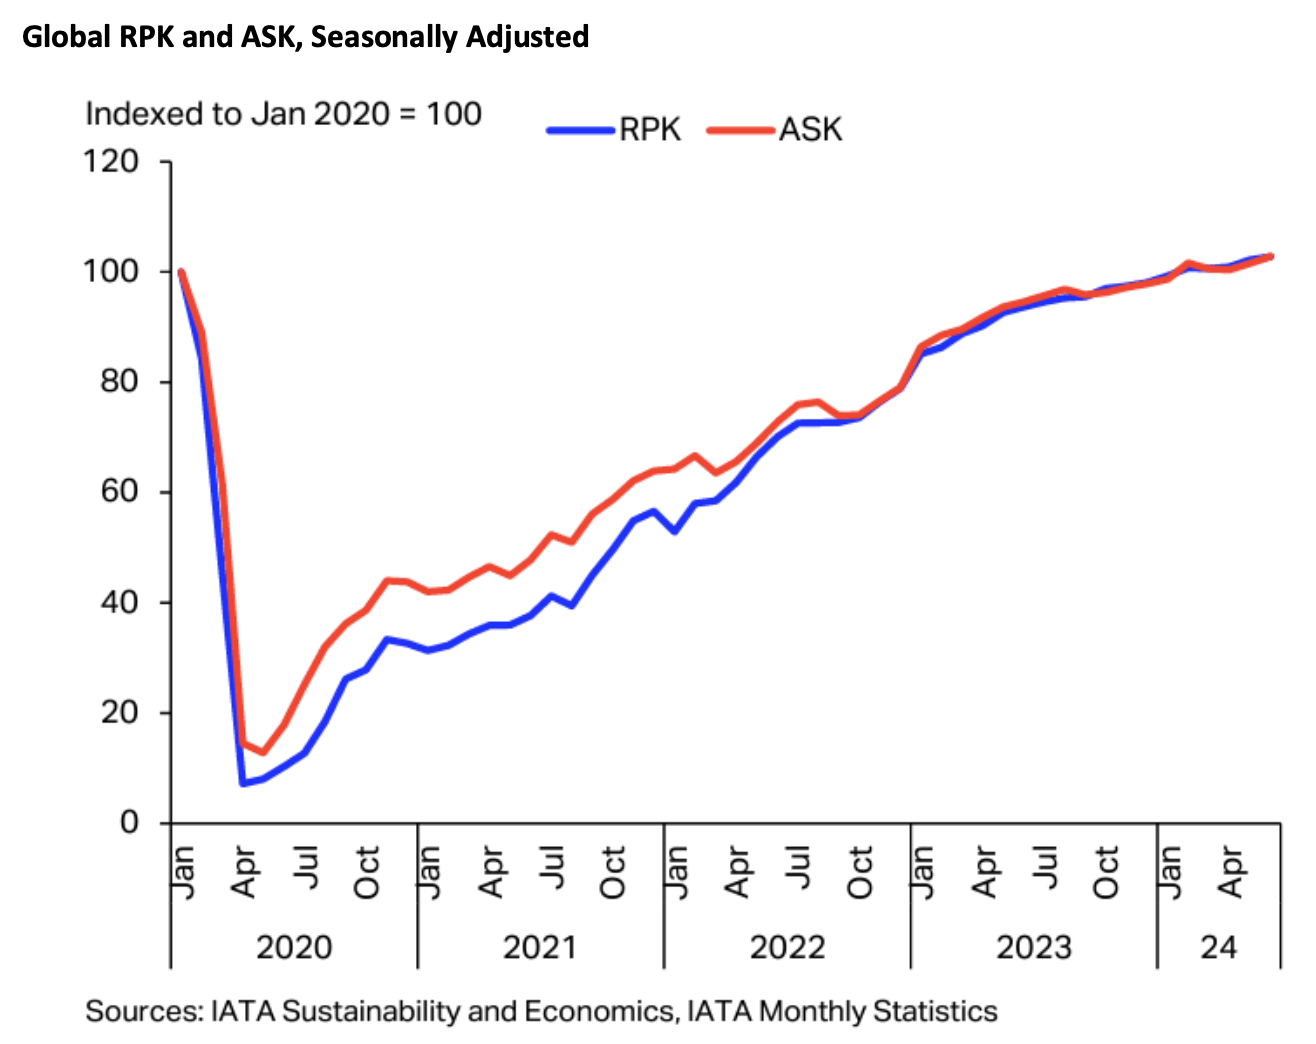
The IATA chart reproduced above looks like those included in previous industry updates but is in fact quite different. Previously it included actual and seasonally adjusted RPKs and now it has both seasonally adjusted RPKs[1] and ASKs[2] indexed to January 2020. For those of us who are not very interested in seasonal adjustments this new version has the benefit of capturing changes in load factors over time and shows that the load factor recovery was complete by the end of 2022.
March 2024 RPKs were 0.1% higher than in March 2019, so recovery is official! Also, no region was more than 5% higher or lower than in 2019 so most of the extreme disparities in terms of recovery have worked their way out of the system.
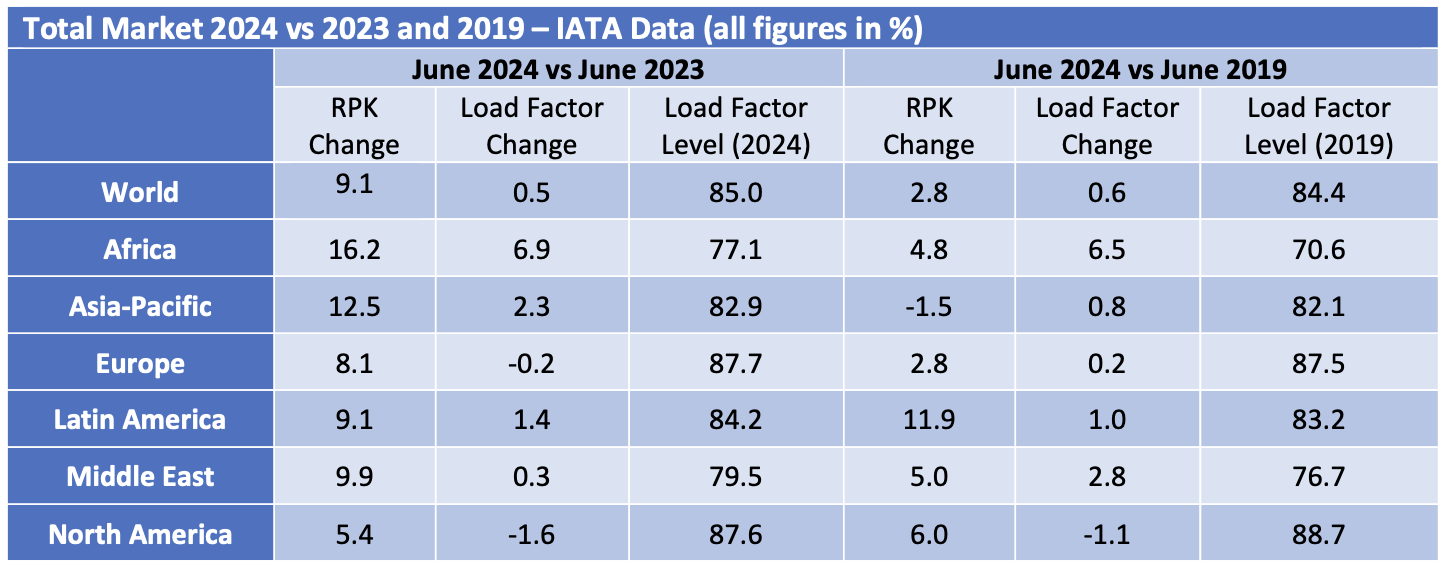
International traffic recovery still lags domestic and shows greater variation by region, with Asia-Pacific conspicuously weaker than in 2019 and North America much stronger. It is striking that North American international RPKs are 11.0% higher than in 2019 vs only a 1.5% increase for domestic US RPKs: domestic traffic across the Americas was the quickest major market to recover after 2020 so it is tempting to assume that all is well, but markets such as the US are relatively mature limiting long-term growth potential.
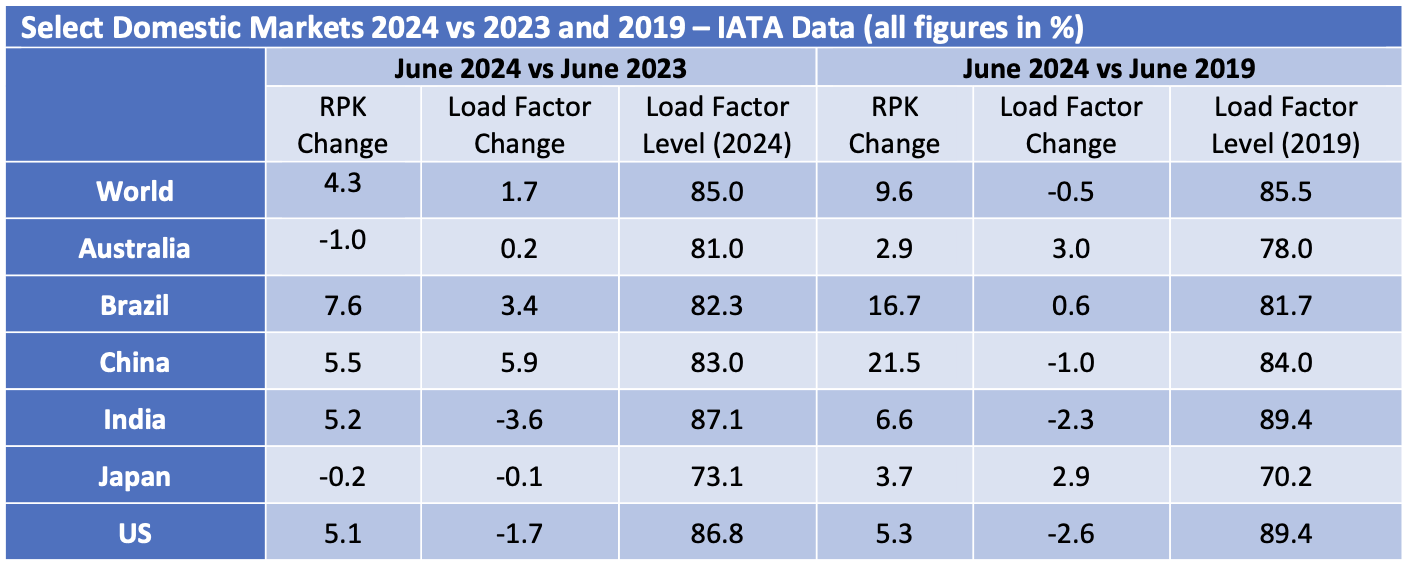
The key markets driving domestic traffic volumes growth are China and India which as emerging markets with very large populations are vital to the aviation industry long-run fortunes.
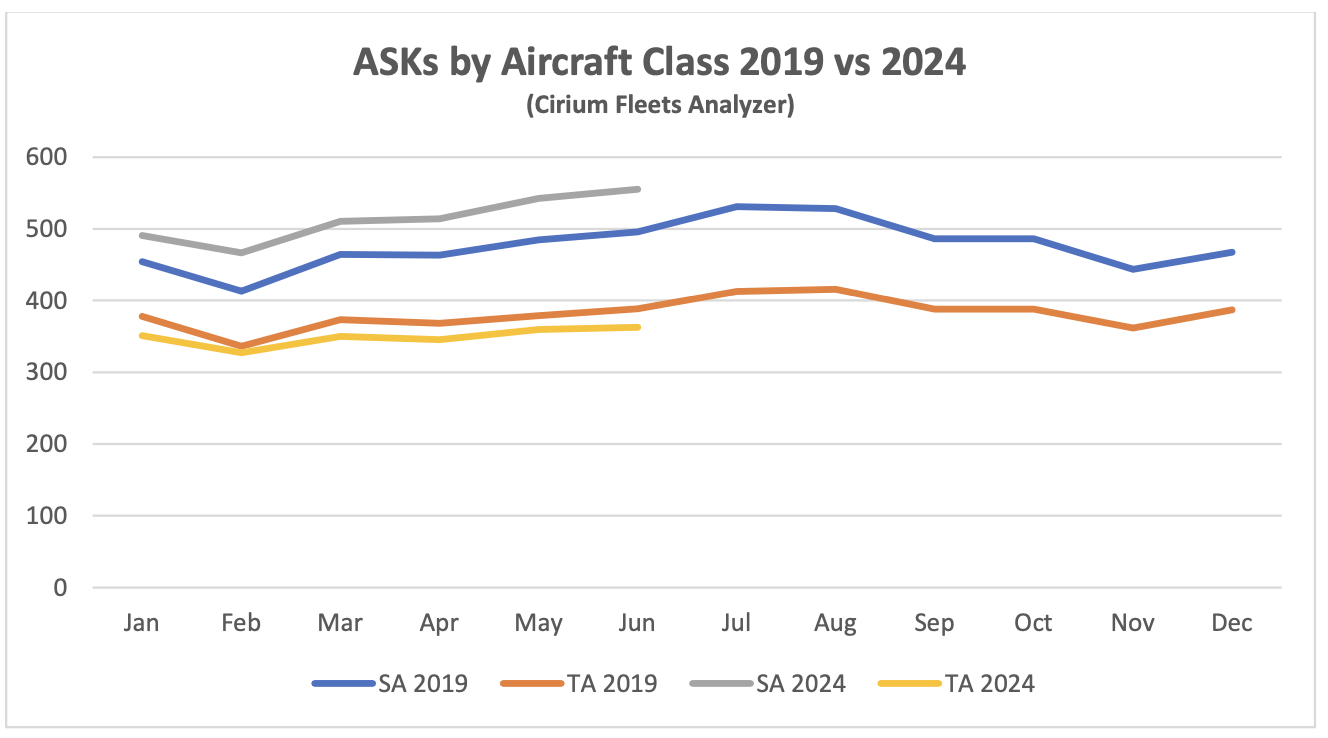
Although some short-haul aircraft serve international routes nearly all long-haul aircraft do so, and this is reflected in the relative demand for single-aisle (narrowbody) and twin-aisle (widebody) aircraft. Aircraft demand can be measured in terms of aircraft in service and ASKs, the standard measure of aircraft capacity deployed by airlines which indicates how intensively aircraft are being flown. Single aisle aircraft demand on both metrics is higher so far in 2024 than in 2019 whereas twin-aisle aircraft are marginally weaker by aircraft in service and lagging more in terms of ASKs. The difference between the two metrics may be down to the gradual move away from very large aircraft such as the B747 and A380 towards the smaller B787 and nA350, resulting in fewer ASKs per aircraft unit.
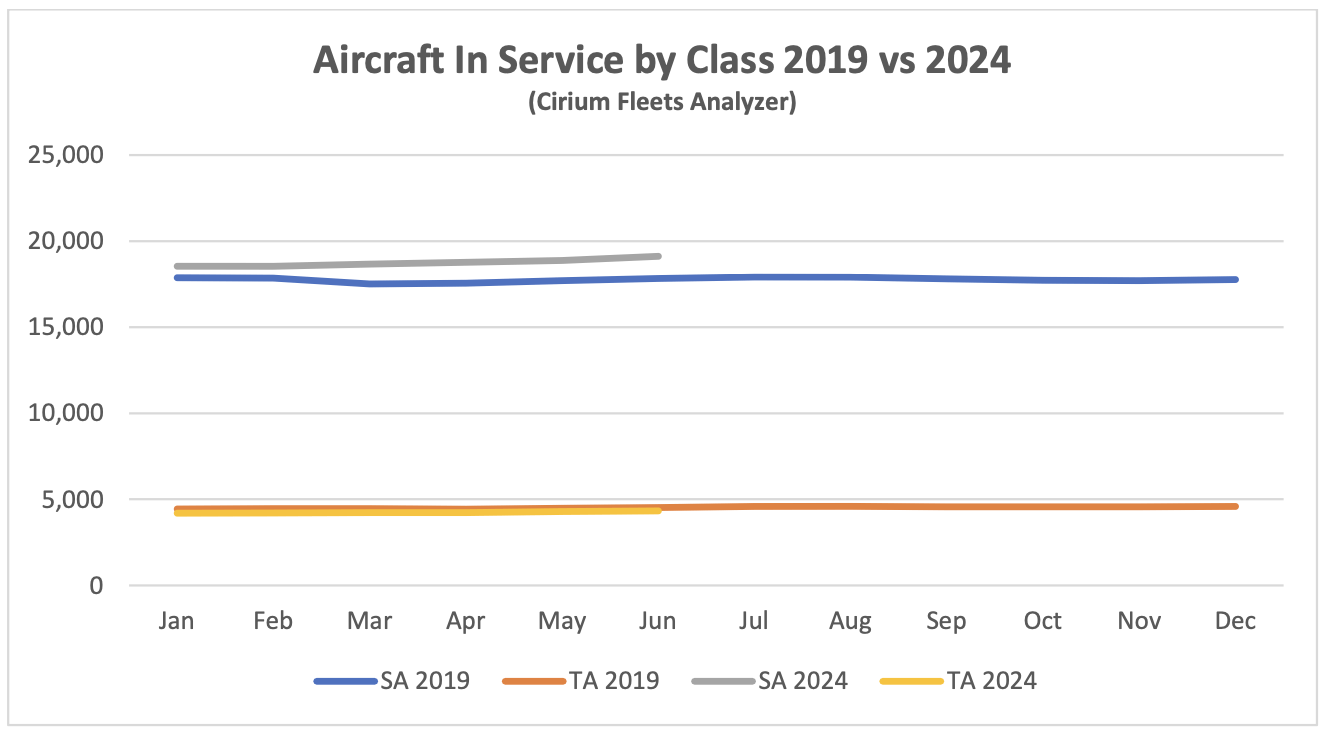
It is hard to see the TA 2024 data series because it is only very marginally lower than TA 2019.
New Aircraft Supply
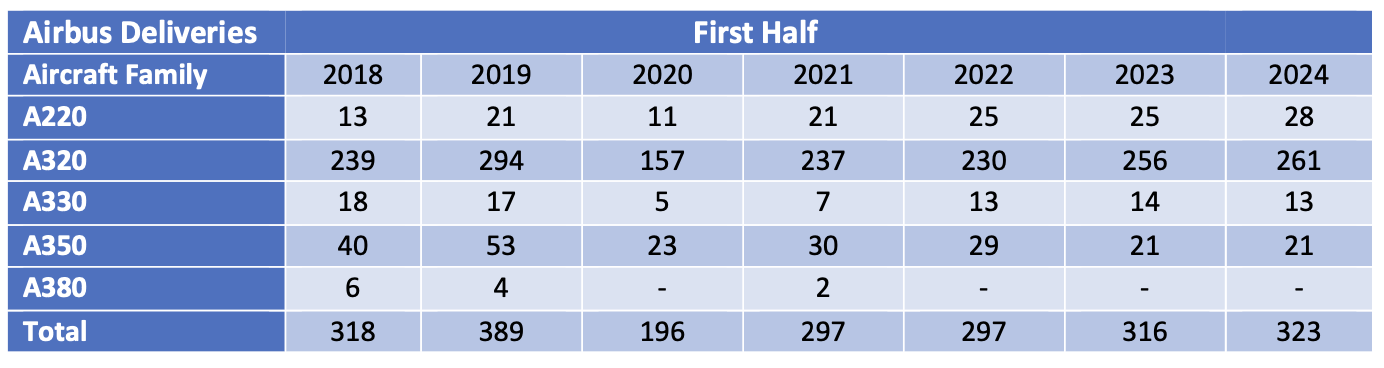
Supply chain issues continue to constrain Airbus’ ability to increase production and deliveries remain below their 2019 peak. It has revised down its delivery guidance for 2024 from 800 to 770. The latest status of Airbus’s production plans is:
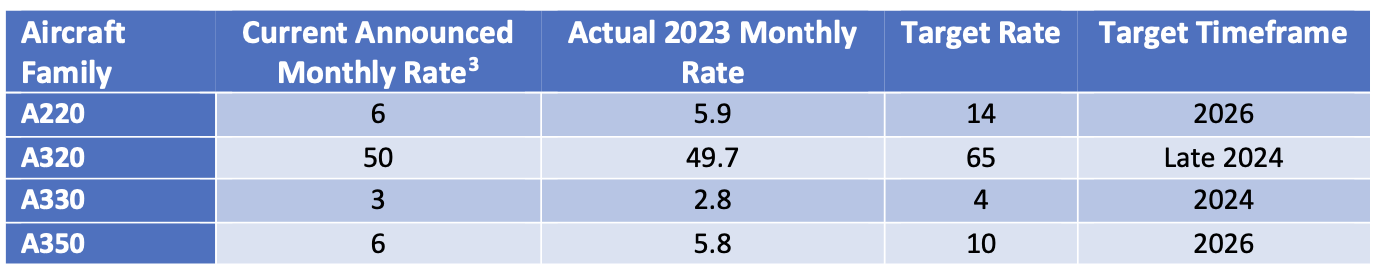
The target date for increasing the A220 rate to 14 has slipped from 2025 to 2026. The only significant production targets not captured in the table above is the objective to raise A320 family production to 75 per month by 2027 (previously 2026) and to increase A350 production to 12 per month by 2028.
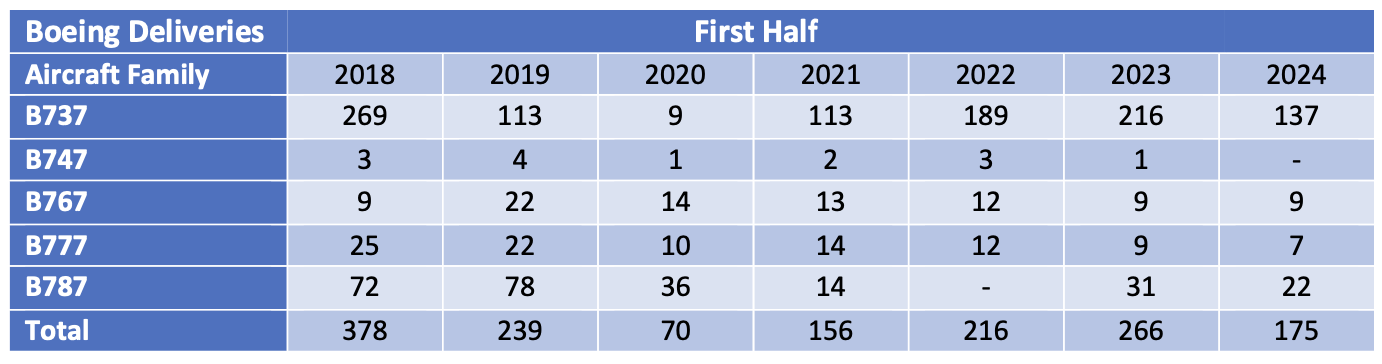
The latest status of Boeing’s production plans is:
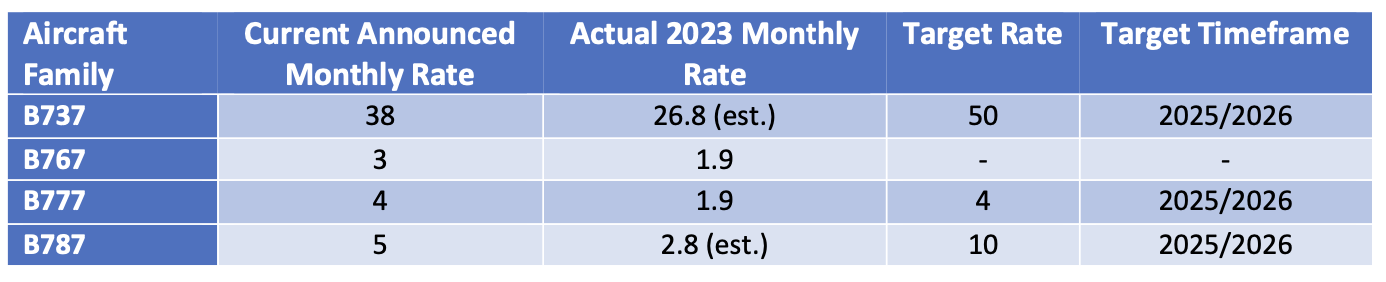
The Alaska Airlines B737-9 incident in January has once again created significant uncertainty around Boeing’s ability to increase production of the Max. The FAA is investigating Boeing’s quality control systems and other related matters and has announced that it will not approve any increases in production until it is satisfied with Boeing’s level of compliance. Boeing has also announced that it will not seek certification of the B737-7 and -10 variants until it has engineering solutions for the engine inlet overheating issue resulting from extended engine anti-Ice operation in dry air. There is no definite timeframe to resolve this issue.
B737 inventory decreased from 110 at the end of Q1 to 90 at the end of Q2, including 65 B737-8 aircraft due to be delivered to Chinese airlines (these numbers above only include aircraft manufactured before the start of 2024). Inventory reduction accounted for 20 of 70 aircraft delivered in Q2 2024 compared to 65 of 67 in Q1 which suggests Boeing are making progress, although Boeing do not disclose how many aircraft manufactured in 2024 are in inventory.
As with the Max Boeing holds a significant inventory of undelivered B787 aircraft, c.40 at the end of Q1 vs c.50 at the end of 2023. Boeing has said it expects to deliver most of them in 2024. The inventory reduction of 10 aircraft compares with 13 total deliveries, suggesting that both B737 and B787 production is being severely disrupted. Boeing has not provided any delivery guidance for 2024.
COMAC of China achieved a significant increase in ARJ 21 deliveries and Embraer was in line with 2023.
Airline Industry Financial Performance
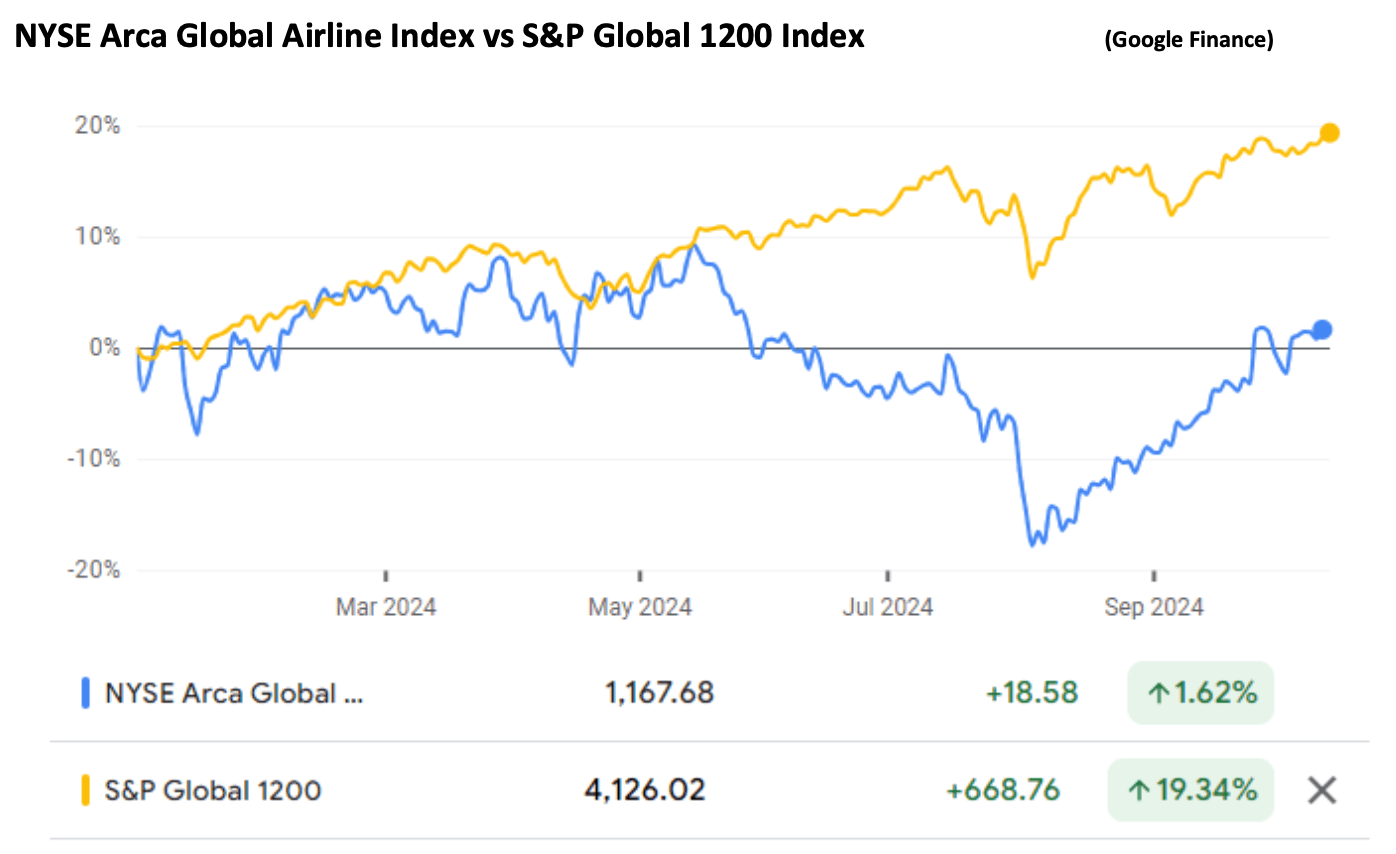
There has been some recovery in airline share prices since the summer which is most reasonably explained by lower fuel prices.
GOL of Brazil files for US bankruptcy protection in January. This was not a major surprise as GOL’s major competitors Avianca and LATAM had already done so during the pandemic and GOL had engaged in significant financial restructuring in the same timeframe.
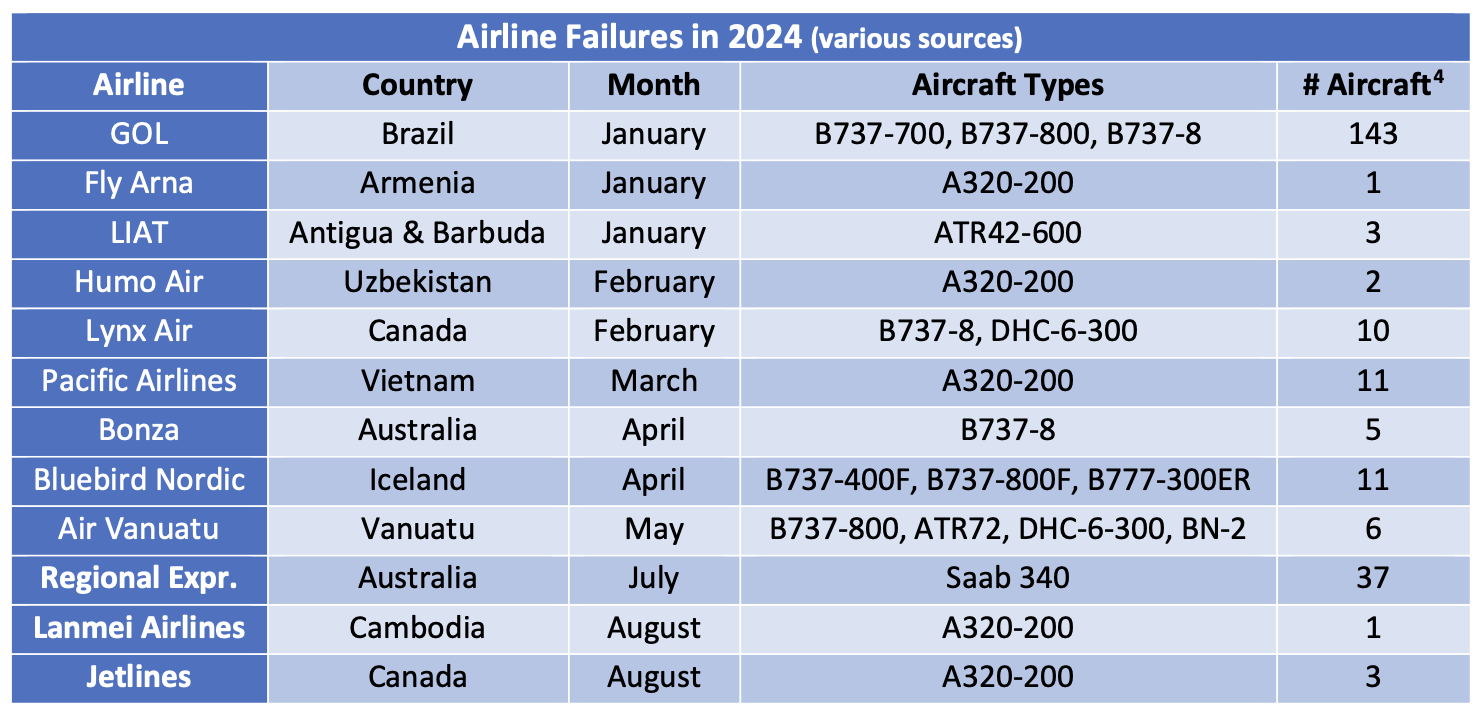
The second largest airline by equipment value to fail is Lynx Air of Canada with a fleet including 9 X B373-8s. Lynx filed for bankruptcy protection in February, citing rising operating costs, high fuel prices, increasing airport charges, and a difficult economic and regulatory environment. Lynx was a low-cost airline that started operations in 2022 and some or all its problems are shared by most low-cost North American carriers up to and including Southwest Airlines, which have not benefitted from the strength of North American international traffic in the same way as the network airlines.
Sometimes airline financial distress comes in shades of grey rather than black and white. Although Pacific Airlines has ceased operations it has declared its intention to restart, and SpiceJet of India (43 aircraft) has suffered several adverse court judgments although it remains in business.
[1] RPKs is the acronym for revenue passenger kilometres, which is the product of the number of paying passengers and distance flown.
[2] ASKs is the acronym for available seat kilometres, which is the product of the number of available seats flown and distance flown.
Disclaimer
This Presentation has been made to you solely for general information purposes and is not intended to provide, and should not be relied upon for legal, tax, accounting, investment, or financial advice. This Presentation is not a sales material and does not constitute or form any part of any offer, invitation or recommendation to the recipient, its affiliates or any other person to underwrite, sell or purchase securities, assets or any other product, nor shall it or any part of it form the basis of, or be relied upon, in any way in connection with any contract or transaction decision relating to any securities, assets or any other product. None of Sirius, its affiliates or shareholders shall have any responsibility or liability to the recipient, its affiliates, shareholders or any third party in relation to this Presentation or any other document or materials prepared by Sirius or its affiliates, officers, directors, employees, advisers or agents. Sirius and its affiliates, officers, directors, employees, advisers and agents have taken all reasonable care to ensure that the information contained in this Presentation is accurate. Neither Sirius nor any of its affiliates, officers, directors, employees, advisors or agents has any obligation to update this Presentation. Under no circumstances should the delivery of this Presentation, irrespective of when it is made, create an implication that there has been no change in the affairs of the entities that are the subject of this Presentation. This Presentation may be updated and amended by a supplement and, where such supplement is prepared, this Presentation will be read and construed with such supplement. The statements herein which contain such terms as “may”, “will”, “should”, “expect”, “anticipate”, “estimate”, “intend”, “continue” or “believe” or the negatives thereof or other variations thereon or comparable terminology are forward-looking statements and not historical facts. No representation or warranty, express or implied, is made as to the fairness, accuracy or completeness of such statements, estimates and projections. The recipient should not place reliance on any forward-looking statements. Neither Sirius nor its affiliates undertakes any obligation to update or revise the forward-looking statements contained in this Presentation to reflect events or circumstances occurring after the date of this Presentation or to reflect the occurrence of anticipated events. The information set out in this Presentation has been prepared by Sirius based upon various methodologies and calculations which it believes to be reasonable and appropriate. Past performance cannot be a guide to future performance. In preparing this Presentation, Sirius has relied upon and assumed, without independent verification, the accuracy and completeness of all information available from public sources or which was provided to it or otherwise reviewed by it. This Presentation supersedes and replaces any other information provided by Sirius or its affiliates, officers, directors, employees, advisers or agents in respect of the content of the Presentation. No information or advice contained in this Presentation shall constitute advice to an existing or prospective investor in respect of his personal position. None of Sirius, its affiliates, its or its affiliates’ officers, directors, employees or advisers, connected persons or any other person accepts any liability whatsoever for any loss howsoever arising, directly or indirectly, from this Presentation or its contents.