
- SPECIAL TOPIC – Keeping Older Jets Flying – Airline Capacity Reality
- Macro-Economic Background
- Traffic and Aircraft Demand
- New Aircraft Supply
- Airline Industry Financial Performance
Keeping Older Jets Flying – Airline Capacity Reality
One of the most widely discussed recent developments in the airline industry has been the unprecedented level of storage for young single-aisle aircraft. This has been concentrated in aircraft powered by the Pratt & Whitney (“P&W”) GTF engine such as the Airbus A320 NEO family, the Airbus A220 and the Embraer E195-E2. The immediate cause of these groundings was manufacturing defects involving contaminated powdered metal used by P&W’s suppliers.
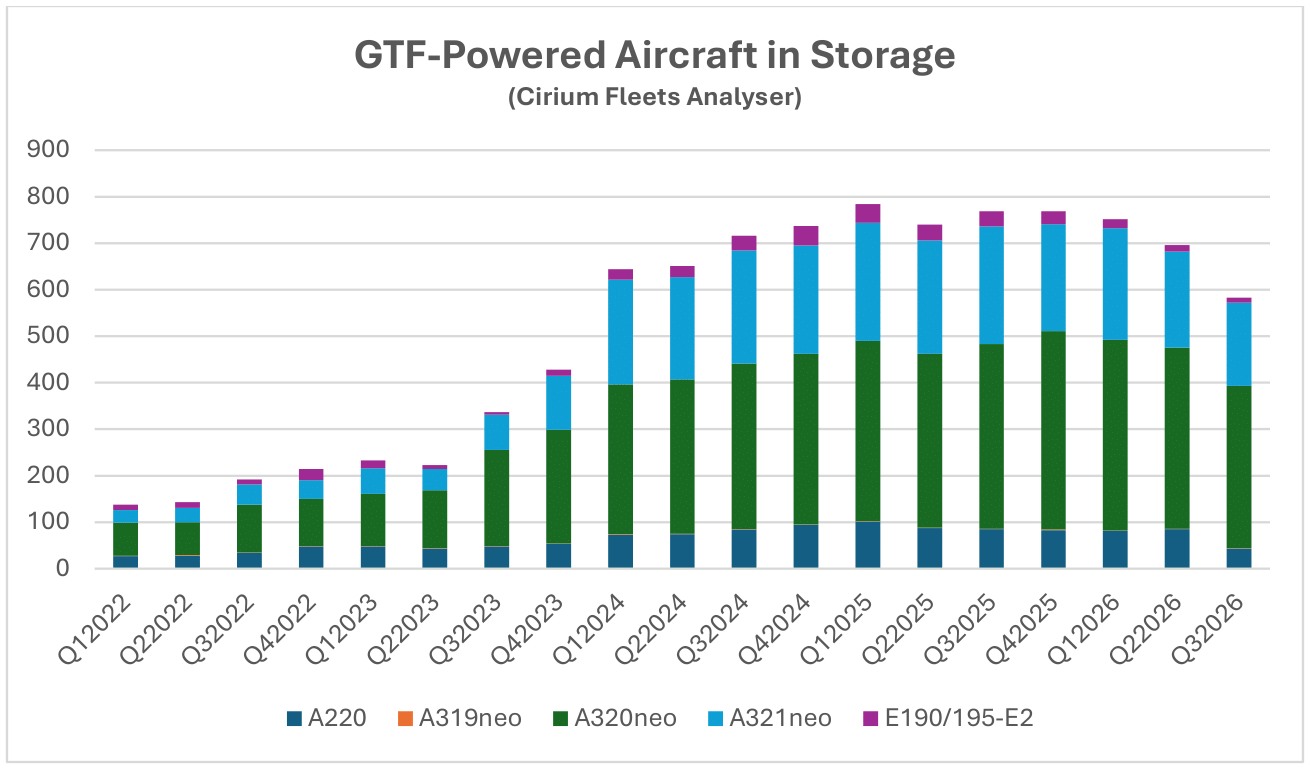
Although P&W have made progress in addressing these issues single-aisle storage levels are likely to remain high by historic standards for several years. Both the GTF and its principal competitor, the CFM International (“CFMI”) LEAP need more frequent overhauls than their predecessor engine types, the IAE V2500 and the CFM56 5B and 7B. However, engine maintenance capacity is constrained by shortages of parts (particularly high-pressure turbine blades) and skilled labour, which has caused overhauls to take longer than normal. In normal circumstances, if there was an ample supply of spare engines these developments would not lead to higher aircraft storage levels as a spare engine would be temporarily installed to replace the engine in maintenance.
There is in fact an acute shortage of spare engines, especially GTFs, so much so that as of September 2026 37 GTF-powered A320 NEO family aircraft, 2 LEAP-powered A320 family aircraft and 2 LEAP-powered Boeing 737 MAX aircraft had been scrapped and their engines leased out as spares. It is unprecedented for so many young aircraft to be scrapped with this motivation, and furthermore their elimination from the market ultimately increases the shortage of capacity.
Both P&W and CFMI have announced initiatives to address this situation:
- Technology upgrades to improve time on wing most of which can be retrofitted to the existing fleet;
- Increases in production to support increased new aircraft deliveries and spare engine availability; and
- Increases in maintenance shop capacity to reduce the time required for overhauls.
How effective these measures will be is uncertain as is the timing of their impact. In the meantime, it is worth considering the impact of these developments on the airline industry’s capacity.
The first way we can look at this is in terms of aircraft survival. In this context the definition of survival is whether an aircraft of a given age that was originally delivered as a passenger variant remains in passenger service. Aircraft can leave passenger service for several different reasons; some are permanent like retirement or conversion to freighter and others temporary like maintenance or temporary storage while a leasing company seeks a new airline operator.
For its internal purposes Sirius benchmarks survival performance against the average for the period 2007 to 2018. We use this approach firstly because aircraft survival is not consistent over time. The widespread grounding of aircraft during the pandemic and other one-off events distort performance compared to what one might reasonably expect in normal times. Also, there are important long-term effects such as the relative increase in engine values compared to aircraft that influence the behaviour of market participants to e.g. scrap aircraft before they reach their full economic lifespan (the scrapping of new technology aircraft described above is an extreme case of this trend).
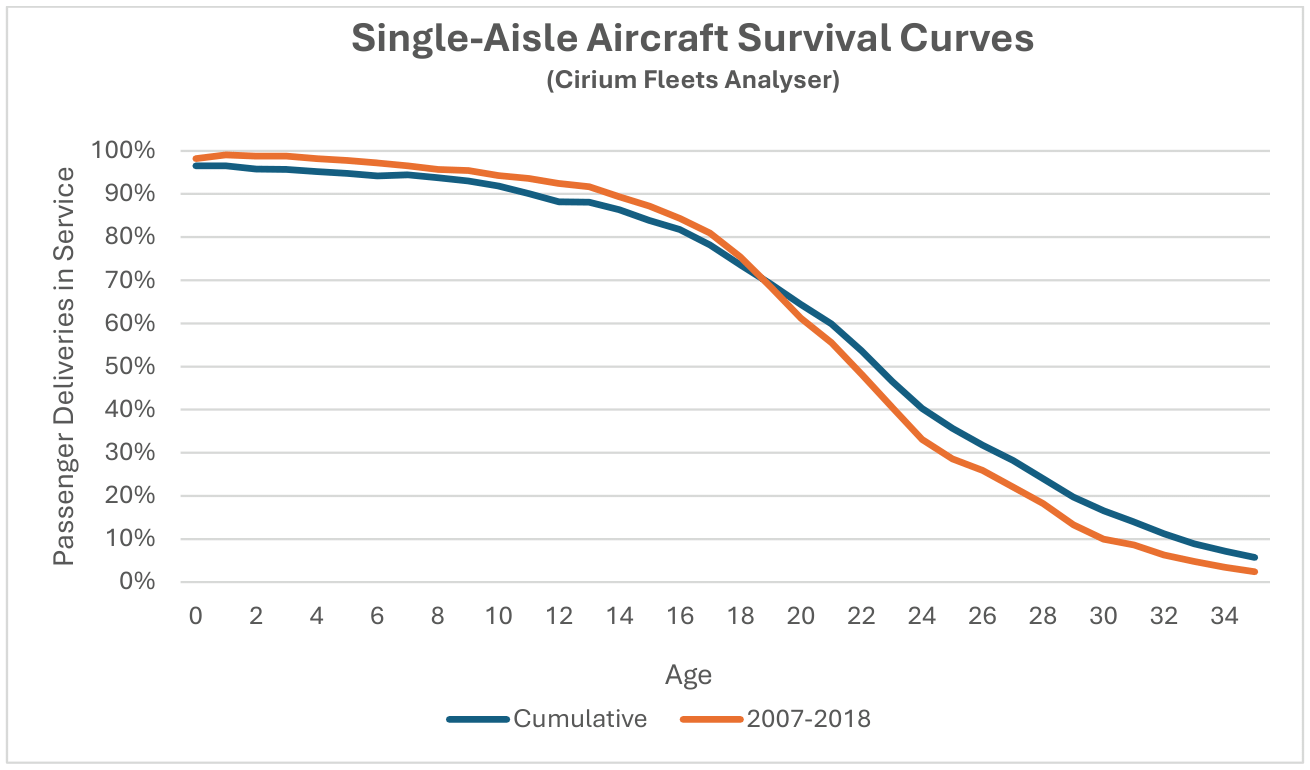
We chose the period 2007-2018 for single-aisle aircraft to avoid biasing our numbers by starting and ending at similar points in the industry cycle (both were “market tops”). We would ideally have extended the benchmark period to 2019 but for the problem that this would have involved distortion from another one-off event, the grounding of the Boeing 737 MAX fleet.
There is some inevitable subjectivity in making this kind of choice, but we believe judgement is needed to do a useful analysis. As the chart above shows the 2007-2018 curve is meaningfully different to the cumulative curve with a higher expected proportion in service for younger aircraft and vice versa for older aircraft. A reasonable explanation for these changes is an increase in productivity for younger aircraft through less maintenance and other downtime and earlier retirement of older aircraft as lessors availed of the ability to realise attractive sales proceeds by breaking up aircraft to sell engines and other major components separately. Having settled on a reasonable benchmark we can now compare this to current market conditions as in the charts below.
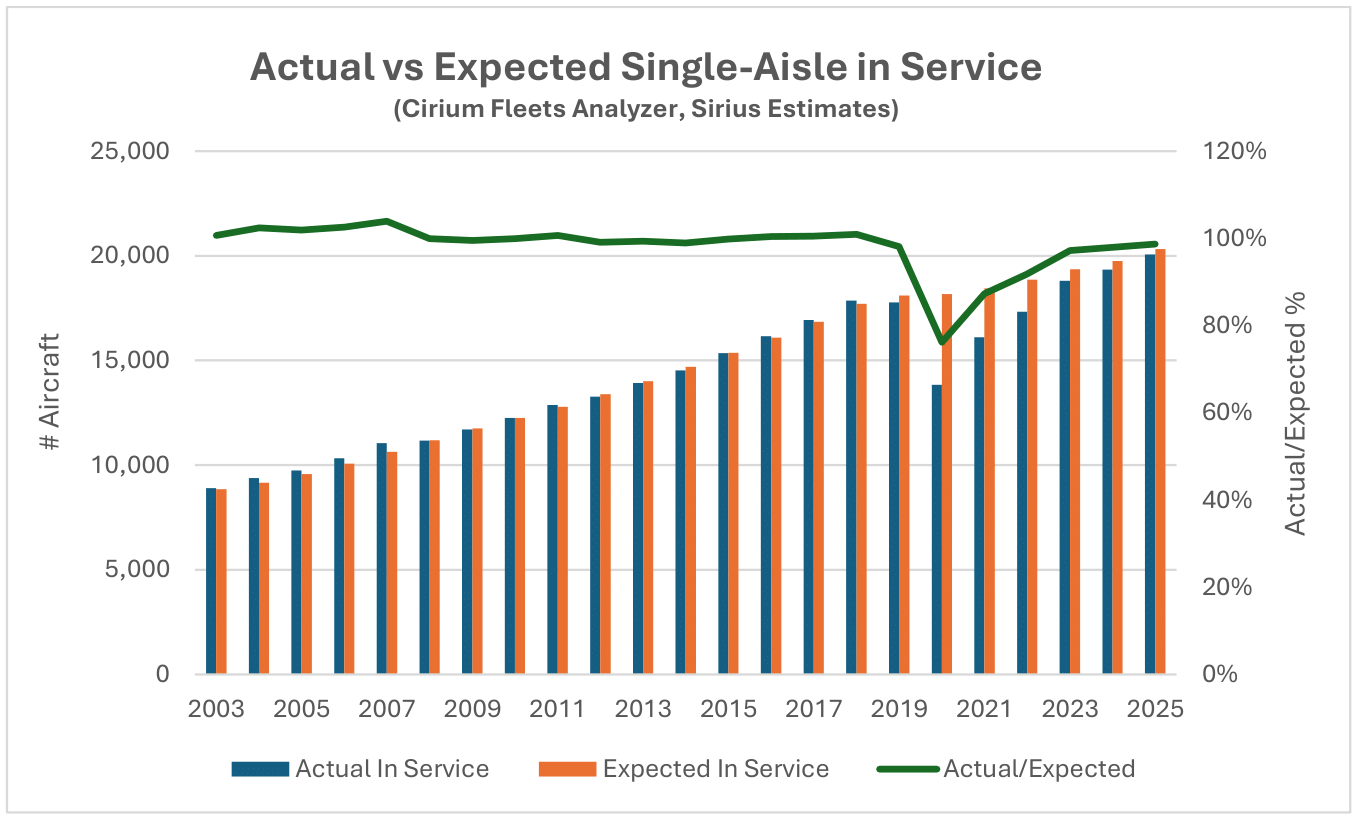
First up is a broad view of how many aircraft are in service overall relative to what we would expect – the first chart shows that on an aggregate basis by 2025 the actual number of aircraft in service was 99% of expected. It also gives some historical perspective – as well as showing the disruption caused by the pandemic it also shows that the range of values for the ratio of actual to expected aircraft in service is reasonably narrow in more normal times with a low of 99% and a high of 104%.
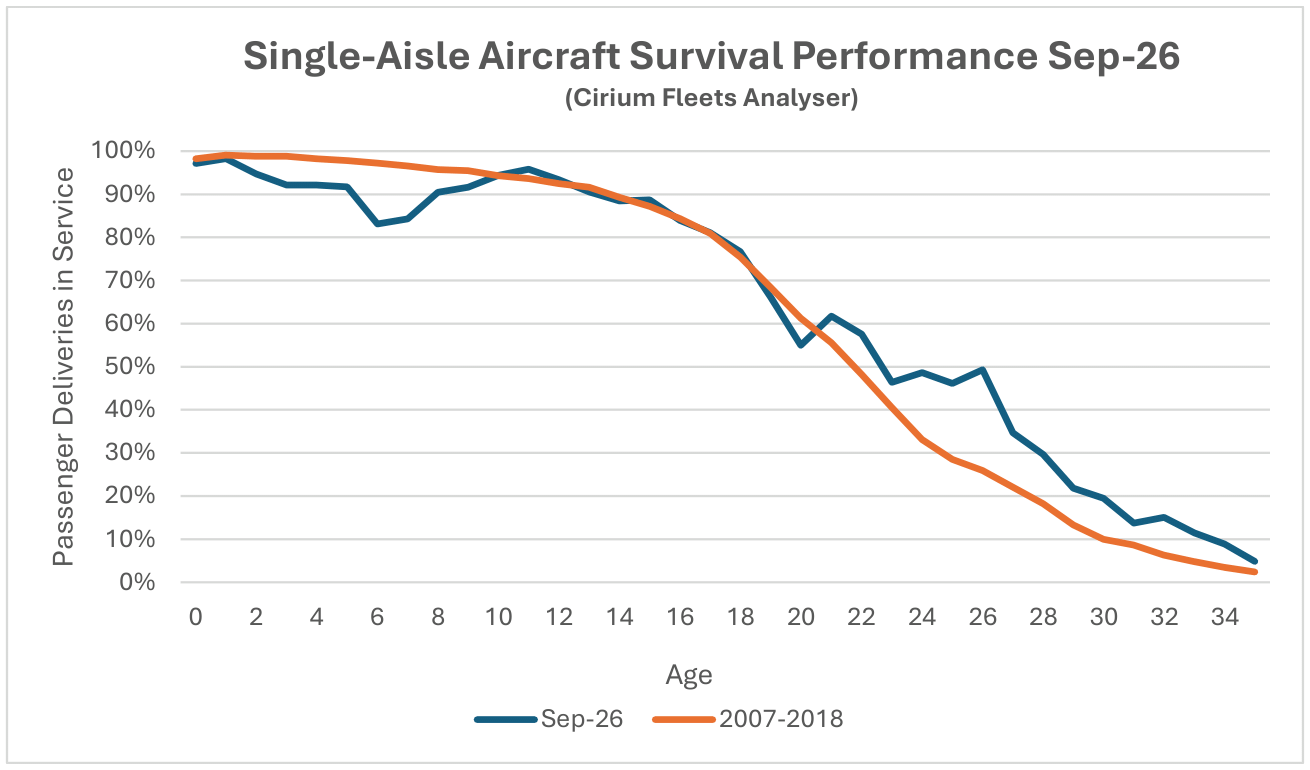
However, the aggregate picture does not capture the very significant anomalies by age in the current market. The second chart compares a survival snapshot as of September 30th, 2026, with our 2007-2018 blended survival curve. It confirms that the shortfall of young aircraft in service has been largely offset by aircraft over 20 years old staying in service for longer.
This analysis tells us something about whether there is a shortage of single-aisle aircraft. Normally a figure of less than 100% for actual vs expected aircraft in service would imply there is no shortage, but this view needs to be modified because so many aircraft are in “forced storage” – where operators have a choice the level of actual vs expected aircraft in service is high.
There is another way to look at the single-aisle aircraft capacity balance. The problem with looking at aircraft numbers alone is that not all aircraft provide the same level of capacity, as over time seat counts and average trip lengths have increased for aircraft entering the fleet so younger aircraft generate more ASKs than older aircraft.
Sirius has carried out proprietary research where we seek to identify the maximum potential capacity that an aircraft can provide which we define as maximum ASKs. This is a two-stage calculation where we first look at aircraft kilometres by aircraft type and age and then multiply by actual historic seat counts to calculate ASKs.
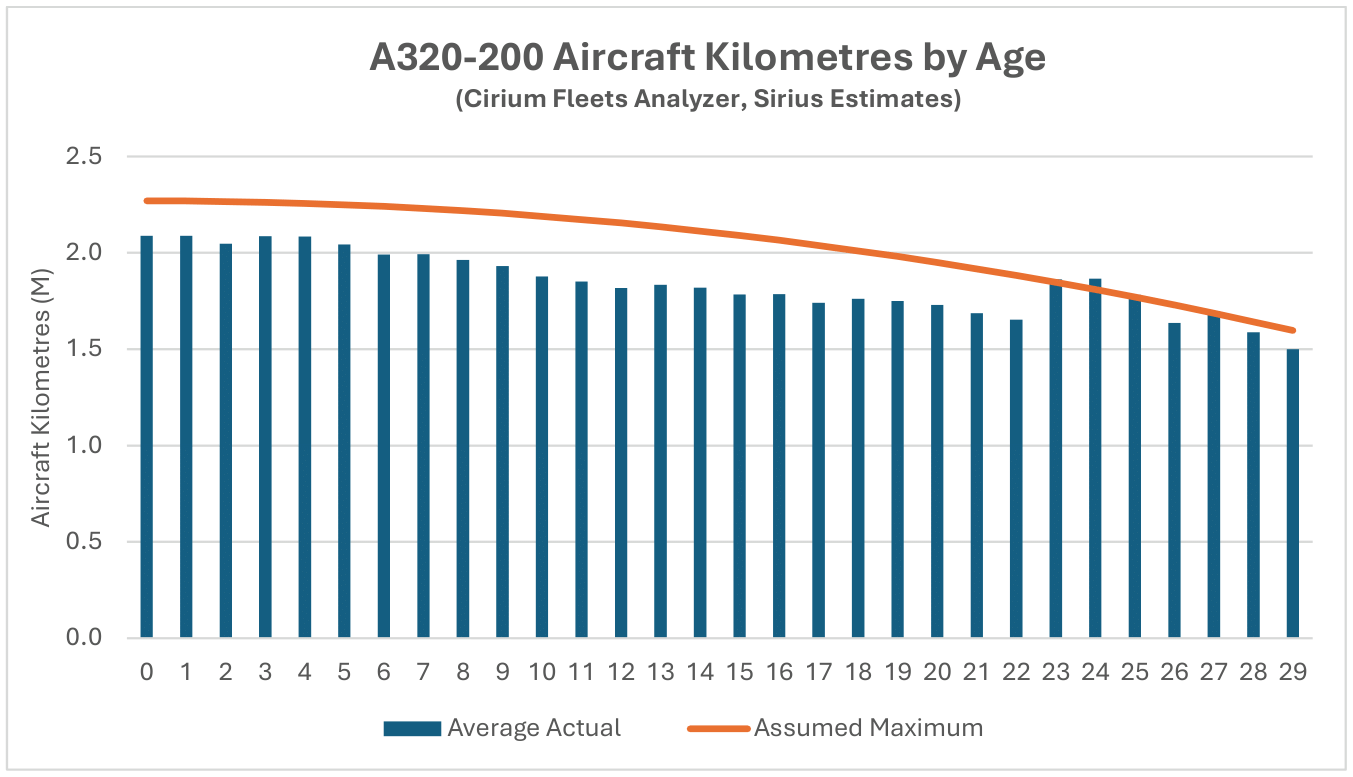
When we analyse aircraft kilometres, we look at the peaks in the historic data and infer a curve of maximum ASKs by age – the chart below shows the A320-200 by way of an example. Although it is generally true that aircraft utilization for a given type does not really vary by age within a single airline’s network the pattern of reducing utilization by age is typical of all aircraft types, implying that as they age, they gradually move from more productive to less productive airline networks. For the sake of clarity, we note that these figures only include aircraft in service so increased storage does not reduce utilization.
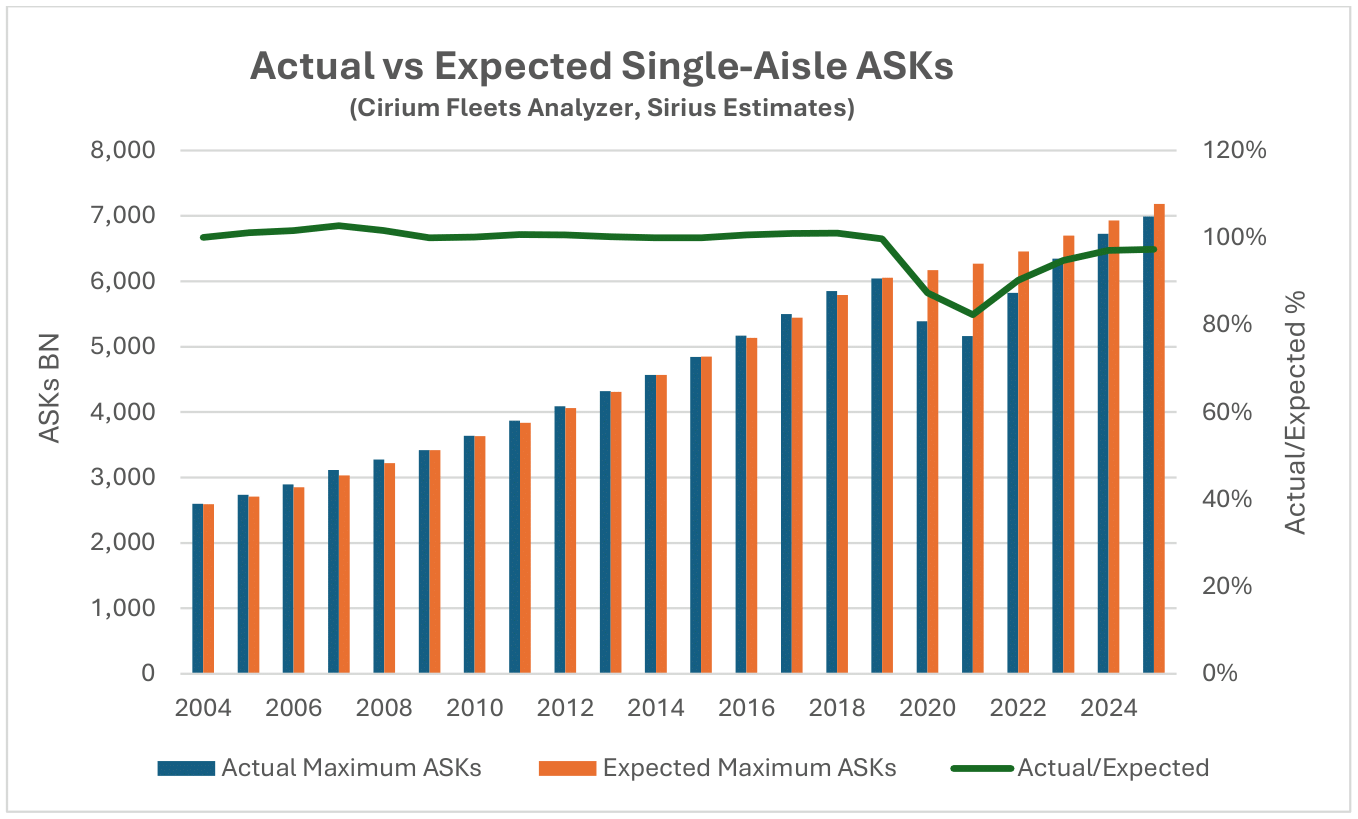
If we do a similar analysis as for the numbers of aircraft in service, we generate a chart with a similar shape. The key difference is that maximum ASKs are only 97% of what they would be if the numbers of aircraft in service by age were in line with our survival curve (this compares with a very narrow range around 100% up to 2019). This implies the capacity shortfall is three times the aircraft shortfall.
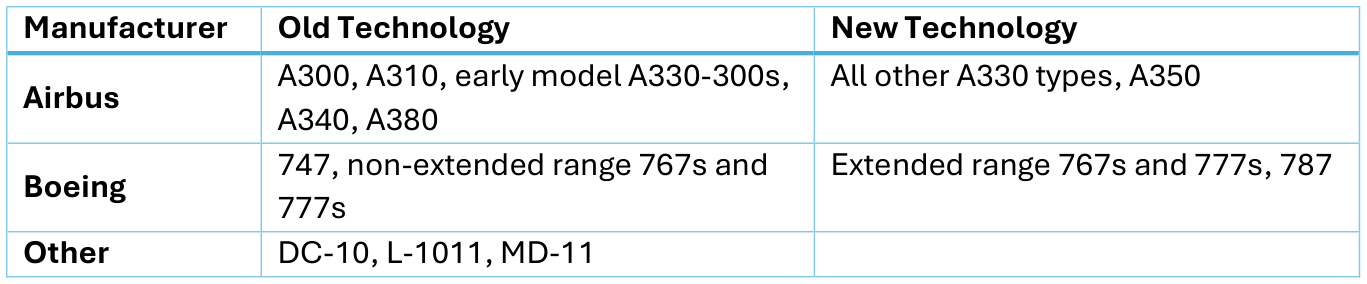
To analyse the twin-aisle aircraft market in a similar way, we need to start by segmenting it into old and new technology types, because their survival performance has been very different. The key characteristics of modern types are a twin-engine configuration and a range capability greater than 5,500 nautical miles, while old technology types have three or four engines and/or a shorter range. This is not a strictly chronological approach because the four-engine A380 entered service many years after the Boeing 767-200ER, the first modern technology aircraft type on our definition. The table below shows the full segmentation by aircraft type.
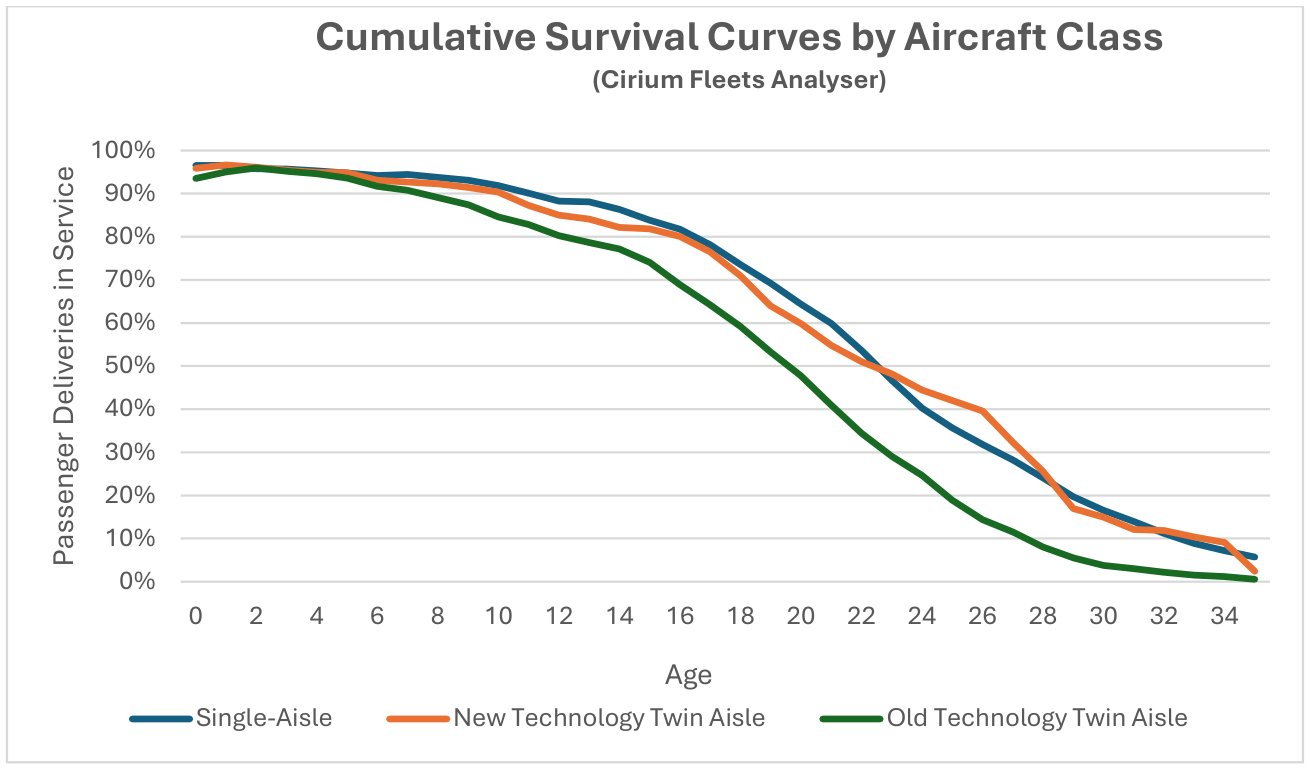
The chart below shows the difference in survival performance on a cumulative basis and includes the same curve for single-aisle aircraft as a benchmark. We believe the stronger performance of modern technology aircraft is because
- a two-engine configuration is more economically efficient than three or four;
- their smaller size than e.g. the Boeing 747 is suited to the evolution of airline route structures away from hub and spoke to point-to-point strategies; and
- a longer-range capability avoids competition from single-aisle aircraft types on shorter routes.
In the analysis below we will focus on new technology twin-aisle types because the old technology has become something of a sideshow, accounting for just under 10% of the global fleet as of September 2026.
The chart below compares cumulative survival performance for these aircraft with the period we use as a benchmark for our analysis. In this case we use 2007-2019 instead of 2007-2018 because there is no equivalent distorting effect to the grounding of the 737 Max in 2019 for the single-aisle market. There is improved performance in our benchmark period out to nearly 25 years old.
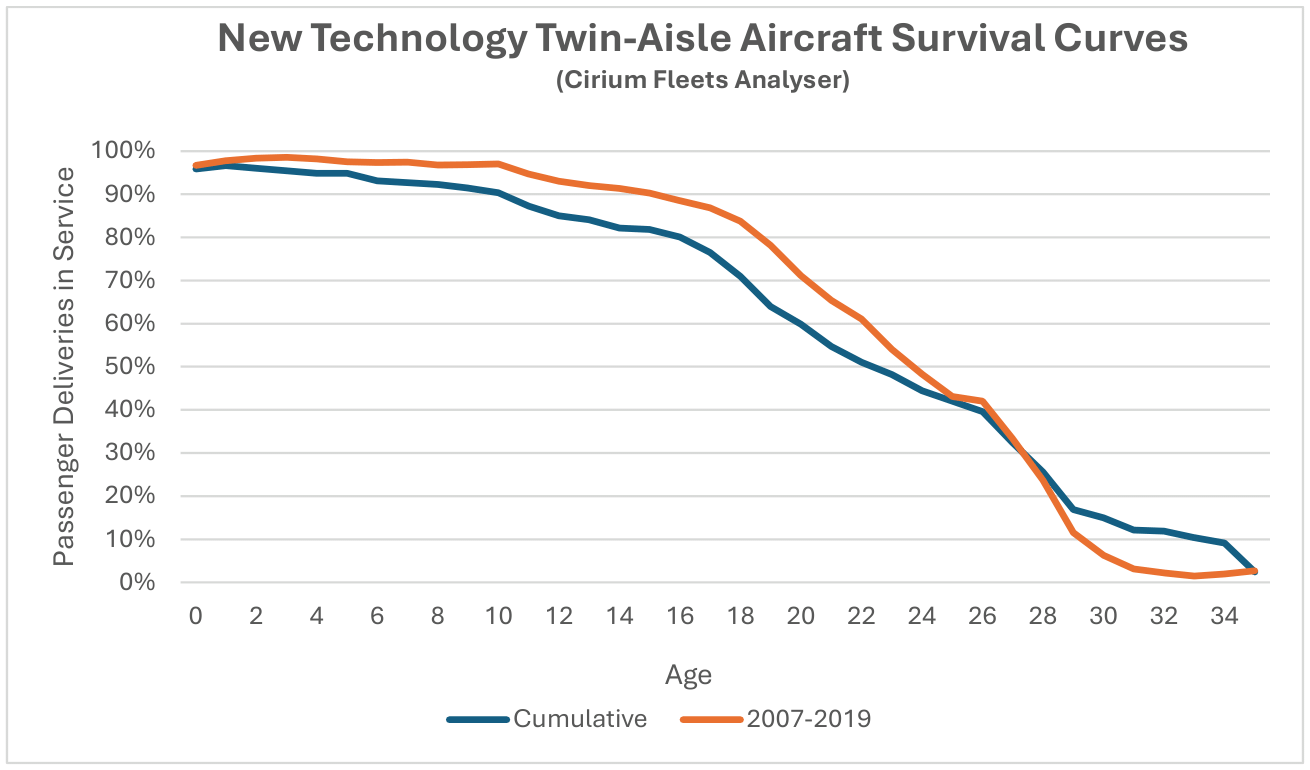
When we take a survival snapshot as of September 2026, compared to our analysis of single-aisle aircraft the results are very different. Up to 12 years old our snapshot is very close to the result for 2007 to 2019. The outperformance of the oldest aircraft is based on very thin data and a very narrow airline operator base – there were only 79 aircraft in service over 28 years old, mainly consisting of Boeing 767-300ERs and 777-200ERs operated by large airlines such as Delta, United and British Airways. Given these issues with the data, it would be foolhardy to draw any strong conclusions about likely future performance. The underperformance of aircraft aged 12-24 years old is another matter as this is based on ample data and a broad operator base.
This seems counter-intuitive given the perceived tightness of the current twin-aisle aircraft market. If we do the same exercise as for single-aisle aircraft above where we calculate actual vs expected aircraft in service and maximum ASK capacity, in both cases we arrive at actuals being only 96% of expected. Unlike the single-aisle market there is no “forced storage” of aircraft so these numbers only make sense if there is material oversupply, and that is not where we are.
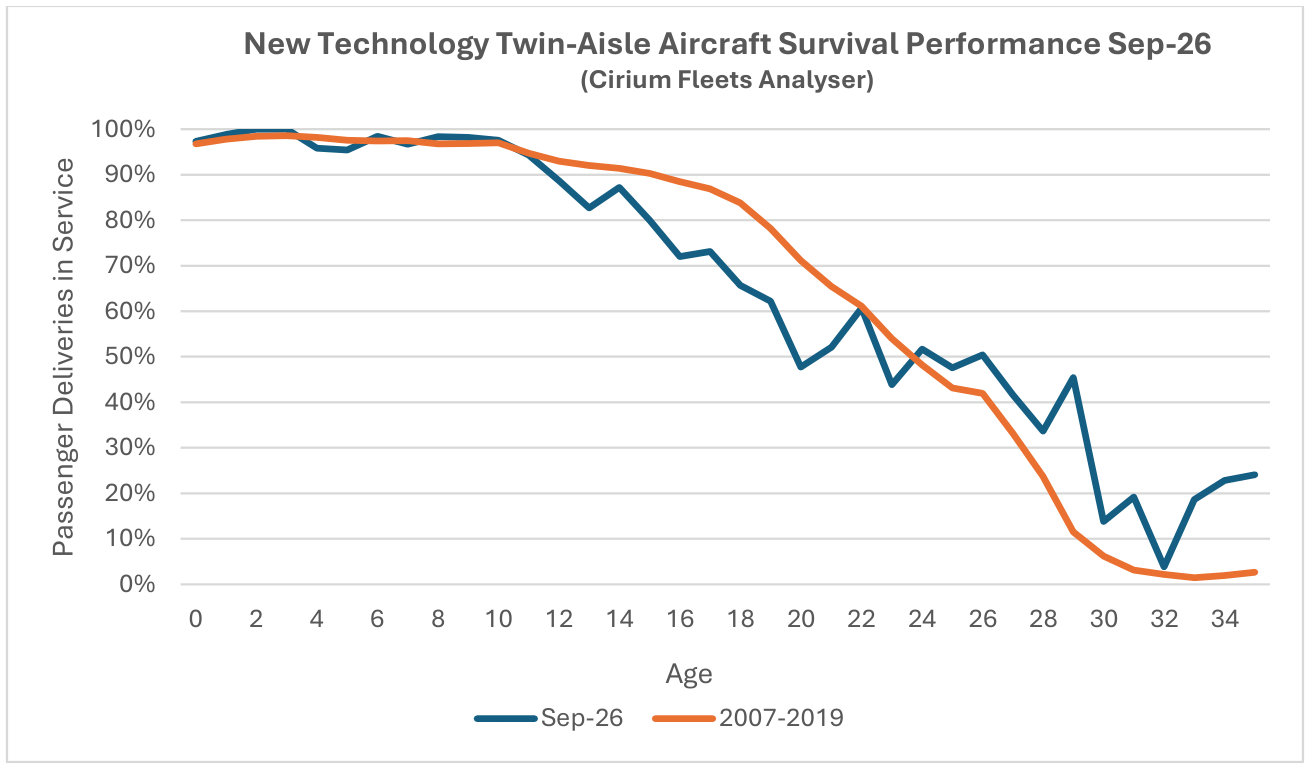
The reason that there is a problem appears to be that there has been a significant increase in the rate at which these aircraft are permanently removed from service since 2007-2019 on both an absolute and an age-adjusted basis. The chart below shows the absolute numbers.
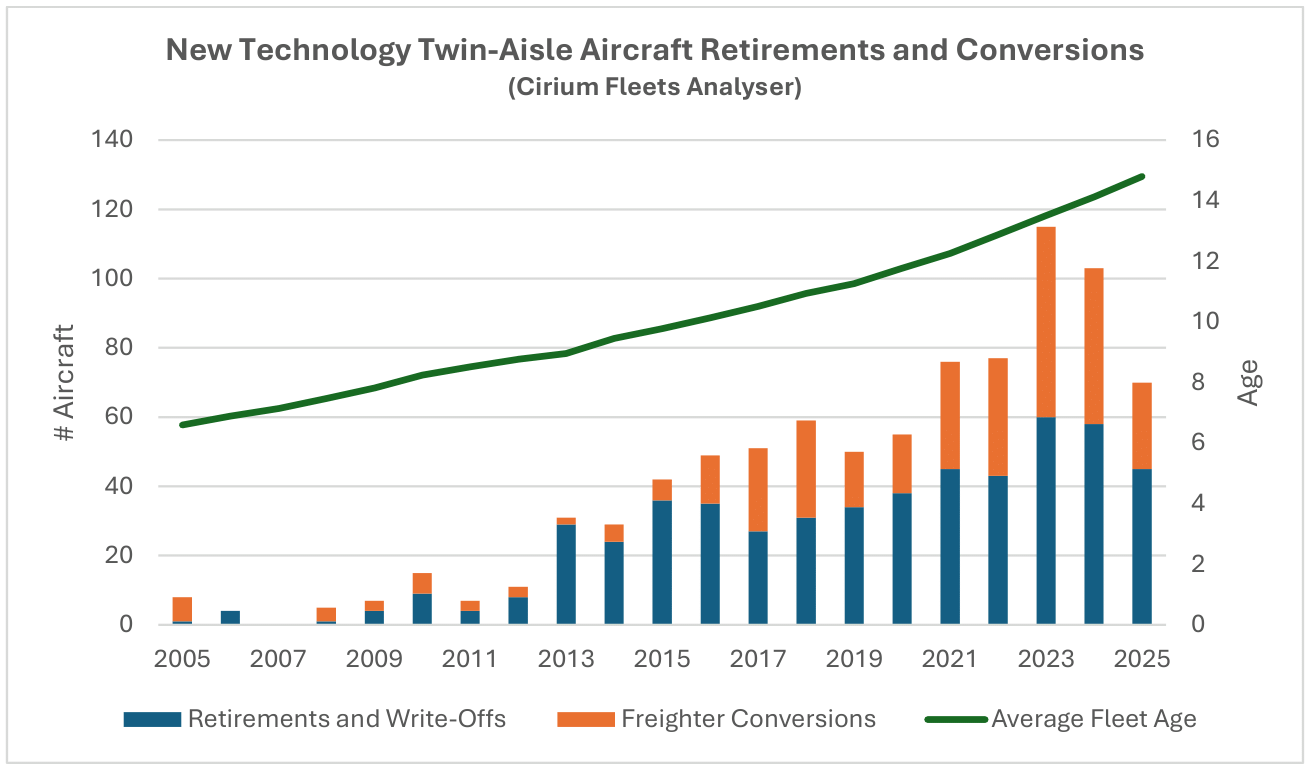
Although fleet age increases at a steady rate, retirements increase sharply after 2012, and freighter conversions follow a similar pattern after 2015. The explanation for the latter may well be driven by the preferences of the market participants that undertake freighter conversions – a key part of their decision-making is whether they can acquire “feedstock” at a reasonable price and this would have biased their aircraft acquisitions towards old technology aircraft for as long as possible. This interpretation is supported by the fact that only ten old technology aircraft have been converted since 2015.
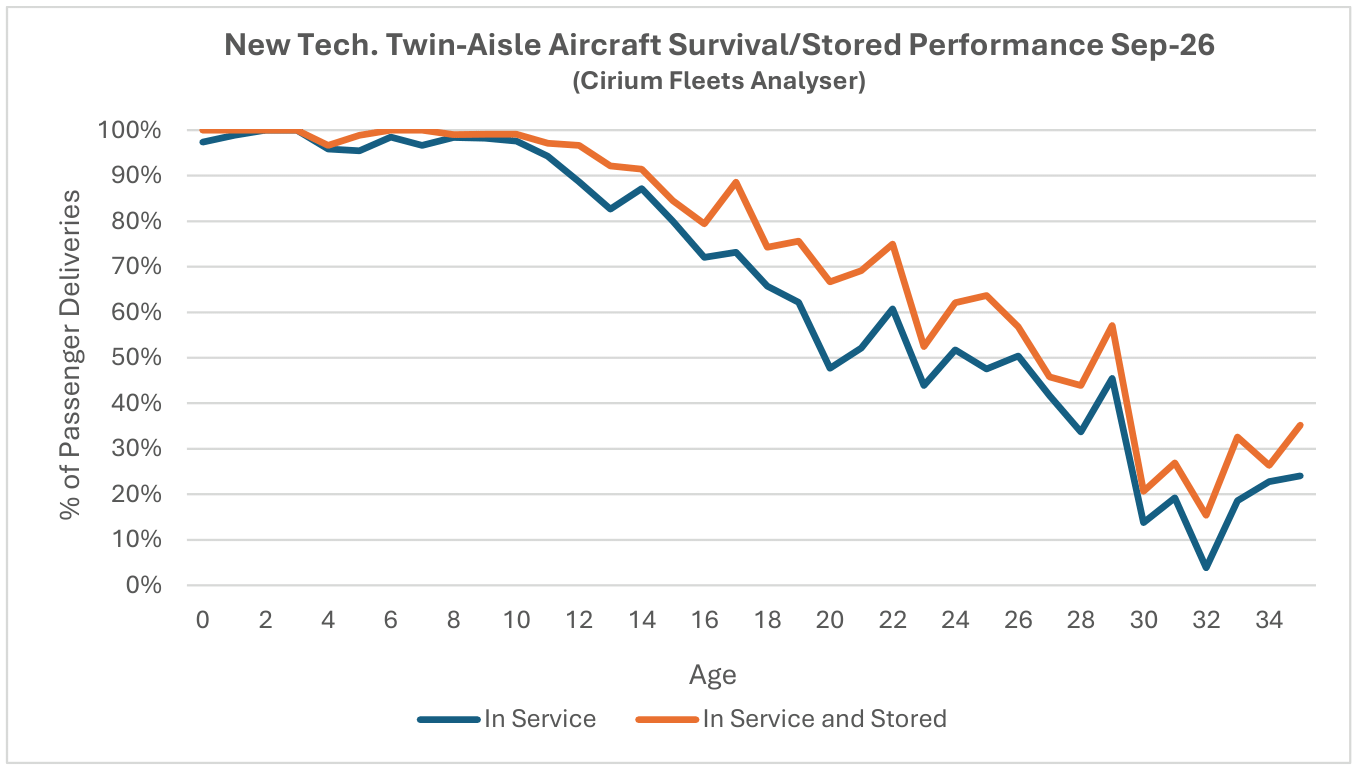
We can see the impact of aircraft being permanently removed from the passenger fleet on an age adjusted basis if we look at in service and stored aircraft by age compared with in service only. The two lines follow a very similar pattern which suggests that what is really driving the in-service curve is the number of remaining aircraft by age rather than a change in storage levels.
Given the problems in developing a sensible benchmark based on historic data the time series analysis of aircraft in service and ASKs presented above for single-aisle aircraft is not very useful. As a simple fix we can use the 2007-2018 single-aisle curve. This gives us sensible answers for today in terms of actual vs expected aircraft in service (100%) and available capacity (99%) but shows historical numbers that are unrealistically tight for most of the decade 2005-2015.
This kind of analysis underlies a lot of the forecasting methodologies that aircraft manufacturers use to estimate future demand, so it is important. However, sometimes it can be difficult to draw strong conclusions based on the historic data. The challenge posed in the single-aisle market is to make sense of unprecedented levels of young aircraft in storage, but this should be temporary. The twin-aisle market presents a different problem with changes in aircraft survival that are important in the long-term happening very quickly. To quote Niels Bohr “It is difficult to make predictions, especially about the future”.
Regular Topics
Macro-Economic Background
The latest IMF World Economic Outlook shows a continued marginal improvement in the forecast level of world GDP despite being published after the outbreak of war in the Middle East.
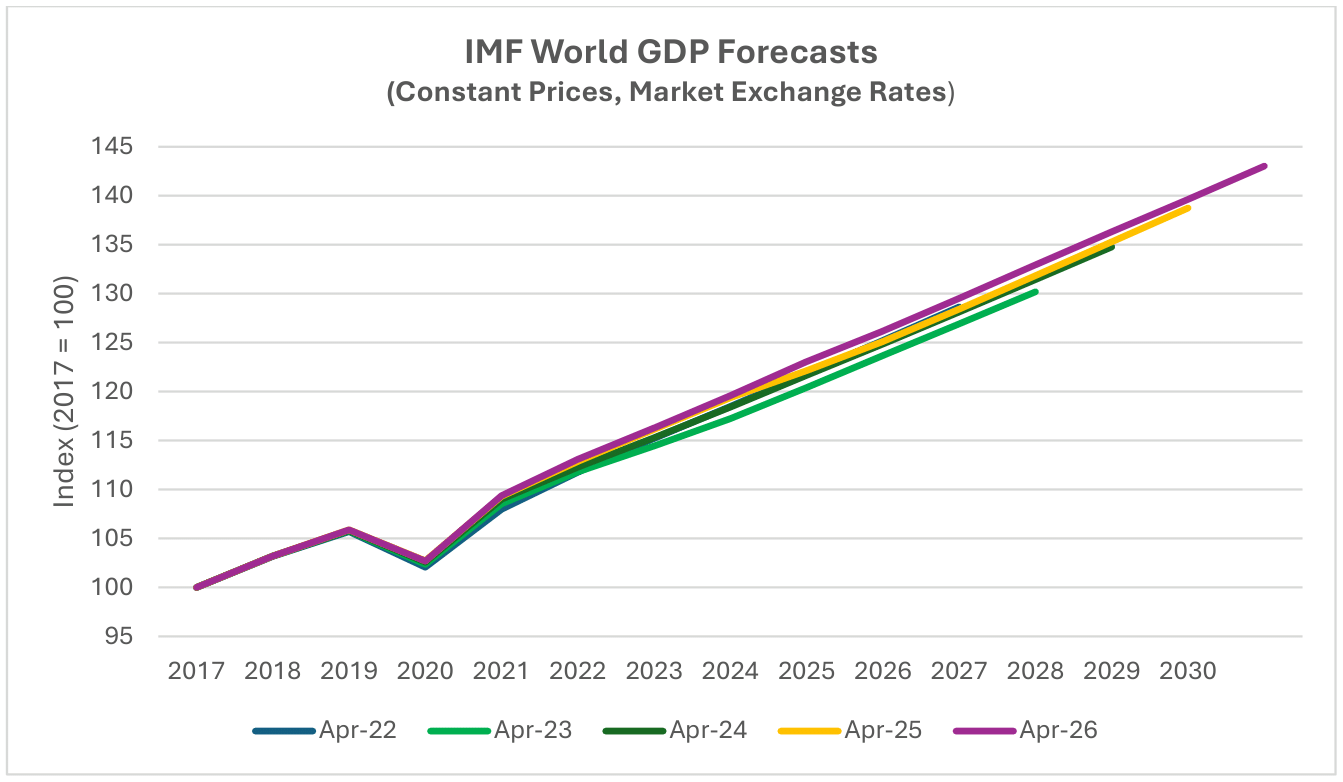
Economic growth is a key driver of long-term growth of air travel. However, since early 2020 its impact has been overshadowed by the fall and recovery in traffic associated with the pandemic. In time the influence of overall economic conditions on air travel is likely to reassert itself, but industry forecasts published by Airbus, Boeing and IATA assume much higher rates of traffic growth than GDP growth over the rest of the 2020s as the former catches up to its long-term trend (see our Q1 2024 Industry Update for a more detailed discussion).
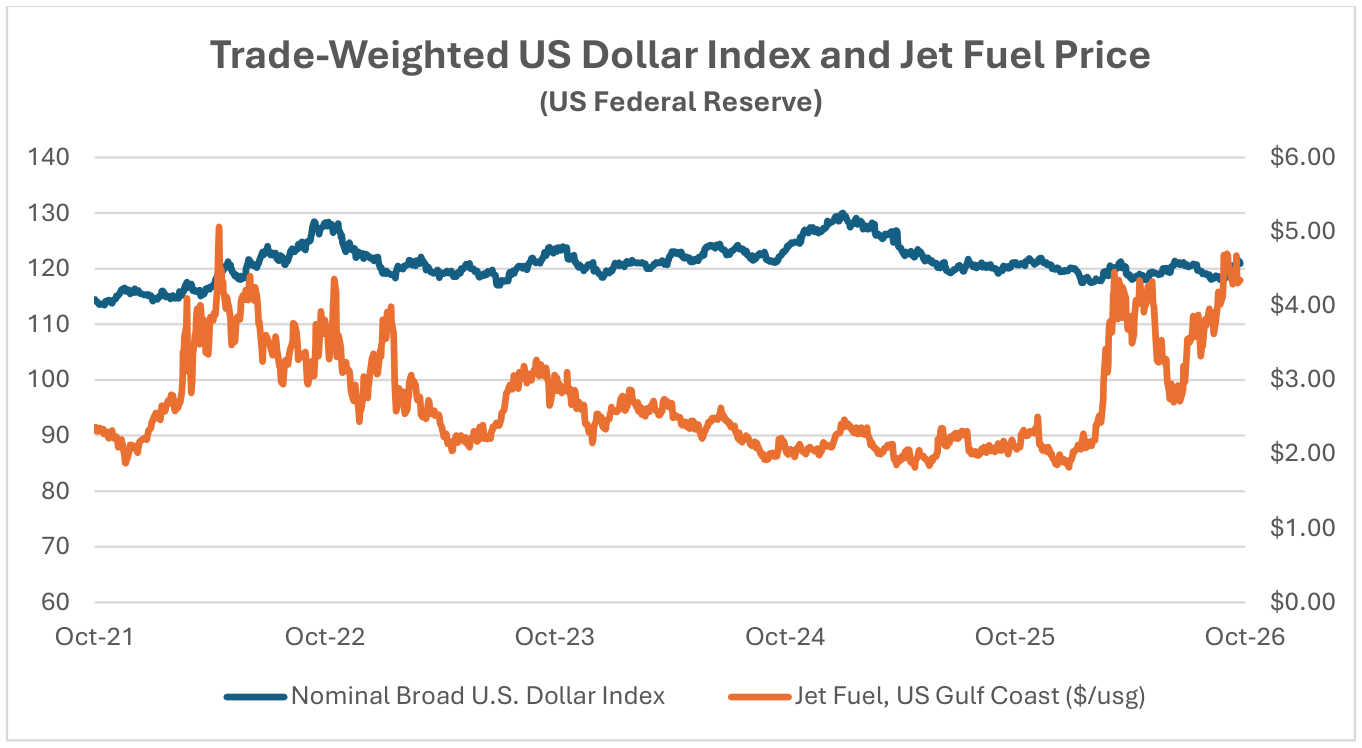
One clear impact of the war has been a spike in jet fuel prices by much more than the increase in the cost of crude oil. A consistent feature of this market since Russia’s invasion of Ukraine in 2022 has been a high prevailing “crack spread” compared to normal historic levels. We have no expertise in the jet fuel market, but the following extract from IATA’s Global Outlook for Air Transport (June 2026) provides some level of explanation for the current state of the market.
‘The disruption around the Strait of Hormuz is unfolding against an already challenging jet fuel market. Refining systems operate with limited spare capacity, supply chains are inflexible, and inventories offer only a temporary buffer. As a result, disruptions to crude flows tend to translate into more persistent tightness in refined products, with jet fuel particularly affected.
This shock comes on top of structural constraints that predate the current situation. The reconfiguration of global crude flows following the reduction in Russian oil availability has increased reliance on longer supply chains and reduced flexibility within refining systems. Jet fuel markets have therefore been operating with elevated crack spreads and limited spare capacity, leaving little room to absorb additional disruptions.’
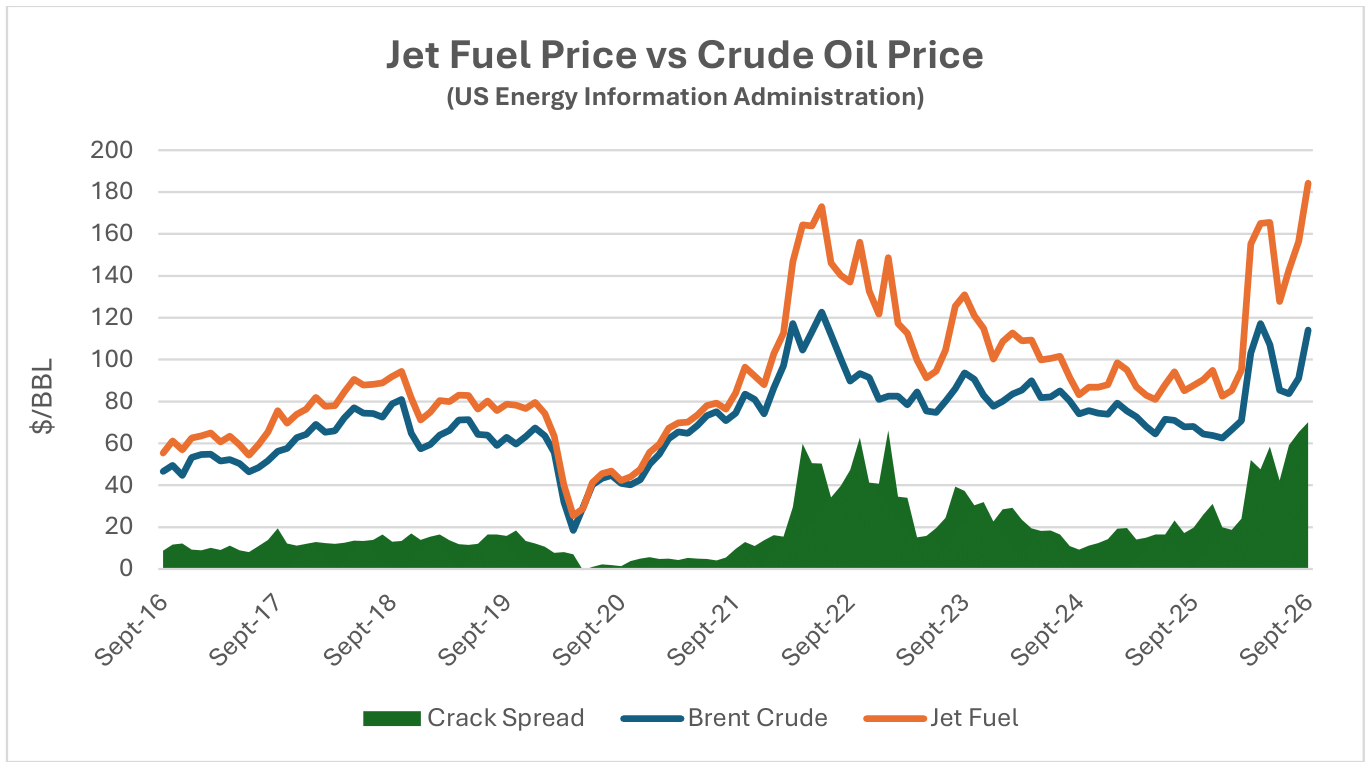
IATA is now forecasting that the average cost of jet fuel this year will be $152 per barrel, a 70% increase on 2025. Many airlines are still benefitting from fuel hedging programmes that are typically designed to reduce their exposure to the cost of jet fuel 6-12 months into the future, but the benefit of such initiatives is finite. Our regular listing of airline bankruptcies (see below) shows no obvious increase in financial distress so far in 2026, but risk levels will remain high unless circumstances change.
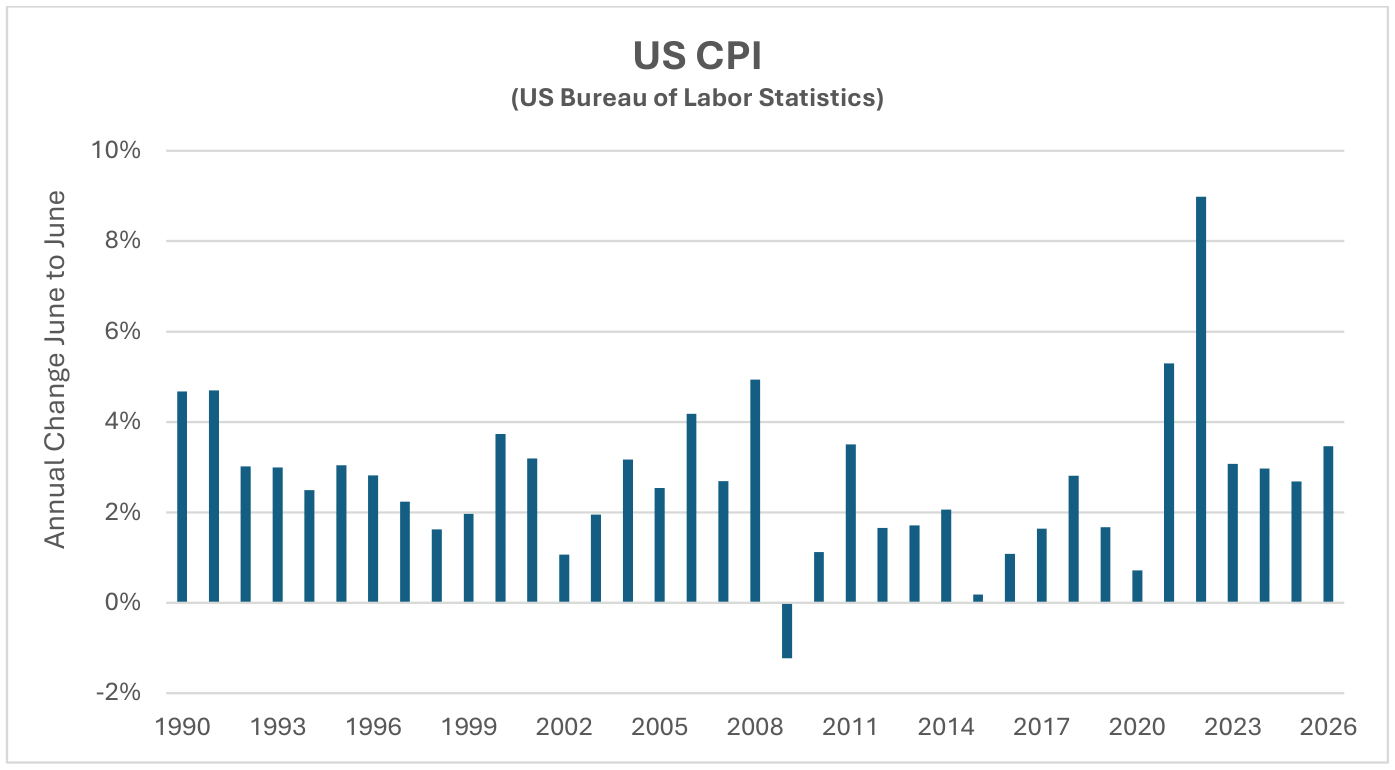
Another indicator that is potentially important to aircraft investors is the breakeven inflation rate on US Treasury Inflation-Protected Securities (TIPS). This indicator measures inflation expectations, and it matters because used aircraft values are strongly influenced by the cost of new aircraft and over time this cost is linked to US Dollar inflation. In the short term this linkage is driven by escalation clauses in aircraft purchase contracts and in the long term by the general input cost environment for the aircraft manufacturers. The chart below compares the breakeven rate for 10-year and 5-year TIPS.
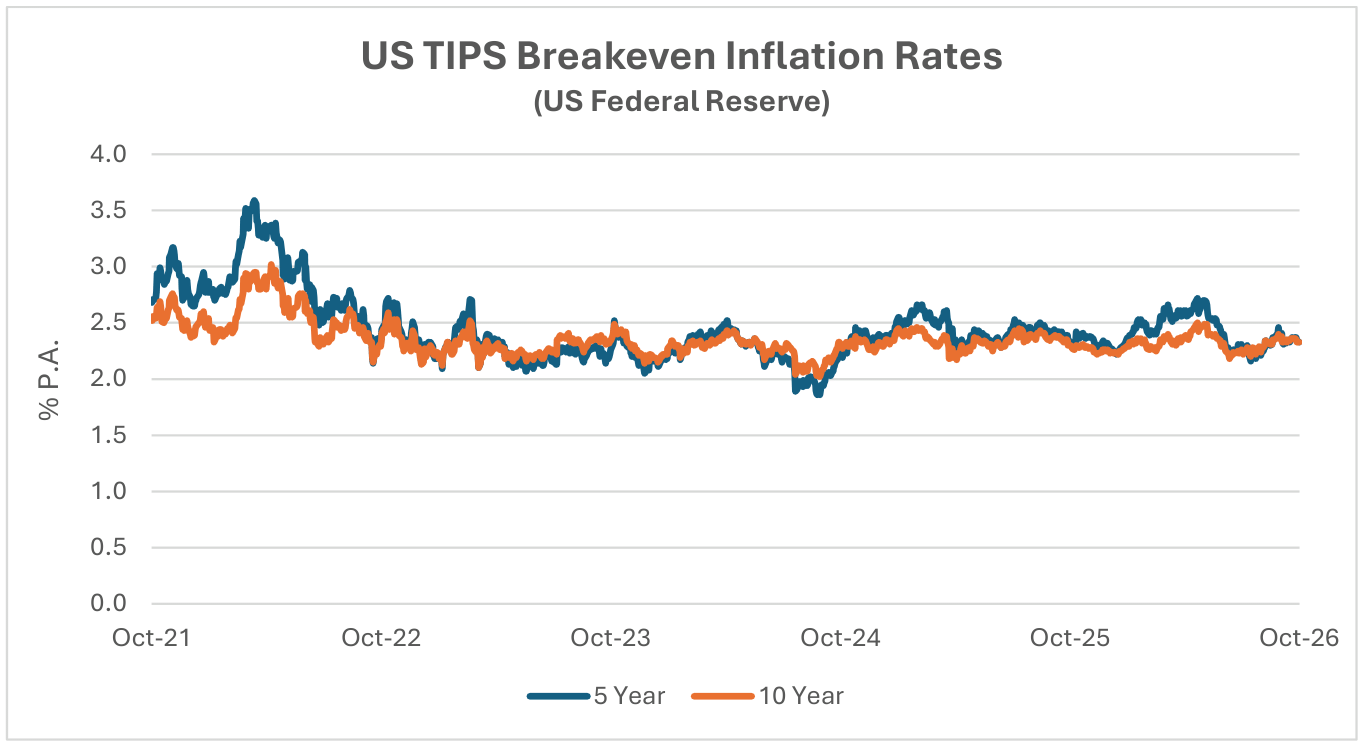
Although medium or long-term inflation expectations have never gone higher than 3.5%, actual inflation experience has often been much higher in the last few years. Our discussion above highlights the increase in new aircraft prices since the late 2010s and prevailing high oil prices are very likely to increase both general and aircraft inflation.
Traffic and Aircraft Demand
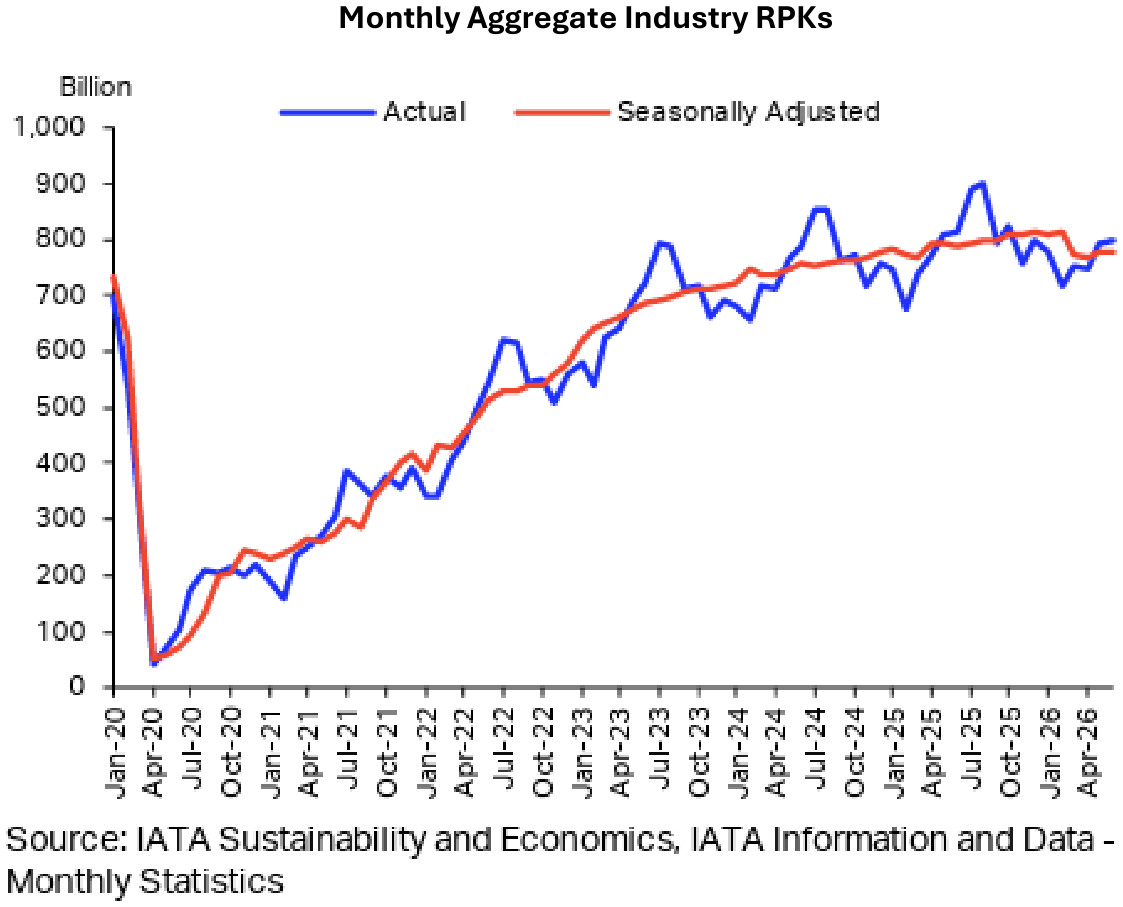
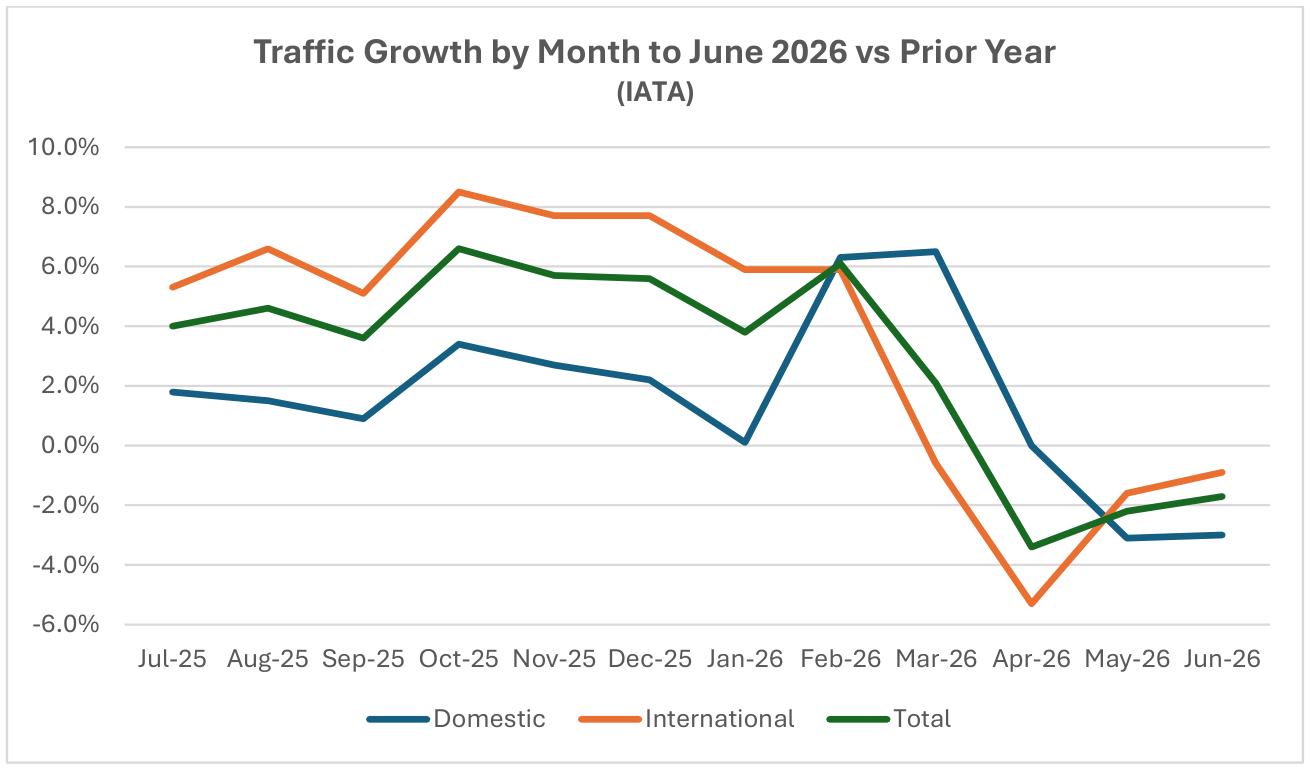
The direct and indirect effects of war in the Middle East led to a third month of traffic contraction in June 2026. The direct effects eased a little with less of a year-on-year drop in the Middle East region, but the indirect effects of higher fuel prices led to weakness in international and domestic markets worldwide. The weakness in domestic traffic was particularly striking with declines in all major markets except Brazil.
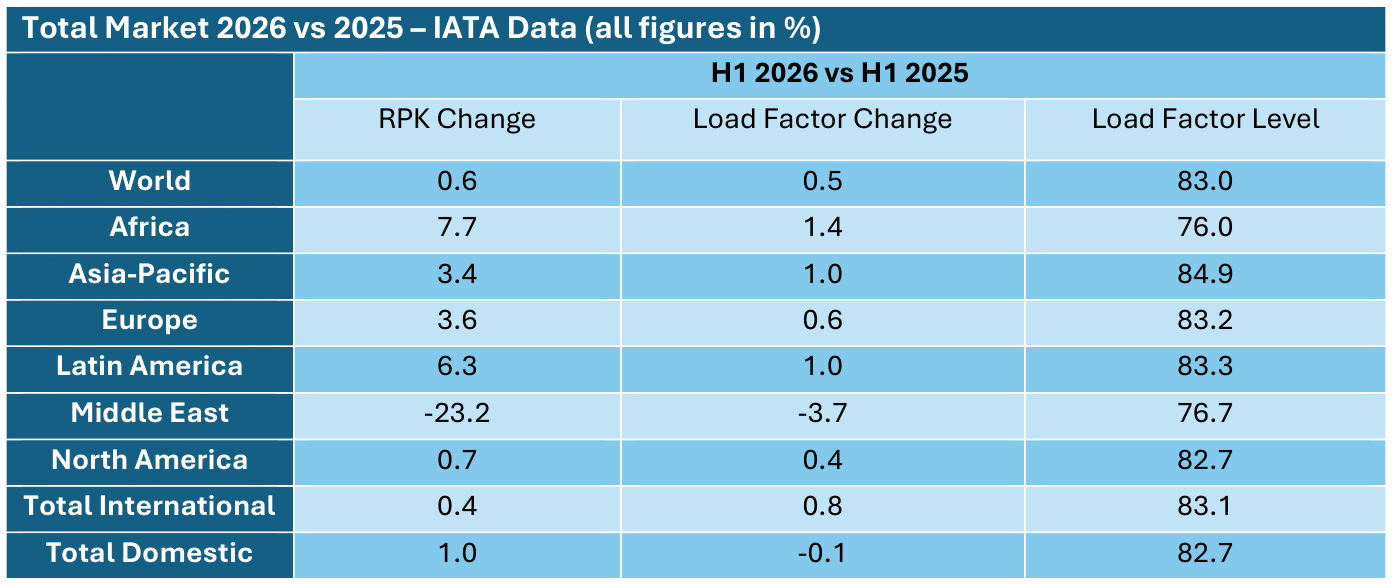
RPKs[1] for the first half overall were up 0.6% and a lower increase in ASKs[2] meant a 0.5% increase in load factor to 83.0%.
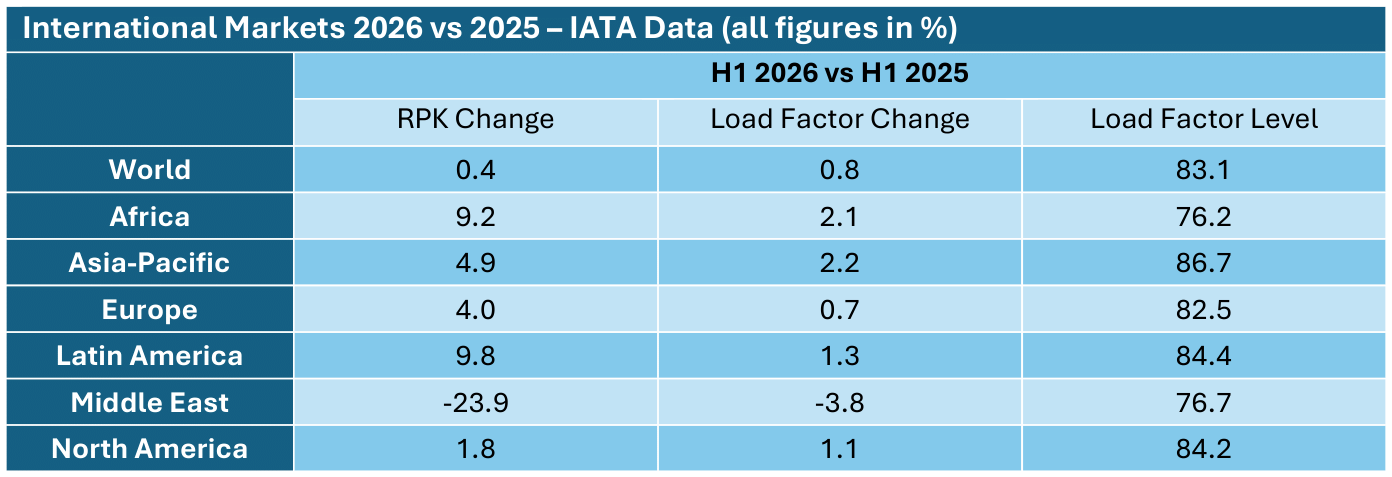
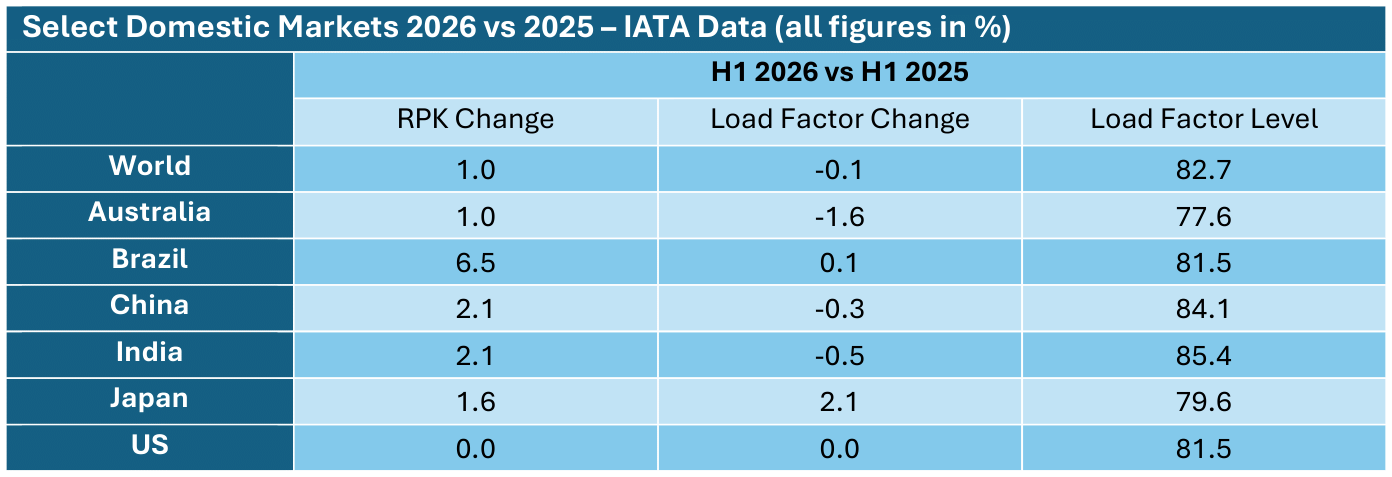
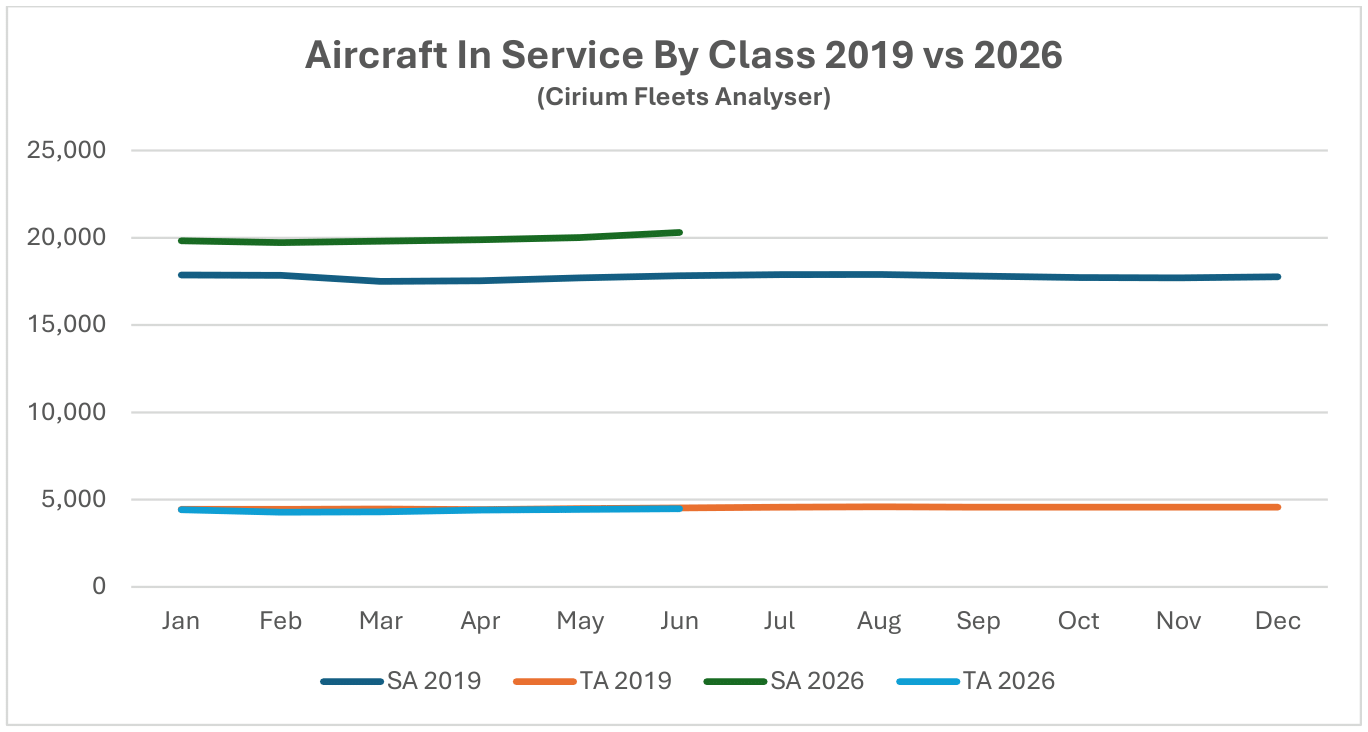
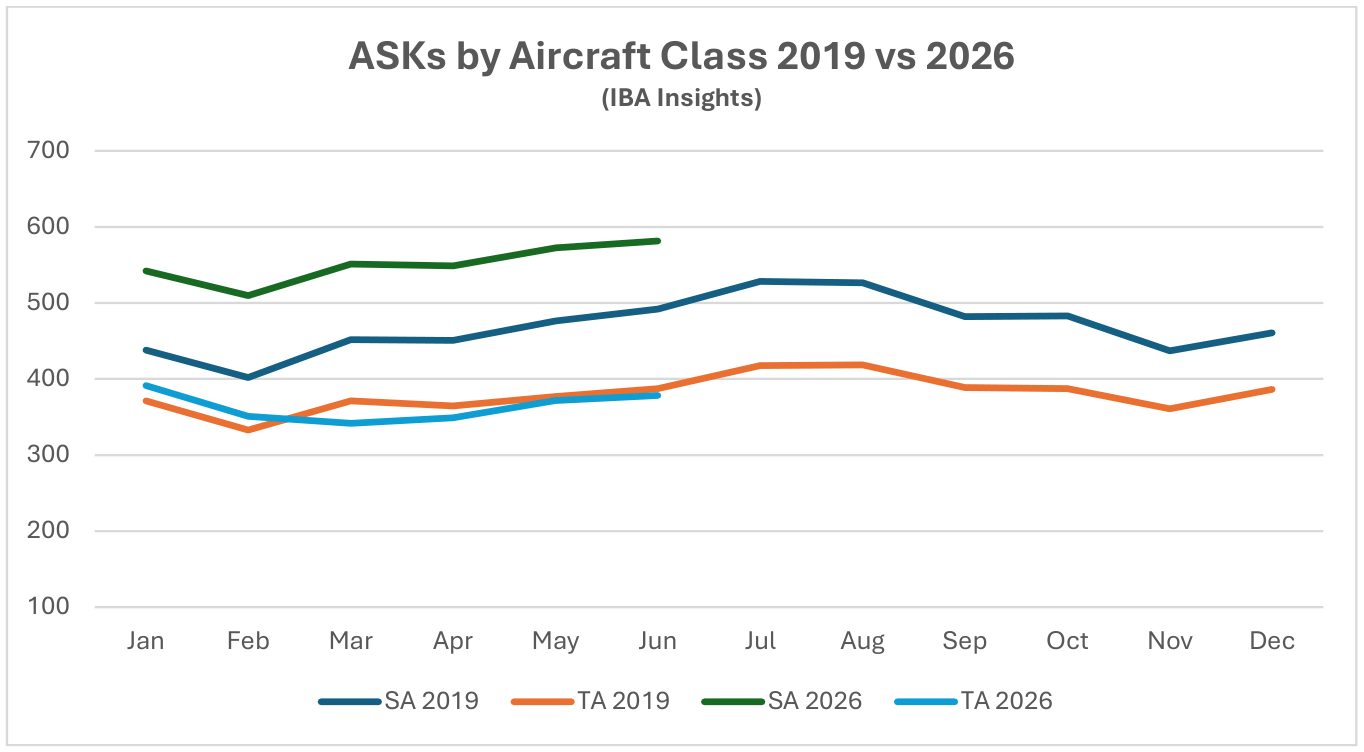
Although some short-haul aircraft serve international routes nearly all long-haul aircraft do so, and this is reflected in the relative demand for single-aisle (narrowbody) and twin-aisle (widebody) aircraft. Aircraft demand can be measured in terms of aircraft in service and ASKs, the standard measure of aircraft capacity deployed by airlines which indicates how intensively aircraft are being flown.
Single aisle aircraft demand on both metrics is consistently higher so far in 2026 than in 2019 whereas twin-aisle aircraft situation is more complex. Twin-aisle ASKs were ahead of 2019 for January and February and then fell back in March and April as Middle East airlines reduced capacity. Since April there has been a gradual recovery back to 2019 levels. The figures for January and February suggest there may be an improved outlook for the twin-aisle market if and when industry conditions normalise.
New Aircraft Supply
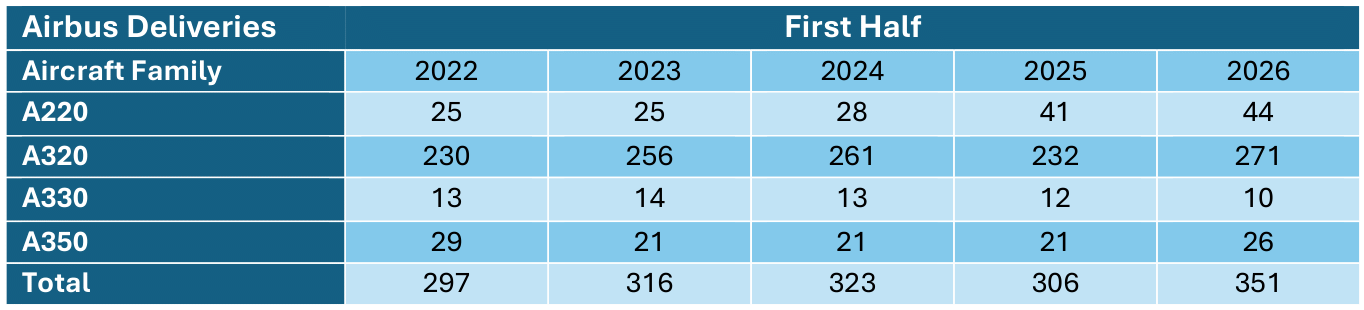
After a weak first quarter Airbus delivered more aircraft in H1 2026 than in either H1 2025 or H1 2024 and maintained its guidance at 870 deliveries (margin of uncertainty plus or minus 20) for the full year. Most of its immediate supply chain issues were largely resolved, particularly the shortage of P&W GTF engines and interior panels.
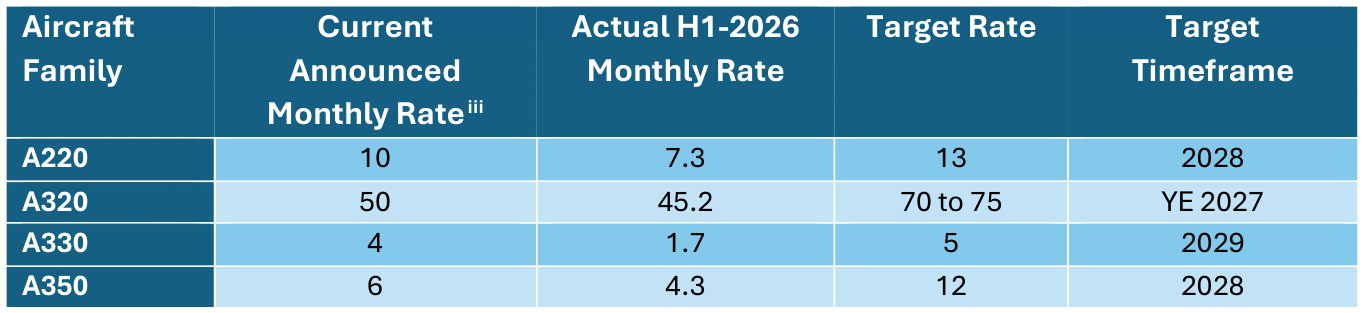
There has been no change in Airbus’s medium-term production plans (the current production figures in the table above include some external estimates as well as official Airbus guidance). The A350F is on track to make its first flight in 2026.
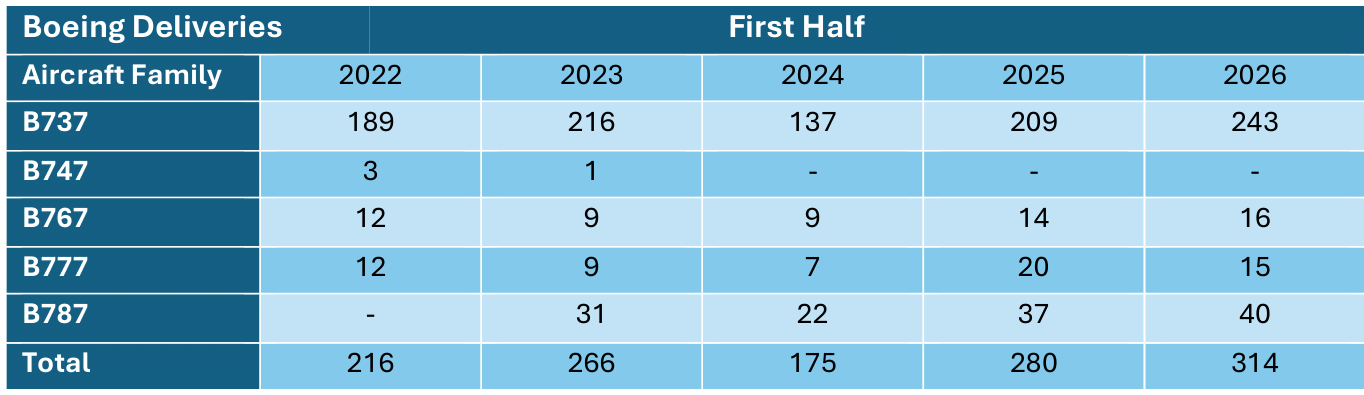
Boeing’s recovery continued in H1 2026. 737 Max production reached 42 per month and there are plans to increase the rate to 47 later this year with a further increase to 52 in 2027. The second increase will involve a new production line which was activated in July 2026. This line will focus on the -7 and -10 Max variants which should start to deliver in 2027 after achieving their long-delayed certification.
In Q1 2026 some B787 deliveries were delayed because of delayed supply of GEnx engines and there are other supply chain issues with business class seats. It is planned to increase production to 10 per month by the end of 2026.
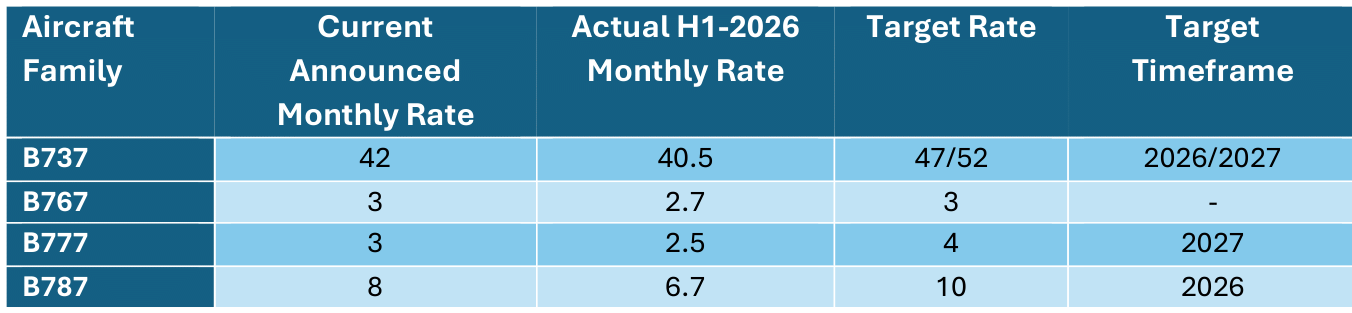
There is no firm timetable for further production increases for the 737 Max, but Boeing management have discussed future monthly rates of up to 63. Boeing is also working on a new production line for the B787 which is expected to be ready in 2028 and would support rate increases to 14-16 per month. The B777X is scheduled to enter service in 2027 after multiple delays.
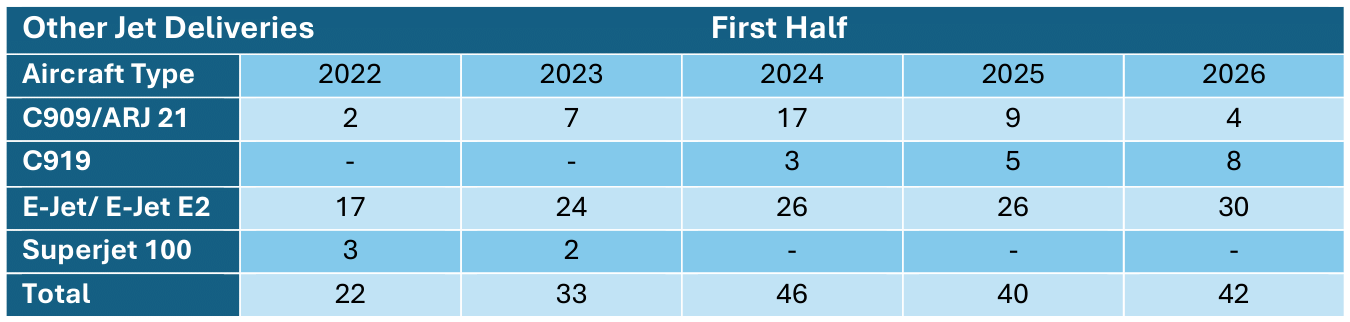
The number of deliveries by other aircraft manufacturers grew modestly in H1 2026 compared to H1 2025. An increase for Embraer was partly offset by a modest fall at COMAC.
Airline Industry Financial Performance
IATA released a new airline industry financial forecast in June 2026 as part of its semi-annual Global Outlook for Air Transport. The table below compares key forecast outputs for 2026 with IATA’s previous forecast published in December 2025.
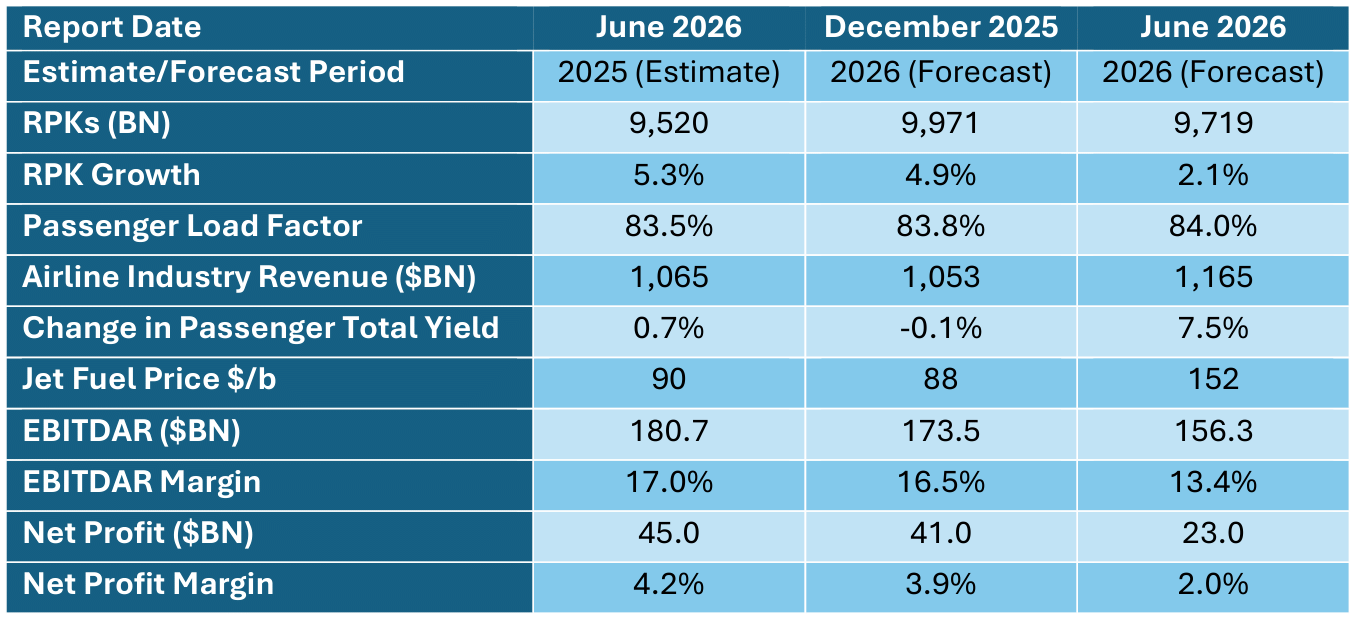
The new forecast reflects the impact of war in the Middle East with both traffic growth and net profits both dropping by about half.
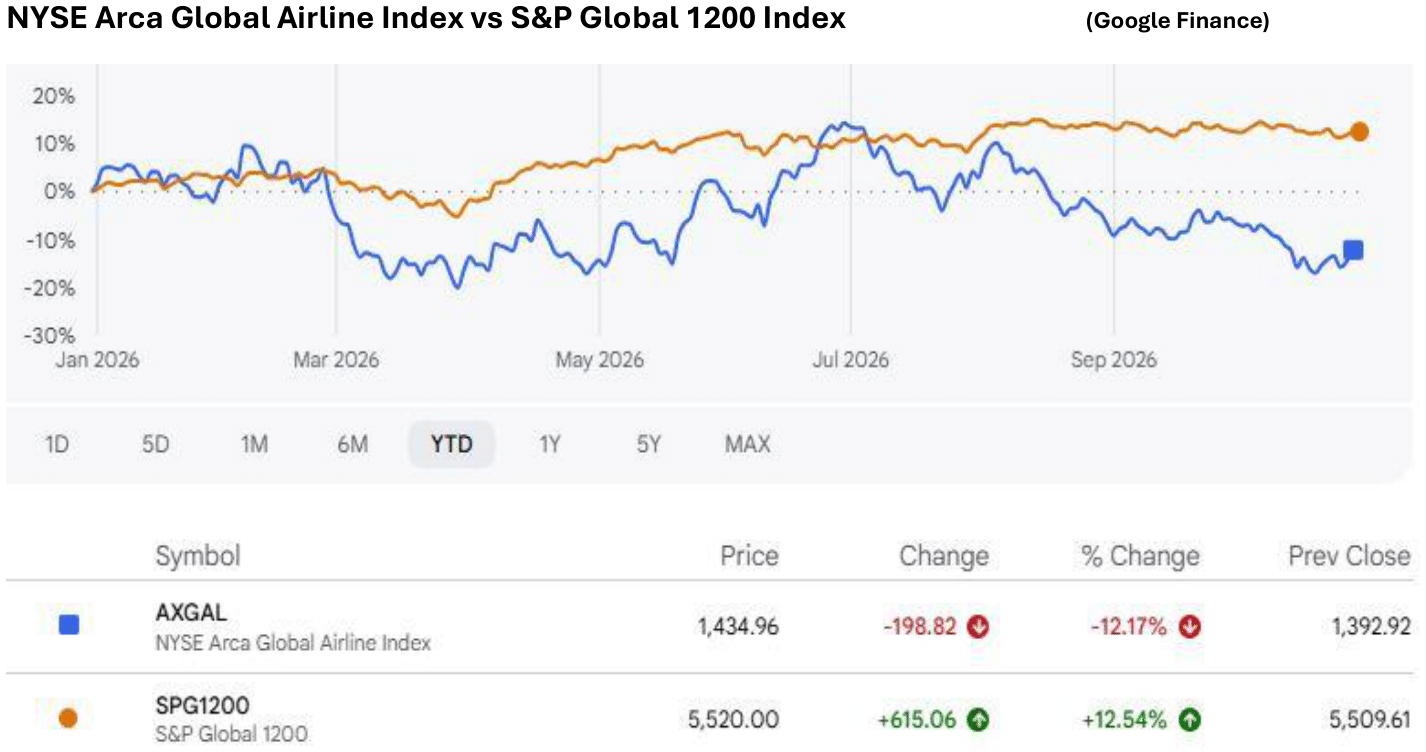
It is no surprise that airline stocks have underperformed the overall market since the end of February as higher fuel prices will hurt earnings both directly and indirectly by pushing up ticket prices.
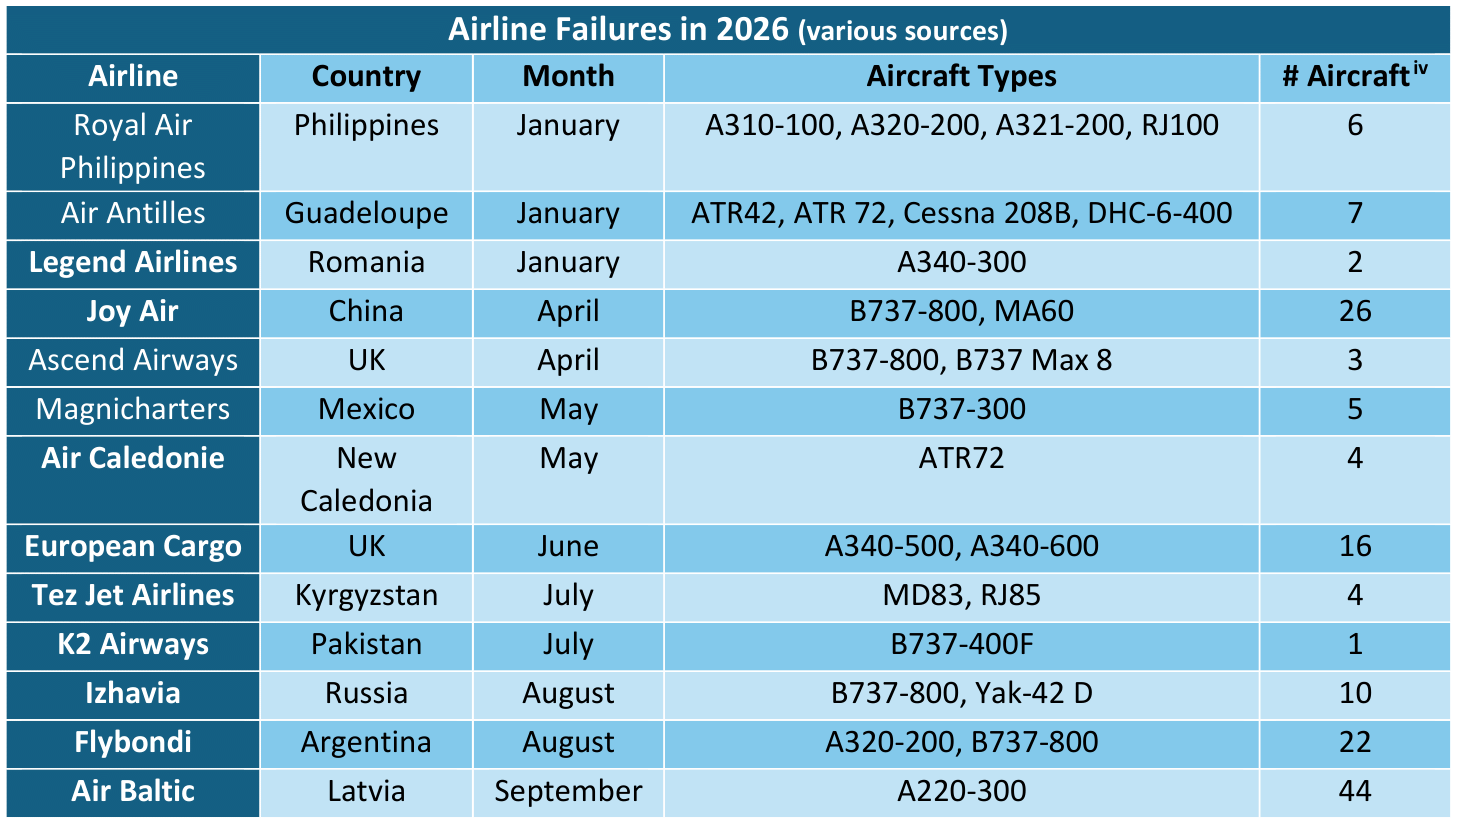
There have been very few airline failures so far in 2026 and those that have gone bankrupt and/or shut down are small so will not result in a lot of aircraft needing to be redeployed (most of the aircraft operated by Joy Air were the Chinese-built MA60 turboprop aircraft which has a very limited international market).
Spirit Airlines is not on this list because it went into bankruptcy in 2025. Spirit shut down in May 2026, and this has created a redeployment challenge for the aircraft leasing industry which has to find new homes for 66 A320 family aircraft including both Ceo and Neo variants. The current industry background is obviously not ideal so it will take time to work through this inventory, but there are no lessors with high exposures relative to their overall fleets, so this process is very likely to be orderly.
Endnotes
[1] RPKs is the acronym for revenue passenger kilometres, which is the product of the number of paying passengers times distance flown.
[2] ASKs is the acronym for available seat kilometres, which is the product of the number of available seats flown times distance flown.
[3] Airbus normally quotes its production rates based on an 11.5-month year for single-aisle aircraft.
[4] Fleet numbers are as of December 31st, 2025.
Disclaimer
This Presentation has been made to you solely for general information purposes and is not intended to provide, and should not be relied upon for legal, tax, accounting, investment, or financial advice. This Presentation is not a sales material and does not constitute or form any part of any offer, invitation or recommendation to the recipient, its affiliates or any other person to underwrite, sell or purchase securities, assets or any other product, nor shall it or any part of it form the basis of, or be relied upon, in any way in connection with any contract or transaction decision relating to any securities, assets or any other product. None of Sirius, its affiliates or shareholders shall have any responsibility or liability to the recipient, its affiliates, shareholders or any third party in relation to this Presentation or any other document or materials prepared by Sirius or its affiliates, officers, directors, employees, advisers, or agents. Sirius and its affiliates, officers, directors, employees, advisers, and agents have taken all reasonable care to ensure that the information contained in this Presentation is accurate. Neither Sirius nor any of its affiliates, officers, directors, employees, advisors, or agents has any obligation to update this Presentation. Under no circumstances should the delivery of this Presentation, irrespective of when it is made, create an implication that there has been no change in the affairs of the entities that are the subject of this Presentation. This Presentation may be updated and amended by a supplement and, where such supplement is prepared, this Presentation will be read and construed with such supplement. The statements herein which contain such terms as “may”, “will”, “should”, “expect”, “anticipate”, “estimate”, “intend”, “continue” or “believe” or the negatives thereof or other variations thereon or comparable terminology are forward-looking statements and not historical facts. No representation or warranty, express or implied, is made as to the fairness, accuracy, or completeness of such statements, estimates and projections. The recipient should not place reliance on any forward-looking statements. Neither Sirius nor its affiliates undertake any obligation to update or revise the forward-looking statements contained in this Presentation to reflect events or circumstances occurring after the date of this Presentation or to reflect the occurrence of anticipated events. The information set out in this Presentation has been prepared by Sirius based upon various methodologies and calculations which it believes to be reasonable and appropriate. Past performance cannot be a guide to future performance. In preparing this Presentation, Sirius has relied upon and assumed, without independent verification, the accuracy and completeness of all information available from public sources or which was provided to it or otherwise reviewed by it. This Presentation supersedes and replaces any other information provided by Sirius or its affiliates, officers, directors, employees, advisers, or agents in respect of the content of the Presentation. No information or advice contained in this Presentation shall constitute advice to an existing or prospective investor in respect of his personal position. None of Sirius, its affiliates, or its affiliates’ officers, directors, employees or advisers, connected persons or any other person accepts any liability whatsoever for any loss howsoever arising, directly or indirectly, from this Presentation or its contents.