- Special Topic – Aircraft Economic Life
- Macro-Economic Background
- Traffic and Aircraft Demand
- New Aircraft Supply
- Airline Industry Financial Performance
Where are all the early retirements? Is it different this time?
Aircraft Economic Life
As we discuss in more detail below 2024 was another very weak year for new aircraft deliveries. The recent decline is unprecedented as the delivery trough was 723 aircraft, 45% of the prior peak of 1,619, but on this metric, it is not much more severe than the decline of the early 1990s where the trough was 385, 50% of the prior peak of 771 (these figures include McDonnell Douglas although it had not yet been acquired by Boeing).
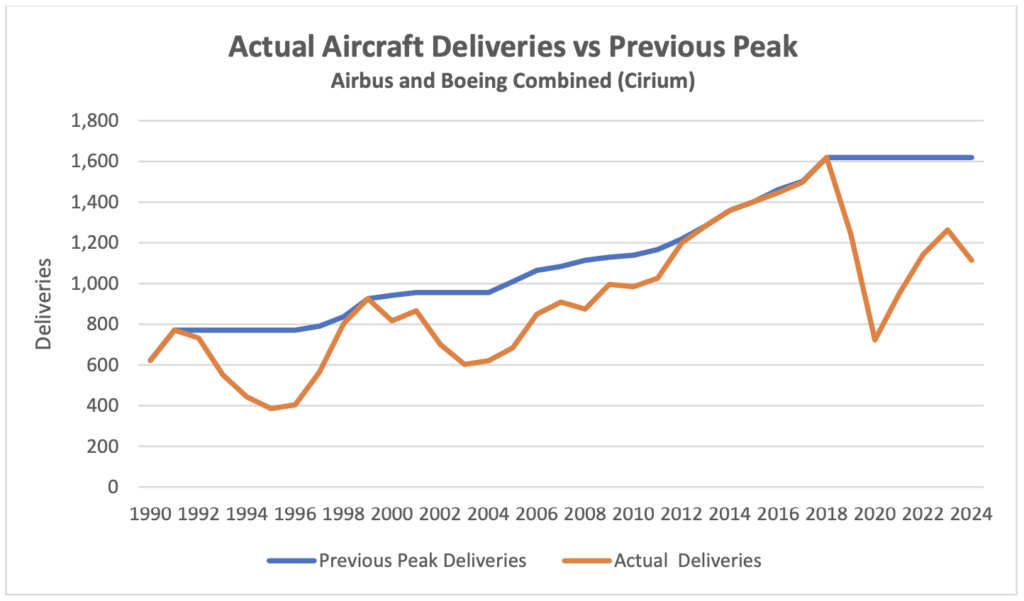
It took until 1998 for deliveries to exceed the level achieved in 1991. We are now in 2025, which is also 7 years after peak deliveries, but we are probably still some years away from the level achieved in 2018. There is strong evidence of increased demand for used aircraft because of the shortfall in new capacity and as one would expect the average age of aircraft has increased (the charts below refer to passenger aircraft only – although some passenger aircraft have their lives extended by conversion to freighter and other uses the numbers are relatively small).
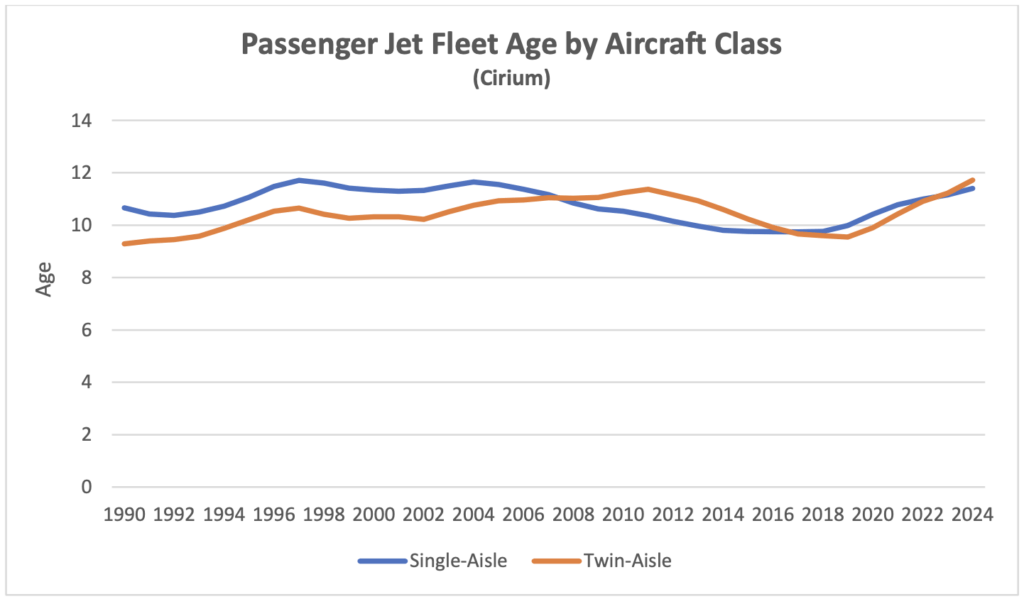
As one might expect a low level of new aircraft deliveries has led to an increase in average fleet age, which is now as high as it has ever been since 1990 for both single-aisle and twin-aisle aircraft (twin-aisle average aircraft age has gradually increased relative to single-aisle aircraft as the latter had a “head start” with entry into service 6 years before the first twin-aisle delivery).
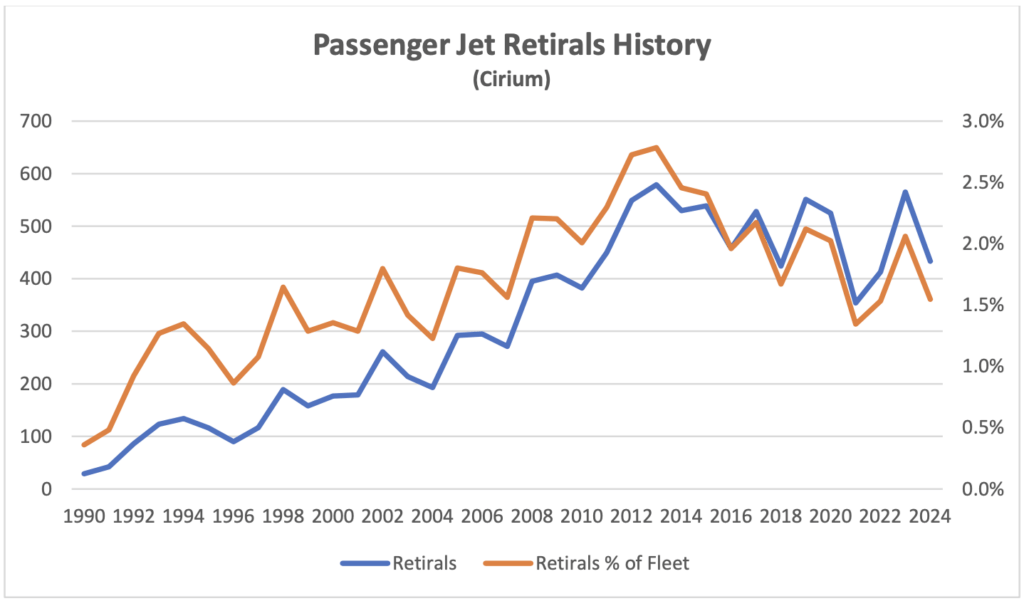
This increase in fleet age suggests it’s worthwhile to look at trends in aircraft retirals as these should be related. This raises the question of what the most useful data is to look at. If one considers the number of aircraft retirals, both in absolute terms and as a percentage of the world fleet, the results do not show any particular trend after 2010 – the increase prior to 2010 is largely due to the maturing of the world fleet as hardly any aircraft had been retired prior to 1990 other than obsolete early technology types.
A more helpful way to analyse retirals data is to look at average age at retiral where a much stronger pattern emerges with a “plateau” from around 2001 to 2008 with a gradual decline thereafter. This helps to explain why retiral volumes are volatile – if retirement ages only change very gradually but the level of historic new aircraft delivery volumes was volatile it follows that retiral volumes will also be volatile. It is also noteworthy that retiral ages are consistently higher for single-aisle aircraft because they are less exposed to several important risks especially improvements in technology which have a greater relative impact for aircraft that fly long-haul.
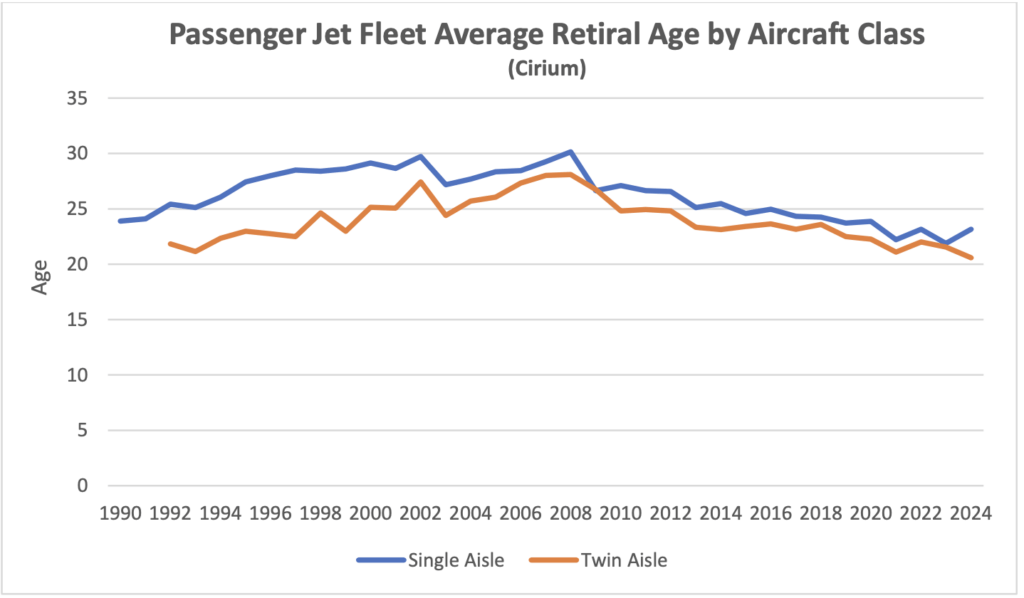
The impact on retiral age of reductions in new aircraft deliveries in the early 1990s and from 2019 has been very different. In the 1990s there was a sharp increase in age at retiral which one would expect given the drop in deliveries and increase in average fleet age. Although both these conditions have also prevailed since 2019 the long run drop in average age at retiral that started in 2008 has broadly continued.
We believe that the most important cause of this difference is the increased share of the fleet owned by lessors. As investors seeking to maximise the present value of their assets, lessors are typically reluctant to commit additional capital to redeploy an aircraft with a new airline operator once it reaches c. 18 years old because there is very little time in which to recoup this investment.
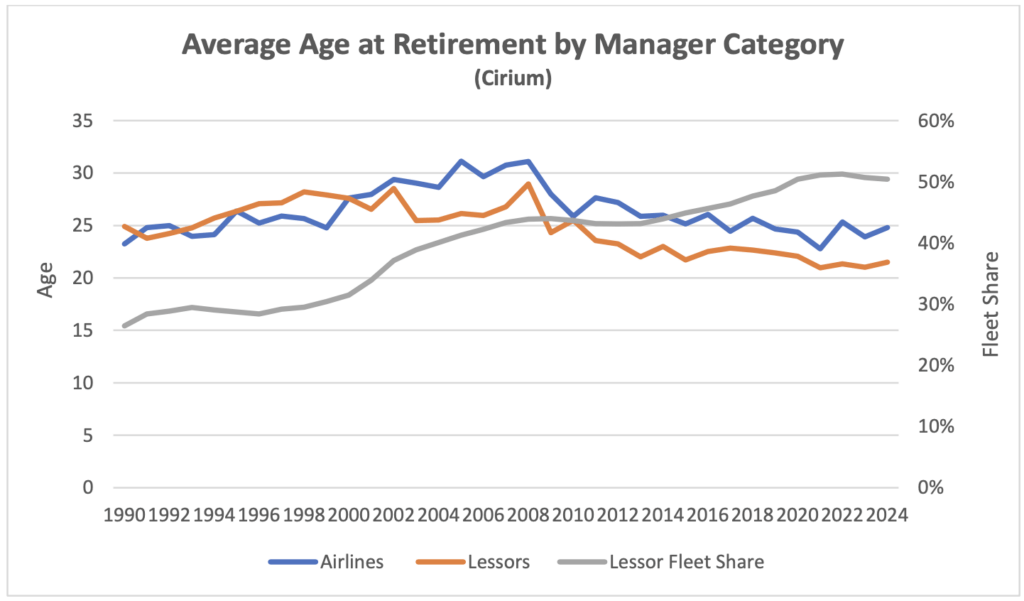
Lessors consistently retire aircraft at younger age than airlines as the redeployment cost issue does not arise for the latter.
The key factors affecting a lessor’s decision whether to reinvest are the break-up value of the aircraft and the cost of redeployment. Break-up values have been increasing relative to value in use for many years, mainly because the value of an aircraft’s principal components, its engines, have been increasing in relative terms. In 1998 engines accounted for c. 25% of the cost of a new aircraft whereas in 2024 the proportion was over 50%.
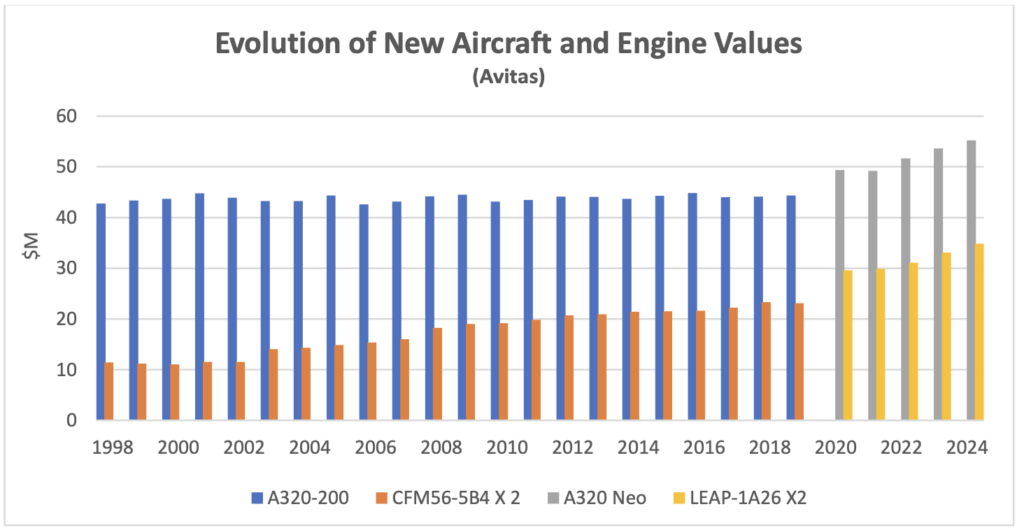
Break-up value is largely driven by engine values, which are in turn very dependent on the value of engine spare parts. The engine manufacturers have an effective monopoly on new spare parts and have historically enjoyed significant pricing power until c.10 years from when the relevant aircraft type ceases production. For many years engine spare parts prices have increased by 6-7% p.a. while new aircraft prices have increased by 1.0-1.5% p.a.
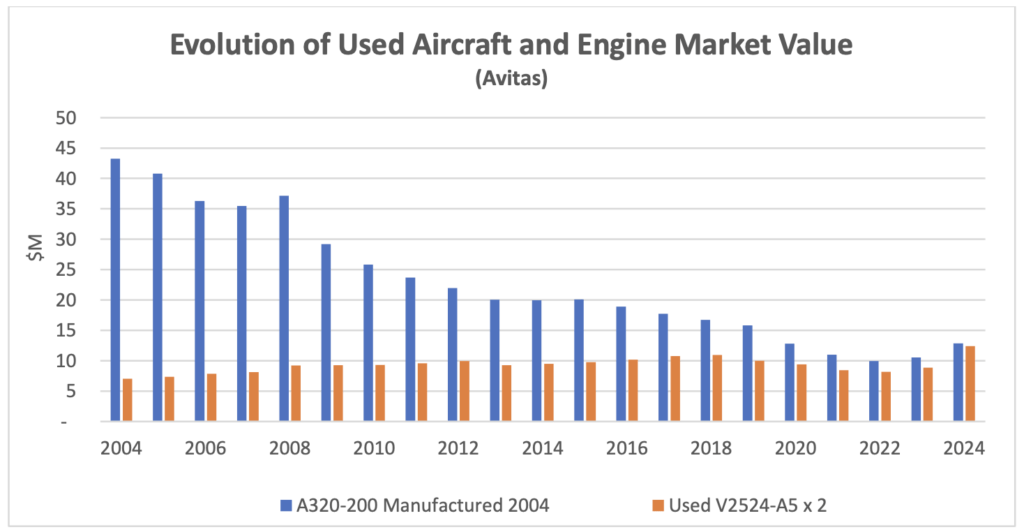
These trends have created a situation where stand-alone engine values can exceed an aircraft’s value including engines well before the point where the aircraft has reached its potential service life. Where an existing airline operator is happy to extend a lease, a lessor will have very little cost associated with extending its revenue stream and is likely to choose this option so not all aircraft will be broken up at the same age.
One way to test the importance of break-up values is to look at what has happened with different members of the A320 Ceo and B737 NG families. Break-up values are very similar for all family members, but the larger models command higher rents, so if break-up values matter, we should expect to see smaller types retired earlier and in greater numbers. The chart below shows how the different family members have performed through 2024 and supports this view. Smallest to largest aircraft types are presented left to right.
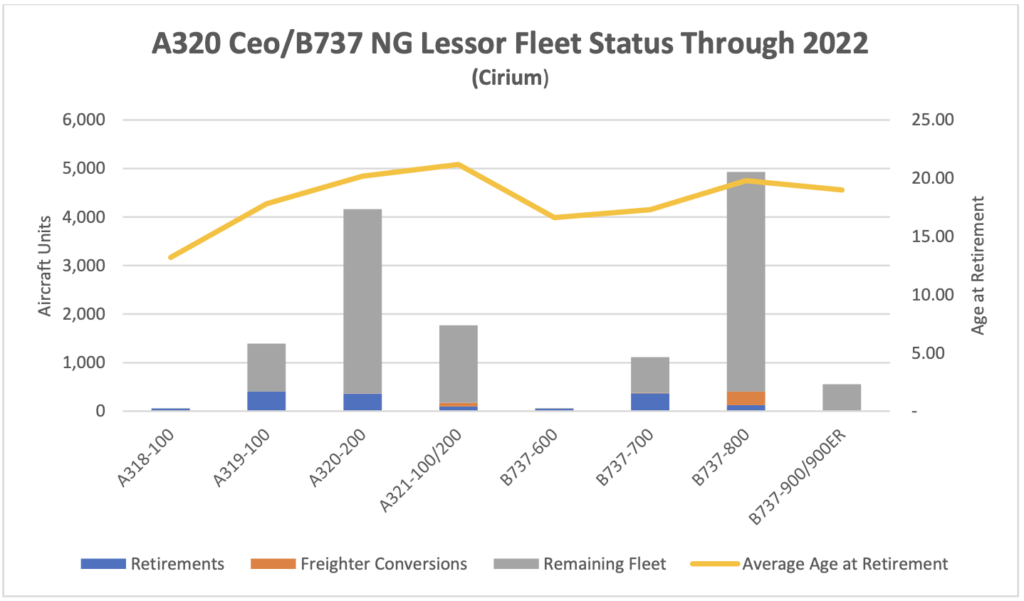
We believe the “pull factor” of attractive break-up values has been the main driver of reduced age at retiral for single-aisle aircraft but not for twin-aisle aircraft. It should be borne in mind that not all engine types have the same level of marketability. The CFM56 and V2500 engine types associated with the A320 Ceo and B737 NG aircraft families[1] are overhauled by several different market participants who compete to buy used engines. Most twin-aisle aircraft engines are subject to a total care agreement with the engine OEM which also dominates maintenance activity, so market dynamics are much less favourable for engine owners.
There are also major differences in relative redeployment costs because twin-aisle passenger cabins are more heavily branded and customised. A 12-year-old A320-200 with an Avitas market value of $22M would be very unlikely to cost more than $1M to redeploy, whereas an A330-300 of the same age with an Avitas market value of $31M could cost anything from $15M to $25M. Based on this we believe that falling ages at retiral for twin-aisle aircraft are more a function of “push factors”.
Whatever the causes the fall in deliveries and the continued reduction in age at retiral has created a very unusual distribution of aircraft by age compared to any time since 1990. Aircraft aged 5 to 20 years old account for an unprecedented fleet share and if anything, this is likely to increase.
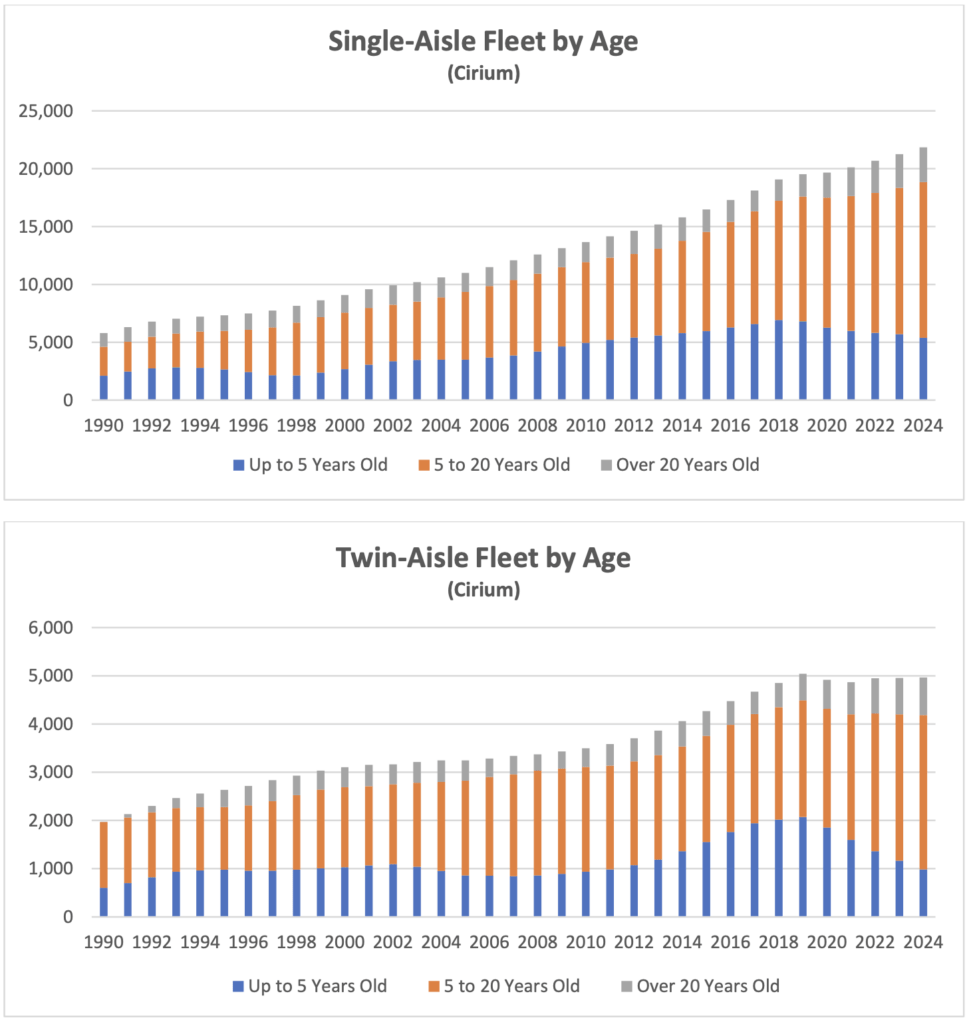
These unusual circumstances have not led to a “capacity crunch” so far. This is mainly because global RPKs remain well below their long-term trend (see our Industry Update for Q1 2024 Traffic Growth Outlook). Airlines have been very keen to extend leases as much because of uncertainty surrounding the timing of future deliveries as because of any immediate shortage of capacity.
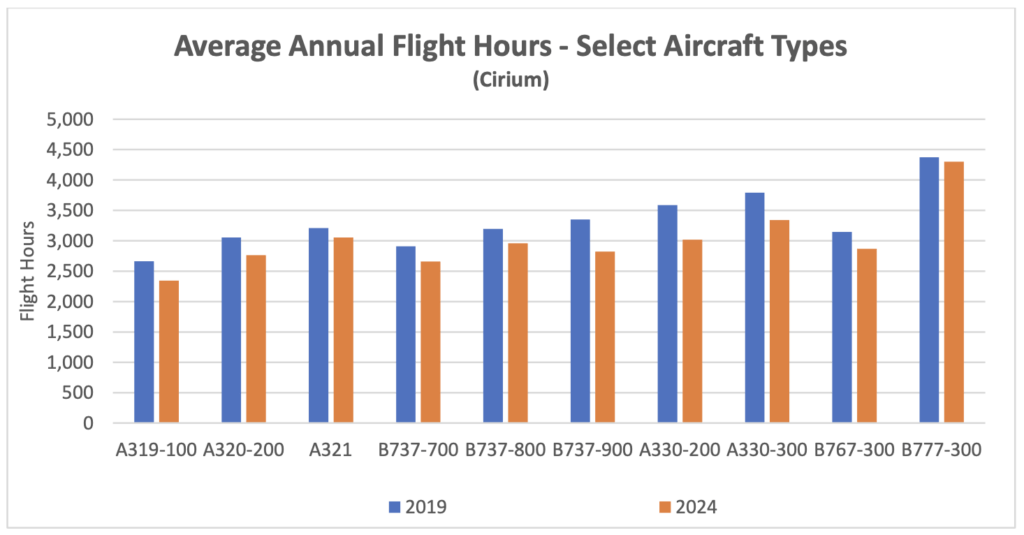
As a cross-check on the fleet data in the charts above we have looked at the utilisation of the aircraft types that are key constituents of the 5–15-year-old fleet. In all cases flight hours are lower than in 2024 than in 2019 with a greater gap for twin-aisle aircraft. A modest reduction in flight hours should be expected as these aircraft types were largely out of production around 2019 so on average, they were 5 years older in 2024 and aircraft productivity reduces with age. Load factors also influence aircraft productivity, and these were slightly higher in 2024 compared to 2019 (see below). To conclude it seems likely that either a continuing shortfall in new aircraft deliveries or a recovery in traffic towards its long-term trend (or a combination of the two) could lead to a significant tightening in the aircraft market.
Macro-Economic Background
The IMF’s January 2025 update to its World Economic Outlook had very similar projections for global GDP growth as in October 2024. The chart below compares the 2024 forecast with its three most recent predecessors. The forecast horizon moves forward each year, so it is helpful to create indices that help visualise the rate of change – obviously steeper is better. The October 2024 forecast was notably more positive than the previous two years. The next full WEO will be published in April 2025, and it will be interesting to see if their view has changed given the threat of significant disruption of international trade.
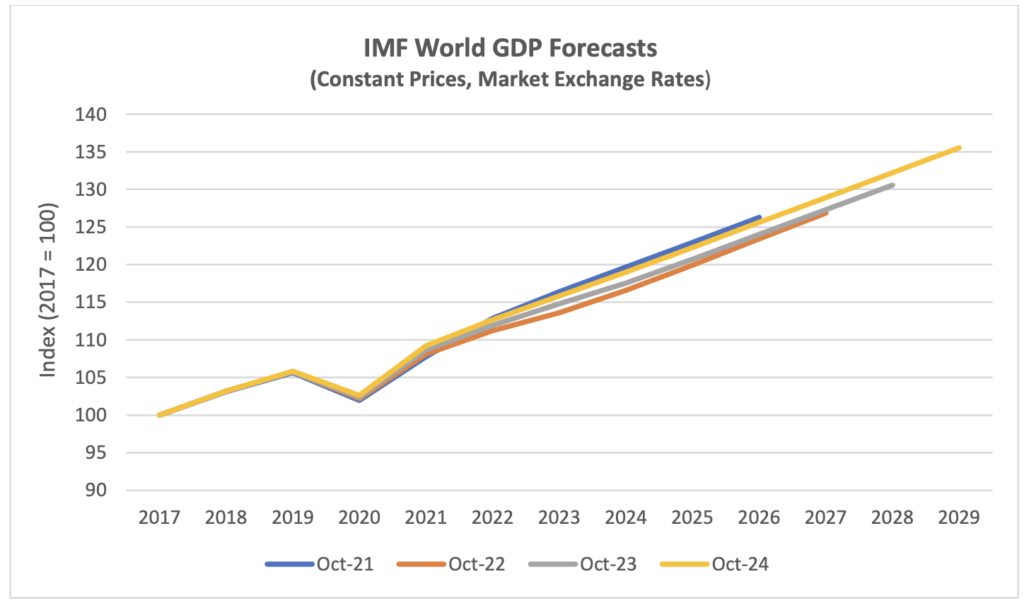
Economic growth is a key driver of long-term growth of air travel. However, since early 2020 its impact has been overshadowed by the fall and recovery in traffic associated with the pandemic. In time the influence of overall economic conditions on air travel is likely to reassert itself, but industry forecasts published by Airbus, Boeing and IATA assume much higher rates of traffic growth than GDP growth over the rest of the 2020s as the former catches up to its long-term trend (see our Q1 2024 Industry Update for a more detailed discussion).
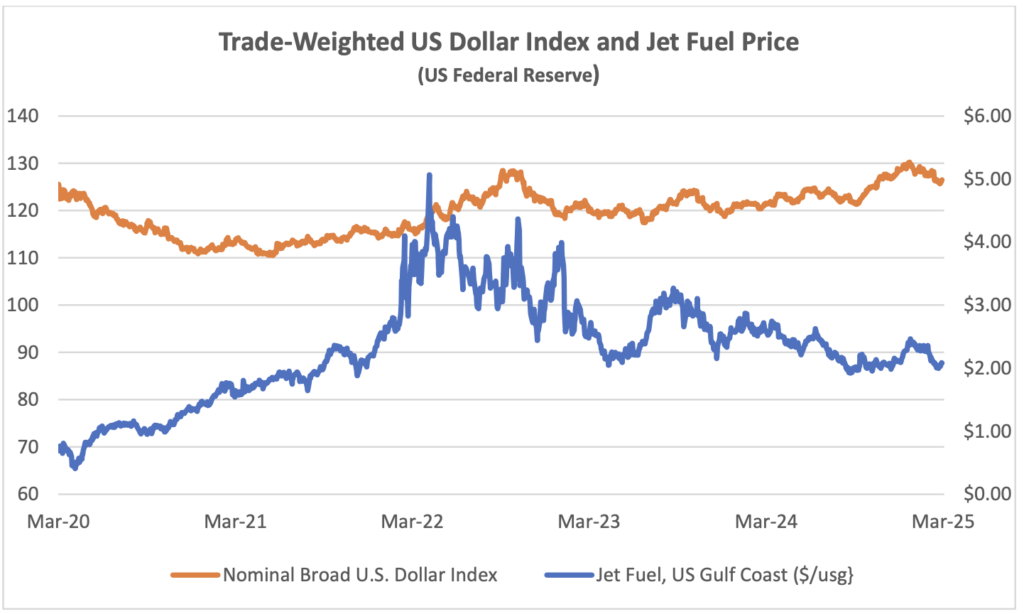
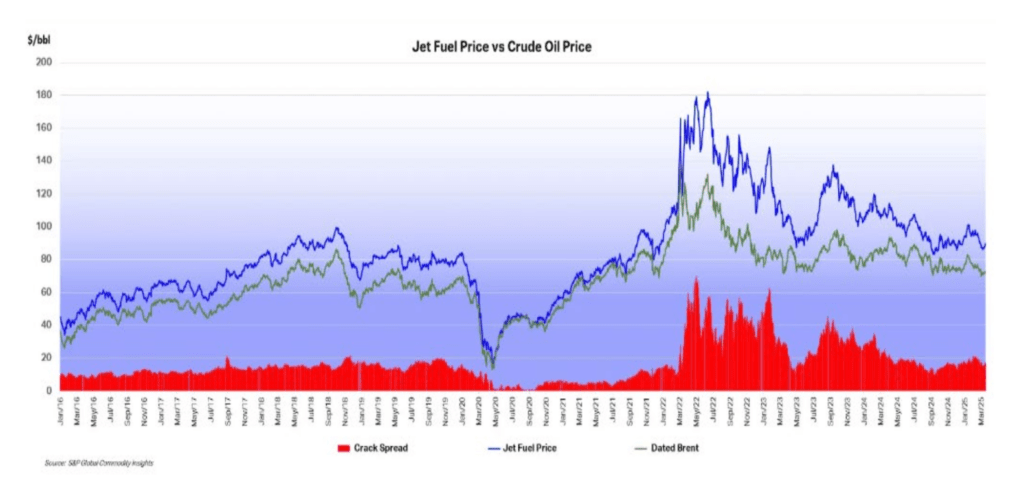
The US Dollar has recently surpassed its previous 2022 peak, creating pressure for airlines outside the US for dollar-denominated costs such as fuel, aircraft rents and aircraft spares. The price of jet fuel has remained volatile, but it has continued its gradual decrease from February 2024. This reduction has mainly been driven by a reduction in the “crack spread” from c.$30 to less than $17.
Another indicator that is potentially important to aircraft investors is the breakeven inflation rate on US Treasury Inflation-Protected Securities (TIPS). This indicator measures inflation expectations and it matters because used aircraft values are strongly influenced by the cost of new aircraft and over time this cost is linked to US Dollar inflation. In the short term this linkage is driven by escalation clauses in aircraft purchase contracts and in the long term by the general input cost environment for the aircraft manufacturers. The chart below compares the breakeven rate for 10-year and 5-year TIPS.
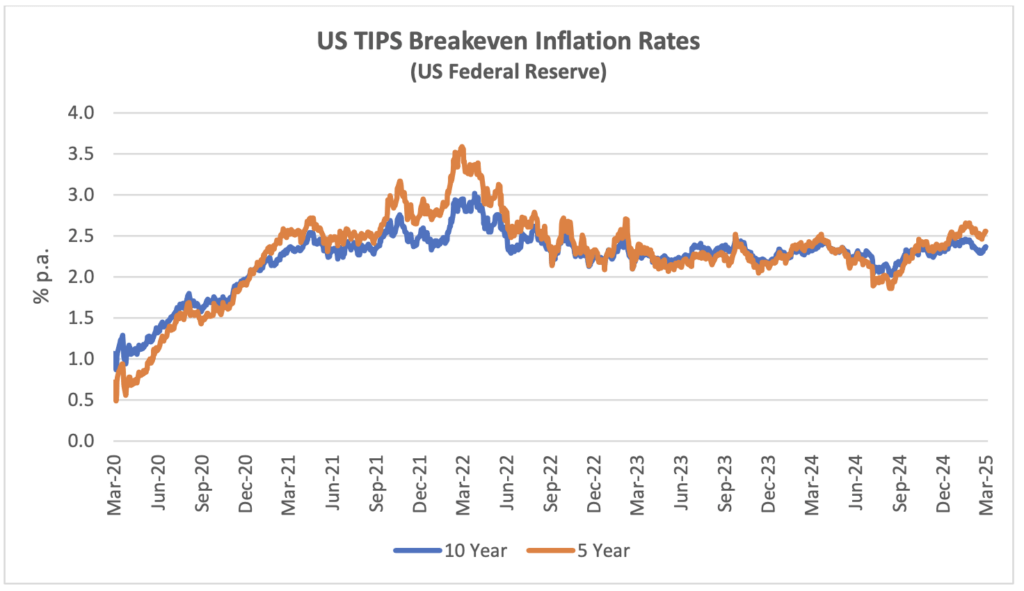
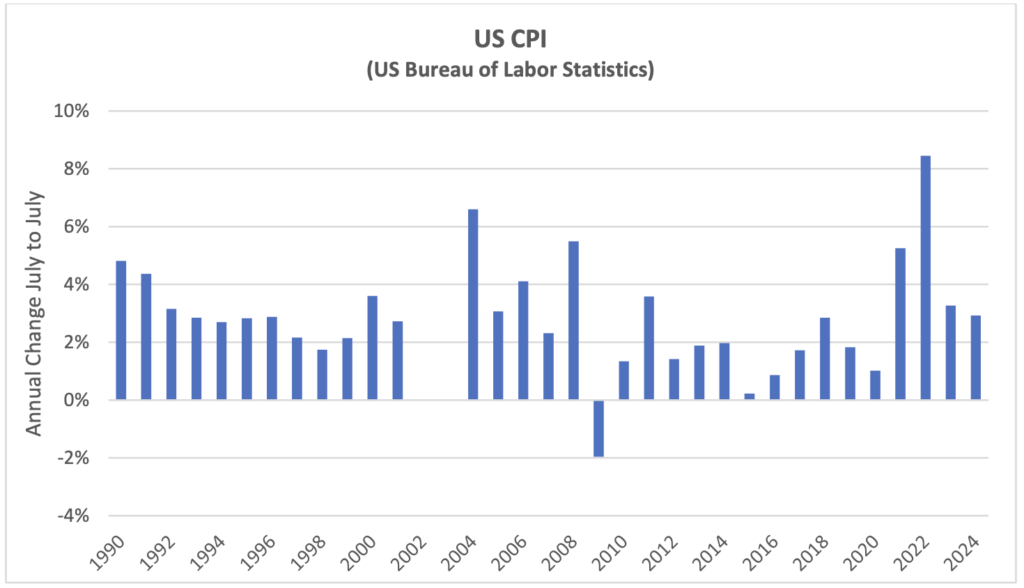
Although medium or long-term inflation expectations have never gone higher than 3.5%, actual inflation experience has been much higher in the last few years. This has led to higher appraised values for new aircraft. If tariffs are applied to aircraft and/or aircraft components this is likely to increase the cost of new aircraft.
Traffic and Aircraft Demand
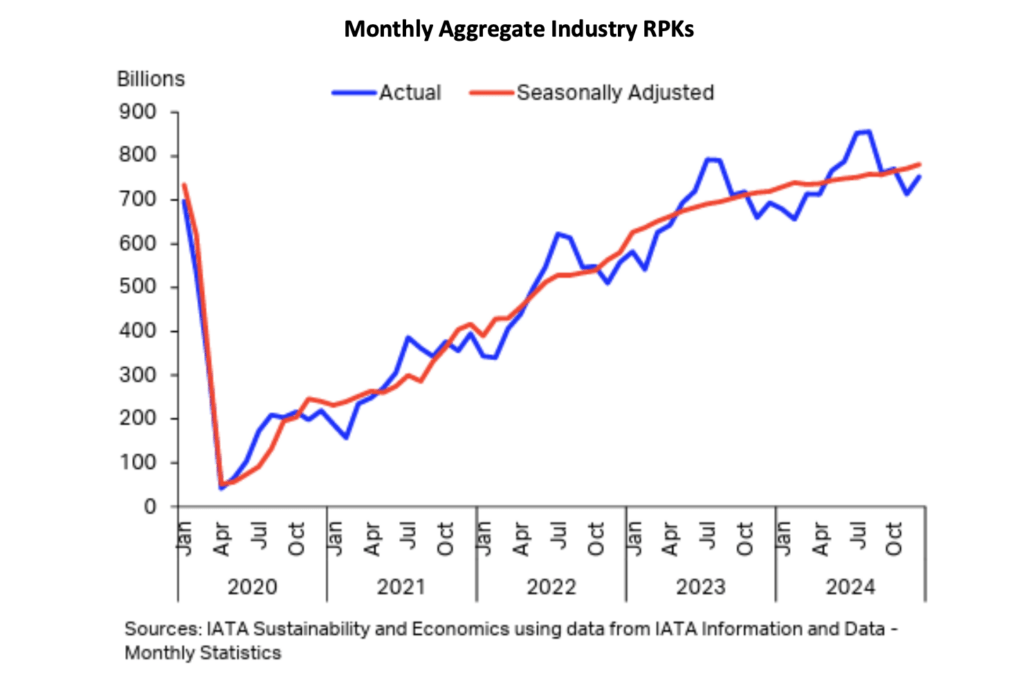
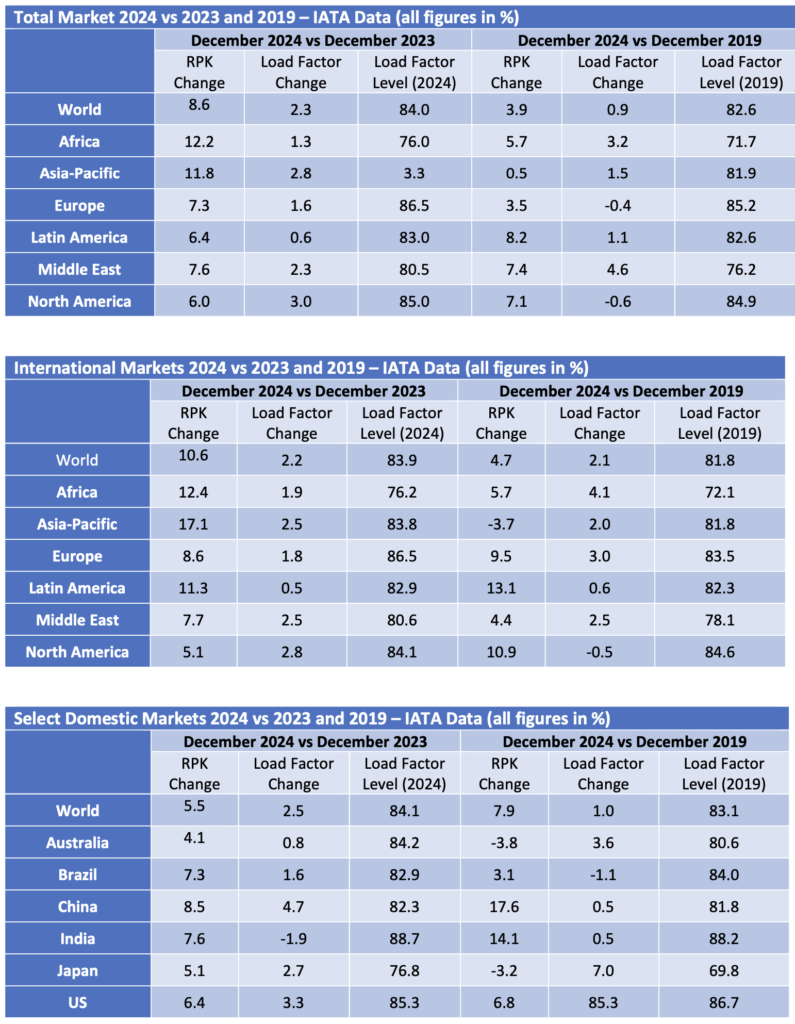
During 2024 RPKs [2] grew 10.4%, slightly faster than ASKs[3] leading to an improvement in load factor, and broadly in line with IATA’s full year forecast of 11.2%. 2024 also was the first year where total RPKs exceeded 2019. Growth by region was strongest in Asia-Pacific mainly because its recovery has been delayed compared to the rest of the world due to the relative persistence of pandemic-related government travel restrictions. International traffic growth was higher than domestic for the same underlying reasons.
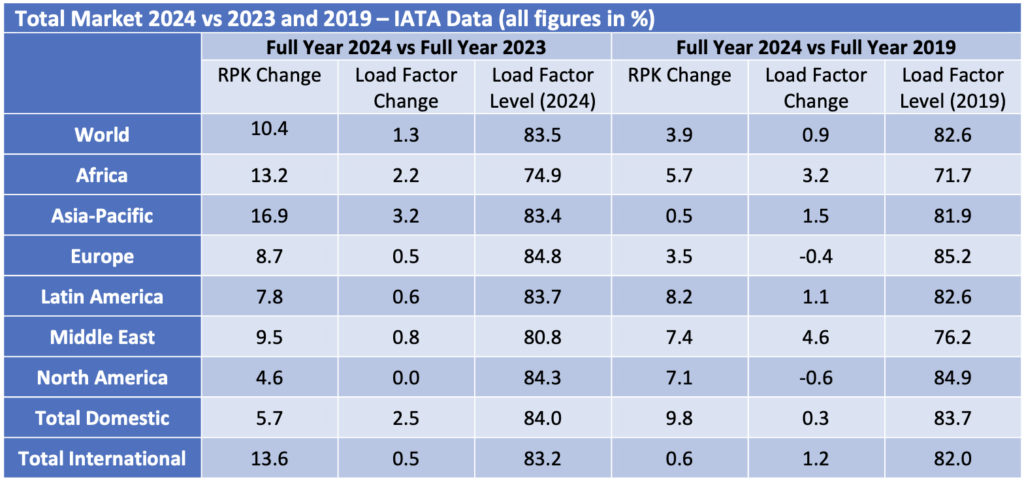
The month of December 2024 was a bit weaker than expected (the IATA forecast referenced above was updated just weeks before the end of the year). However, growth improved significantly in January 2025, suggesting that December’s figures did not presage a persistent weakening trend.
Although some short-haul aircraft serve international routes nearly all long-haul aircraft do so, and this is reflected in the relative demand for single-aisle (narrowbody) and twin-aisle (widebody) aircraft. Aircraft demand can be measured in terms of aircraft in service and ASKs, the standard measure of aircraft capacity deployed by airlines which indicates how intensively aircraft are being flown. Single aisle aircraft demand on both metrics is higher so far in 2024 than in 2019 whereas twin-aisle aircraft are marginally weaker by aircraft in service and lagging more in terms of ASKs. The difference between the two metrics may be down to the gradual move away from very large aircraft such as the B747 and A380 towards the smaller B787 and A350, resulting in fewer ASKs per aircraft unit. It is hard to see the TA 2024 data series because it is only very marginally lower than TA 2019.
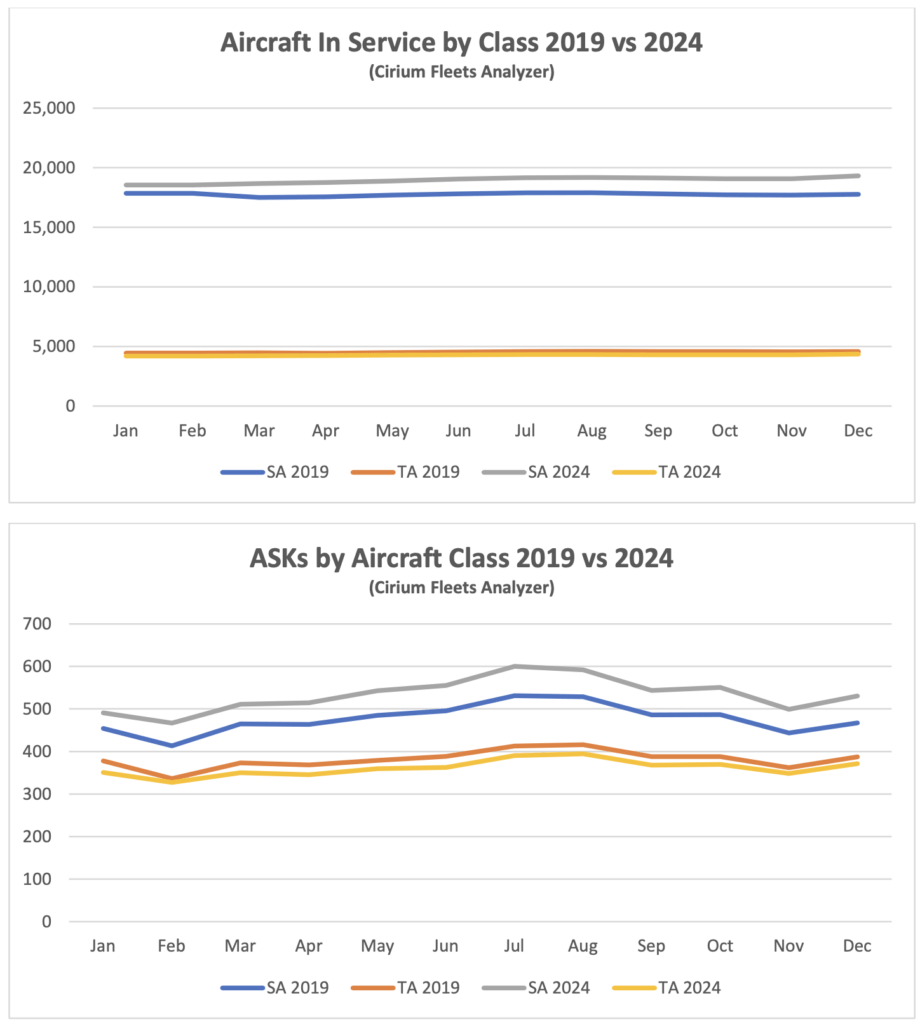
Full recovery has yet to be achieved for twin-aisle aircraft, mainly due to weak traffic to and from, and within the Asia-Pacific region. The figures by region in the tables above are based on airline domicile, so weak Europe to Asia traffic reduces recorded international RPKs in other regions. Twin-aisle aircraft in service has shown a greater improvement relative to 2019 than ASKs which suggests that aircraft are being returned to service with lower utilisation in anticipation of continued recovery.
New Aircraft Supply

Airbus achieved 766 total deliveries in 2024, very close to its revised target of 770, and is guiding a 7% increase to 820 in 2025. The only change to medium-term production targets by model was a delay of the projected entry into service of the A350 freighter to the second half of 2027. The Airbus CEO Guillaume Faury singled out supply chain problems at Spirit Aerosystems as causing delays in production increases for the A200 and A350.
The status of Airbus’s production plans is:

Boeing’s deliveries fell in 2024 because of the impact of a strike by members of the IAM and the FAA’s oversight of its production processes. Its inventory of B737s produced prior to 2023 fell from 175 to 55, implying that only 145 aircraft were built and delivered in 2024. The B787 inventory decreased from 50 to 25, implying that 26 aircraft were built and delivered in 2024. It is worth noting that these estimates assume that Boeing is using consistent definitions for inventory numbers which may not be accurate. Boeing plans to deliver all aircraft in inventory by the end of 2025.

Boeing has stopped providing official production guidance, so the monthly rates below come in shades of grey. Its long-term target for B737 production is 56 per month but this is clearly several years away. Fitch reports that B737 production is currently running at 20 per month, and the company plans to reach its maximum permitted rate of 38 by the middle of the year with a possible increase to 42 by year end subject to FAA approval. It plans to raise B787 production to 7 per month by the end of 2025 and to 10 by the end of 2026.

The number of commercial jets delivered by OEMs other than Airbus and Boeing showed a significant increase in 2024 which is likely to continue in 2025. Embraer increased commercial jet deliveries to 73 in 2024 and is guiding total deliveries between 77 and 85 in 2025. COMAC of China achieved a significant increase in C909 (a rebrand of the ARJ 21) and C919 deliveries to a combined 47 aircraft in 2024. Although there is no indication in any change of the current C909 production rate of 3 aircraft per month, company announcements indicate plans to deliver 30 C919s in 2025 and an increase in capacity to 50 aircraft a year.

Airline Industry Financial Performance
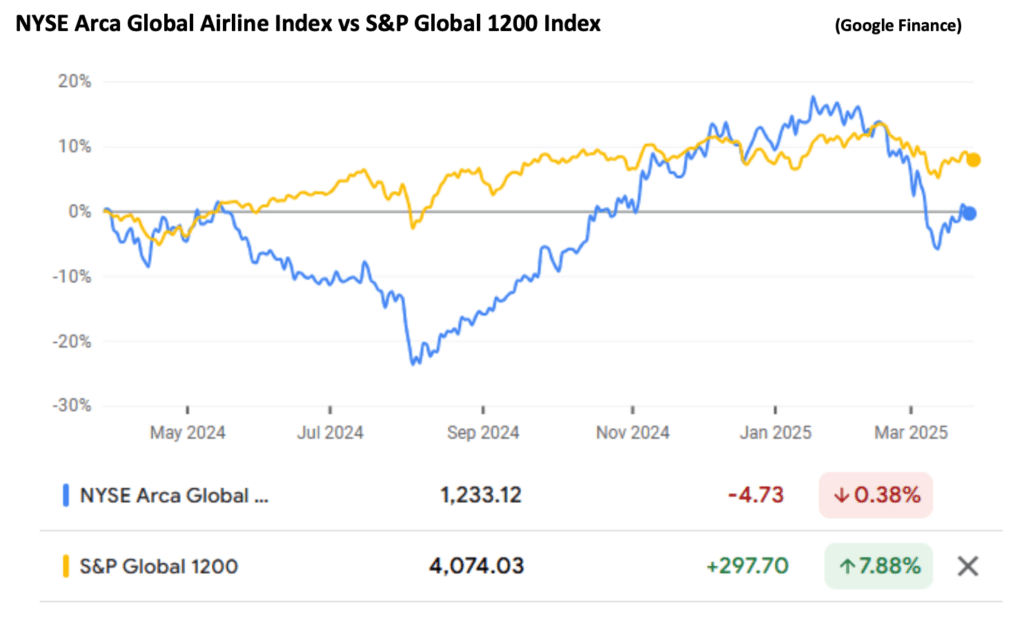
Airline shares rallied very strongly from Q3 2024 to catch up with the overall market. This was mainly due to strong performance by the US network airlines (United in particular) on the back of strong premium travel demand and moderating fuel prices. Since January 2025 there has been a sell-off due to the impact of economic uncertainty on the revenue outlook for these operators.
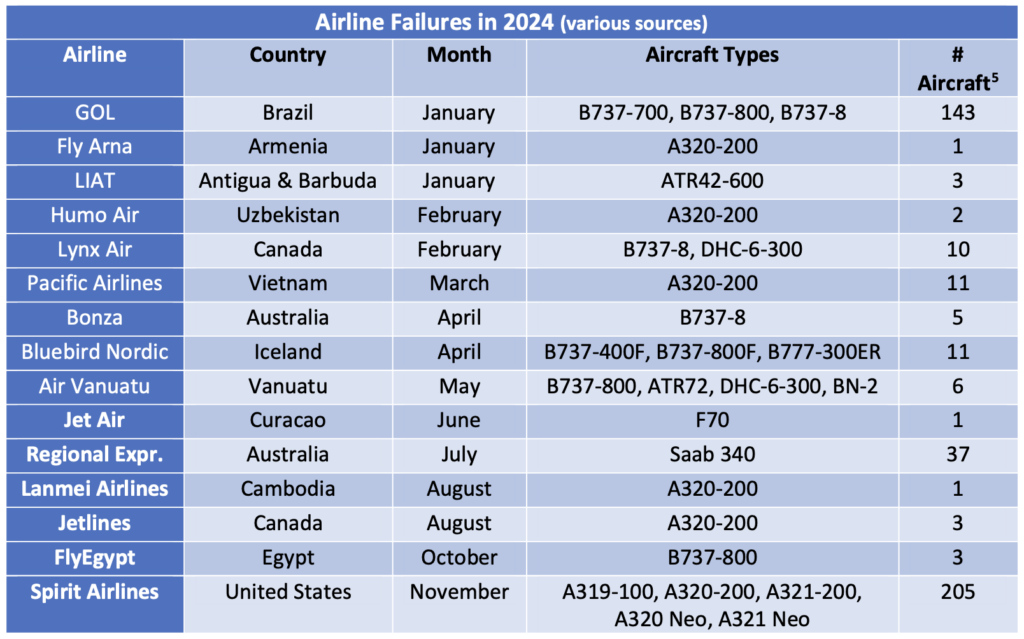
Ironically enough November also saw the largest airline bankruptcy of 2024 when Spirit Airlines filed for Ch. 11. Along with other US low-cost airlines Spirit had suffered from a switch in US passenger demand towards international travel and more effective competition from the large network airlines. It has also had to deal with the need to ground a significant proportion of its fleet due to unscheduled maintenance on its Pratt & Whitney GTF engines. Spirit exited bankruptcy at the beginning of March 2025 having successfully restructured its shareholding structure and some of its bond obligations. It is a measure of the strength of the aircraft market that it did not seek any concessions from its lessors.
The other large airline failure in 2024 occurred when GOL of Brazil filed for US bankruptcy protection in January. This was not a major surprise as GOL’s major competitors Avianca and LATAM had already done so during the pandemic and GOL had engaged in significant financial restructuring in the same timeframe.
[1] The CFM56 is used by both the A320 Ceo and B737NG, whereas the V2500 is only used by the A320 Ceo.
[2] RPKs is the acronym for revenue passenger kilometres, which is the product of the number of paying passengers times distance flown.
[3] ASKs is the acronym for available seat kilometres, which is the product of the number of available seats flown times distance flown.
Disclaimer
This Presentation has been made to you solely for general information purposes and is not intended to provide, and should not be relied upon for legal, tax, accounting, investment, or financial advice. This Presentation is not a sales material and does not constitute or form any part of any offer, invitation or recommendation to the recipient, its affiliates or any other person to underwrite, sell or purchase securities, assets or any other product, nor shall it or any part of it form the basis of, or be relied upon, in any way in connection with any contract or transaction decision relating to any securities, assets or any other product. None of Sirius, its affiliates or shareholders shall have any responsibility or liability to the recipient, its affiliates, shareholders or any third party in relation to this Presentation or any other document or materials prepared by Sirius or its affiliates, officers, directors, employees, advisers, or agents. Sirius and its affiliates, officers, directors, employees, advisers, and agents have taken all reasonable care to ensure that the information contained in this Presentation is accurate. Neither Sirius nor any of its affiliates, officers, directors, employees, advisors, or agents has any obligation to update this Presentation. Under no circumstances should the delivery of this Presentation, irrespective of when it is made, create an implication that there has been no change in the affairs of the entities that are the subject of this Presentation. This Presentation may be updated and amended by a supplement and, where such supplement is prepared, this Presentation will be read and construed with such supplement. The statements herein which contain such terms as “may”, “will”, “should”, “expect”, “anticipate”, “estimate”, “intend”, “continue” or “believe” or the negatives thereof or other variations thereon or comparable terminology are forward-looking statements and not historical facts. No representation or warranty, express or implied, is made as to the fairness, accuracy, or completeness of such statements, estimates and projections. The recipient should not place reliance on any forward-looking statements. Neither Sirius nor its affiliates undertake any obligation to update or revise the forward-looking statements contained in this Presentation to reflect events or circumstances occurring after the date of this Presentation or to reflect the occurrence of anticipated events. The information set out in this Presentation has been prepared by Sirius based upon various methodologies and calculations which it believes to be reasonable and appropriate. Past performance cannot be a guide to future performance. In preparing this Presentation, Sirius has relied upon and assumed, without independent verification, the accuracy and completeness of all information available from public sources or which was provided to it or otherwise reviewed by it. This Presentation supersedes and replaces any other information provided by Sirius or its affiliates, officers, directors, employees, advisers, or agents in respect of the content of the Presentation. No information or advice contained in this Presentation shall constitute advice to an existing or prospective investor in respect of his personal position. None of Sirius, its affiliates, or its affiliates’ officers, directors, employees or advisers, connected persons or any other person accepts any liability whatsoever for any loss howsoever arising, directly or indirectly, from this Presentation or its contents.
